





Abstract
Atropisomers exist when axial chirality is present as a result of conformationally restricted rotation around a single bond. The interconversion rate of the individual atropisomers is critical to the assessment of chiral stability of a drug throughout scale-up, development, production, and storage as well as in vivo pharmacokinetics. We describe the application of vibrational circular dichroism spectroscopy coupled with quantum mechanics simulations to assign the absolute axial chirality and measure the racemization half-life of a series of potential anxiolytic drugs that act as γ-aminobutyric acid modulators.
INTRODUCTION
Approximately 60% of drugs making it into the commercial market are chiral. 1 While most chiral drugs have conventional rectus (R) or sinister (S) stereocenters, some exhibit axial chirality arising from restricted rotation around single bonds such that individual conformers are stable enough to be isolated—so-called atropisomers (Fig. 1). Examples of drugs with axial chirality due to atropisomerism include the antibiotic vancomycin and the anticholinergic telenzepine (used to treat peptic ulcers).2,3
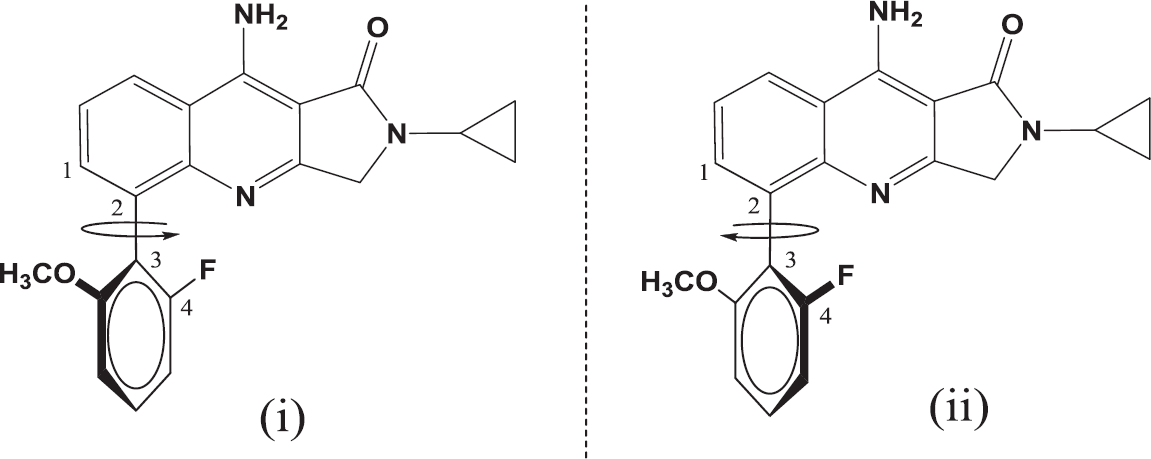
Atropisomers arising from restricted rotation of the biphenyl group in the γ-aminobutyric acid (GABA) modulator of interest. The C1-C2-C3-C4 dihedral dictates whether the fluoro substituent is directed (
The presence of an atropisomeric species represents more than just a stereochemistry curiosity. The degree of interconversion between atropisomers (i.e., the chiral stability) can have serious implications for production of the compound (scale-up, purity assessment, and storage) as well as its effects in vivo. Atropisomerism has been classified in terms of the energy barrier to interconversion as well as the associated half-life to racemization.4,–6 For example, the Bristol–Meyers–Squibb compound BMS-207940, for treatment of congestive heart failure, exists as interconverting atropisomers that have concentration-dependent interconversion rates in plasma (t1/2 ≈ 2.5 h at 400 μg/mL versus t1/2 < 0.1 h at 20 μg/mL). 7 Naturally, interconversion causes significant challenges for pharmacokinetic and safety studies of the individual atropisomers. Unlike conventional stereochemistry, there are degrees of axial stereochemistry ranging from conformations essentially locked in position to the other extreme of conformations exhibiting nearly free rotation. A general guideline has been proposed by LaPlante et al. suggesting three classes of atropisomers in a drug discovery context: Class 1 are those with an interconversion barrier <∼20 kcal/mol and are likely to have a fast rotation rate allowing for development as essentially a single freely rotating compound; Class 2 have interconversion barriers between ∼20 and 30 kcal/mol and exhibit delayed rotation with t1/2 on the order of minutes to weeks, necessitating more challenging development as a mixture of the two formally separable atropisomers (e.g., BMS-207940 above); Class 3 have barriers > 30 kcal/mol (t1/2 on the order of years) and likely may be developed as a single, stable atropisomer. 6
The γ-aminobutyric acid (GABA) modulators in the present study are designed as potential anxiolytics for psychiatric indications.8,9 The compounds contain a biphenyl substructure and may exhibit atropisomerism depending on the size and nature of the substituents. In addition to the quantification of chiral stability, the assignment of absolute axial stereochemistry is desirable to differentiate the biological activities of the individual atropisomers (i.e., if only one of the atropisomers is biologically active, which one is it and can structure-activity relationships be established?). Data for the separated atropisomers of a representative GABA compound are shown in Fig. 2. One of the atropisomers is 60 times more active than the other, and the absolute chirality and stability were unknown at the time they were tested. By combining vibrational circular dichroism (VCD) spectroscopy and quantum mechanics simulations, a comprehensive knowledge of the energetics, rotational interconversion rates, and absolute stereochemistry associated with biological activity may be built as powerful assets for medicinal chemistry teams to interpret data for existing compounds and to design new compounds with desired properties.
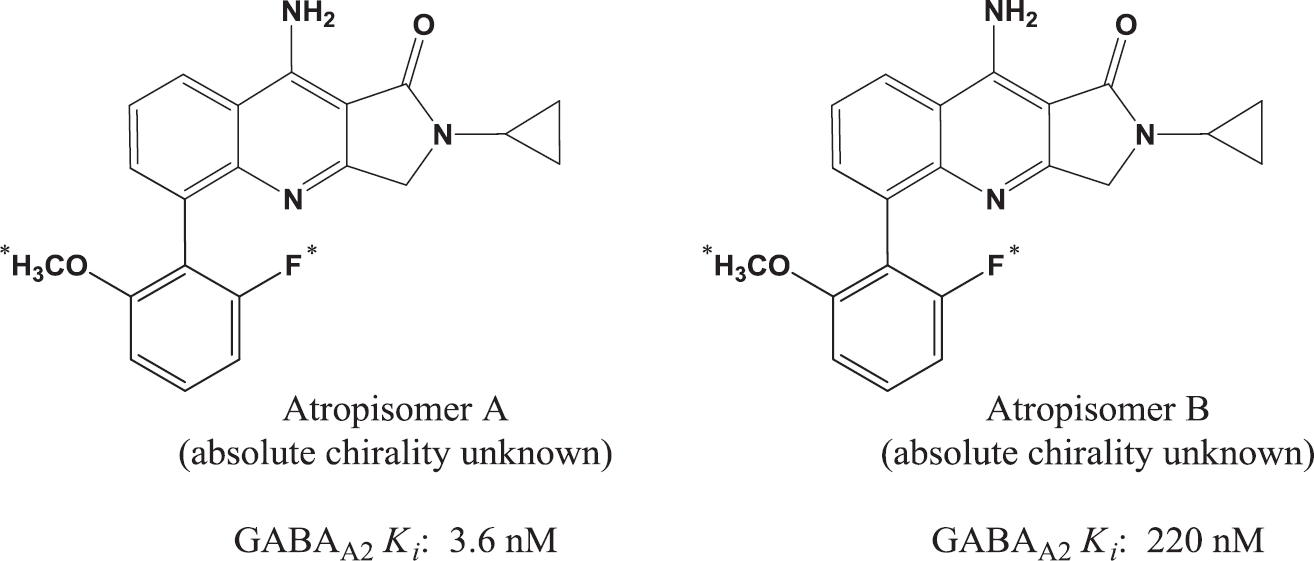
Biological data for the separated atropisomers. “Atropisomer A” is 60 times more active at the target relative to “Atropisomer B.” However, the absolute chirality and interconversion rate were both unknown at the outset of this study.
While traditional applications of vibrational spectroscopy are “blind” to the specific enantiomeric state or enantiomeric excess, VCD permits acquisition of infrared (IR) spectra, which are phase sensitive to the specific chiral structure present. In the VCD experiment, the differential absorbance of right-versus left-circularly polarized light is measured. Pure enantiomeric species will produce spectra that are identical in all respects, except that the spectral features of the two enantiomers will be opposite in sign, i.e., if a band is positive for one enantiomer it will be negative for the opposite enantiomer. An overview of vibrational optical activity, of which VCD is a subset, provides a detailed presentation of the technology. 10
While the raw VCD spectra can be used to differentiate the two enantiomers, the spectra alone are not independently sufficient to assign absolute chirality. Absolute assignment requires comparison of the VCD spectrum to a reference spectrum for which the specific signs of bands are known to be directly linked to an established absolute chirality. While such a reference spectrum can be obtained from a compound for which the absolute chiral structure is known (i.e., either through X-ray crystal structure analysis or from a batch generated through a stereo-specific synthesis), most often no such prior compound or knowledge is available. In these cases the reference spectrum must be obtained from quantum mechanical simulations of the VCD spectrum.11,–14
In this paper, VCD spectroscopy coupled with quantum mechanical simulations is used to assign the absolute axial chirality and measure the half-life of a series of potential anxiolytic drugs that act as γ-aminobutyric acid (GABA) modulators including the enantiomeric pair 9-amino-2-cyclopropyl-5-((P)-2-fluoro-6-methoxy-phenyl)-2,3-dihydro-pyrrolo[3,4-b]quinolin-1-one and 9-amino-2-cyclopropyl-5-((M)-2-fluoro-6-methoxy-phenyl)-2,3-dihydro-pyrrolo[3,4-b]quinolin-1-one (Fig. 1). The resultant understanding proved critical in decisions regarding suitability of these compounds as drug development candidates.
RESULTS AND DISCUSSION
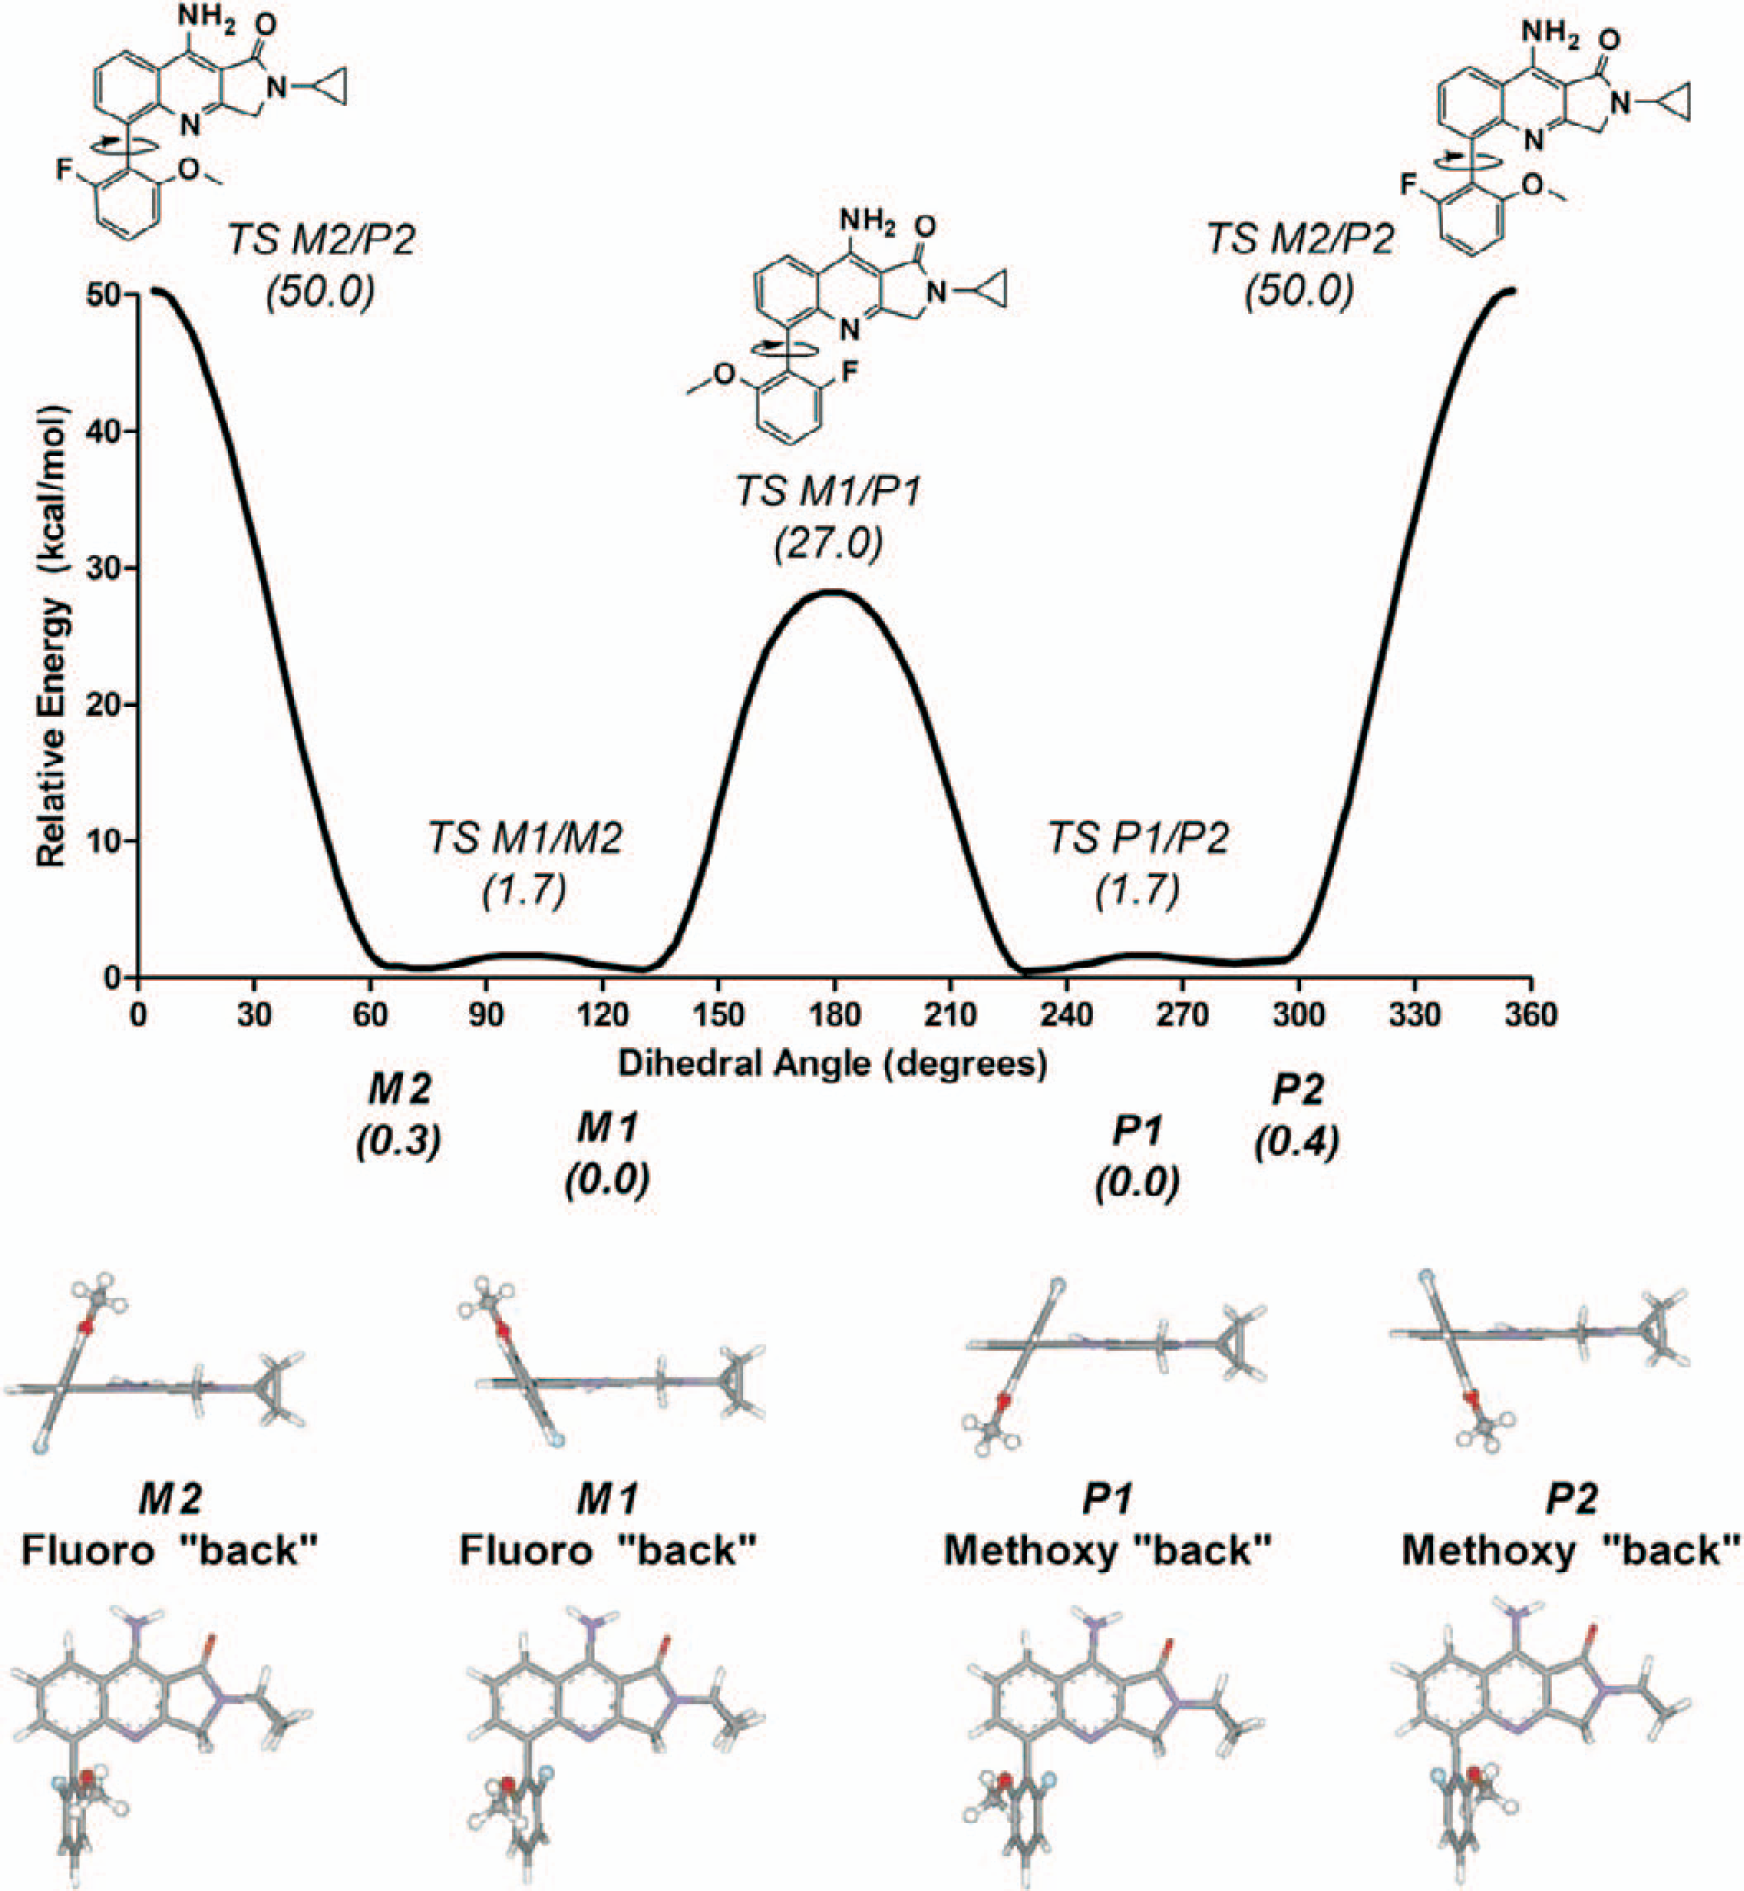
Relative energies (6-311G**/B3LYP) of optimized minima and transition states along the dihedral rotational profile. Two sets of conformers were located [labeled (M1, M2) and (P1, P2)] that differ by the orientation of the methoxy and fluoro substituents relative to the plane of the quinoline. The origin of the observed atropisomerism is the set of barriers between these pairs of conformers (at dihedral angles ∼0° and 180°). The individual M and P minima are nearly isoenergetic and have essentially free rotation within each pair. The barrier between M and P minima is more easily surmounted by passing the fluorine near the quinoline nitrogen (TS M1/P1, 27 kcal/mol) rather than passing the methoxy near the quinoline nitrogen (TS M2/P2, 50 kcal/mol).
To characterize the energy barriers more precisely, each of the minima and transition states along the torsional profile was optimized using a larger 6-311G** basis set and four different density functionals (B3LYP, CAM-B3LYP, B3PW91, and B97D). All four functionals (including the B97D, which includes an empirical accounting of dispersion) provide similar predictions of the relative energies and barriers associated with the rotational path. The 6-311G**/B3LYP data (Fig. 3) illustrate that the barrier between the P and M configurations is approximately 27 kcal/mol when taking the path in which the fluorine comes into close proximity to the nitrogen of the quinoline ring, whereas the barrier is nearly twice as high (50 kcal/mol) for conversion between P and M configurations by rotation in the opposite direction (i.e., passing the methoxy group near the nitrogen of the quinoline ring). The rate-limiting barrier to interconversion of ∼27 kcal/mol is at the upper end of Laplante's “class 2” of atropisomers, 6 suggesting that atropisomerism likely exists, but interconversion may occur on a timescale of days to weeks such that development in clinical trials and long-term storage as a single entity might require additional investigation.
Figure 4 illustrates the infrared absorbance and VCD spectra collected from samples of each atropisomer. As expected, the infrared spectra of each sample appear virtually identical, while the VCD spectra of the two samples are quite obviously opposite in sign. Comparison of infrared and VCD spectra of each atropisomer also provides an additional means of checking if any contaminants or impurities are present in one of the samples, and the quality of the spectra is sufficient to attempt assignment of absolute chirality via comparison to simulations.
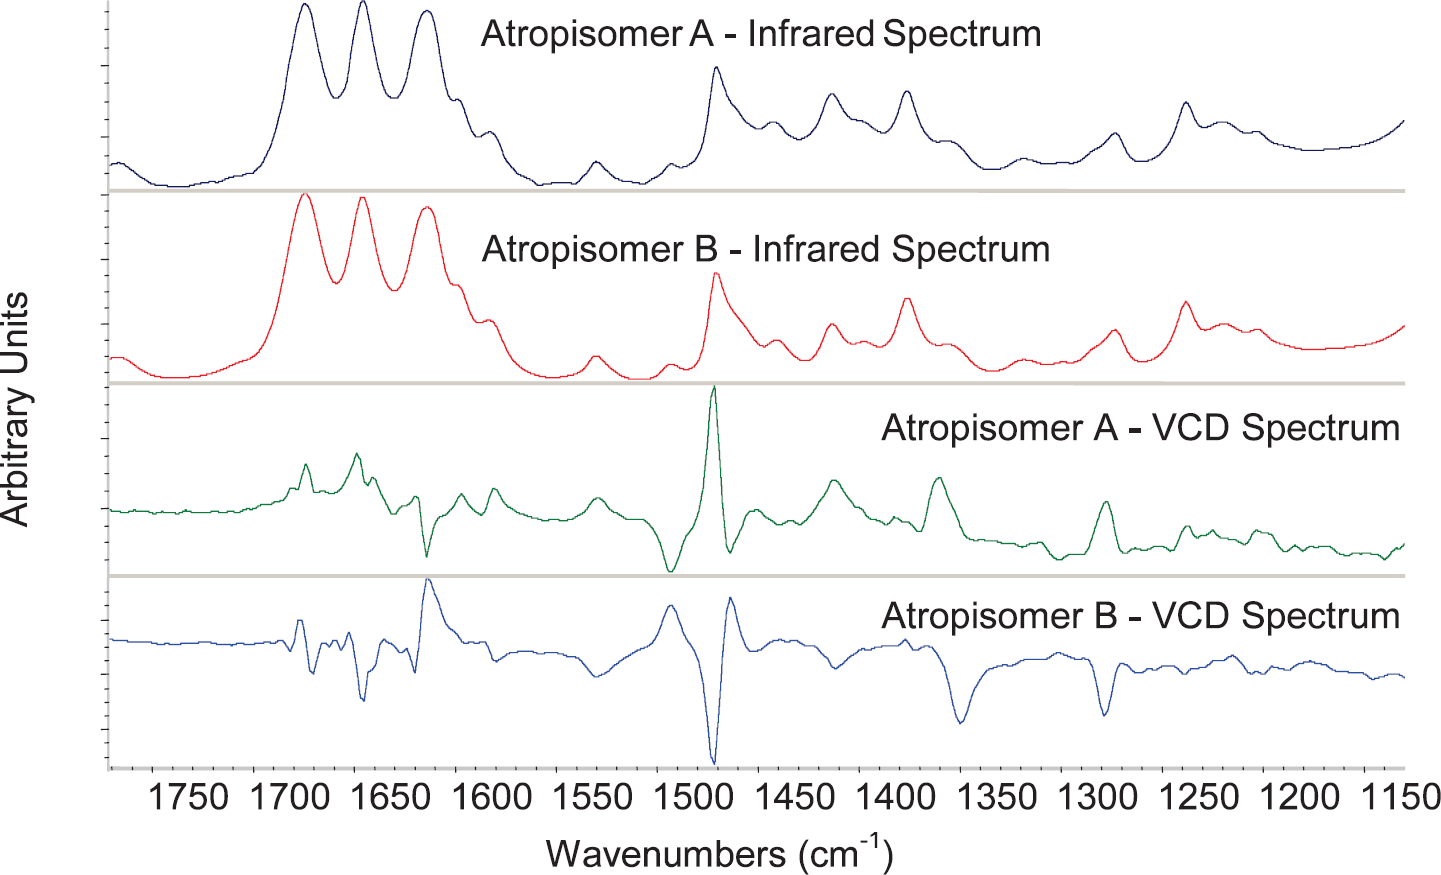
Experimental infrared and VCD spectra for Atropisomer A and Atropisomer B.
An overlay plot of the density functional theory (DFT) computed VCD spectra (6-311G**/B3PW91) for the individual M conformers lying within 1 kcal/mole of the global minimum energy structure is presented in Fig. 5. The individual conformation of a molecule imparts dramatic differences in both the intensity and sign of the majority of the bands in the VCD spectrum. Boltzmann weighted averaging across the conformers is required to approximate the observed spectrum. In cases where differing conformations result in inversion of a band (e.g., the bands at 1710 cm−1), it is imperative that all populated conformations in the actual sample have been identified and that the relative energies used for Boltzmann weighted co-addition of the conformational spectra are accurate. When very low-lying conformers demonstrate multiple bands that are inverted (as they are across the entire simulated spectra for this compound), reliance on DFT relative energies for accurate Boltzmann weighting should be done with caution even when using large basis sets.
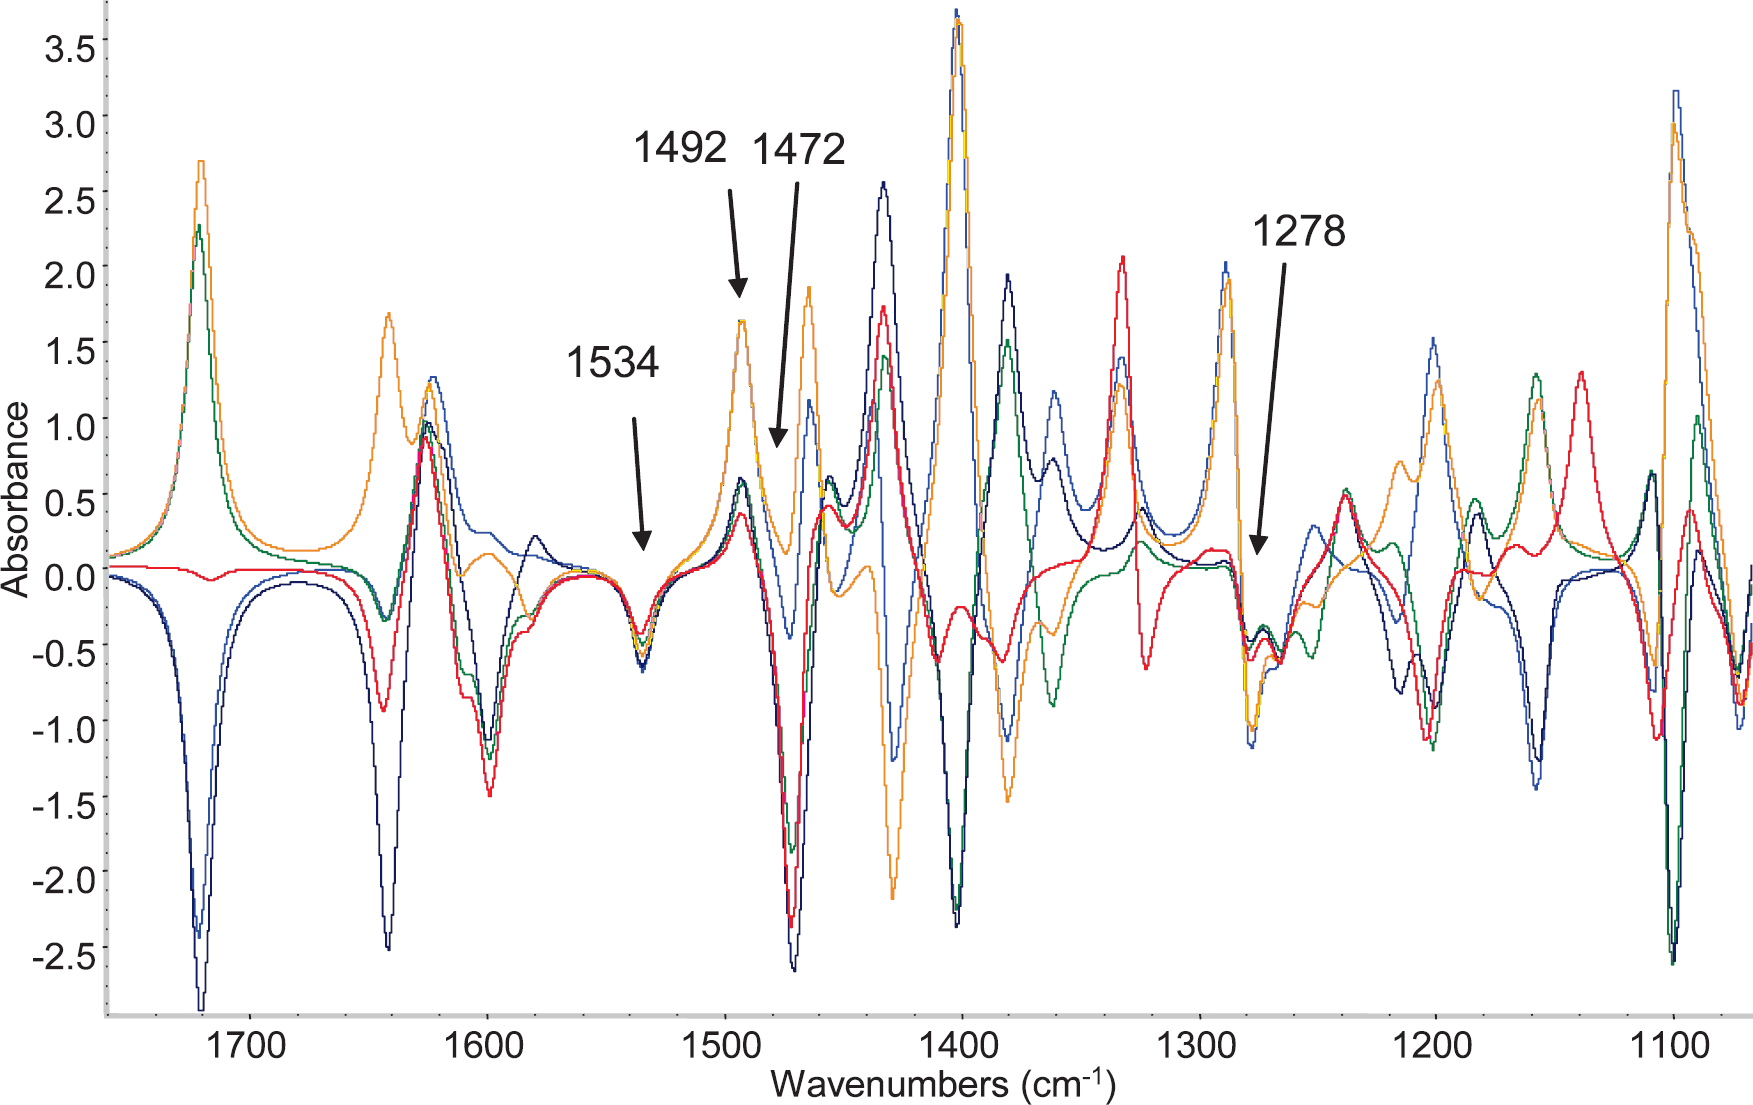
Calculated VCD spectra for the individual conformers of the M configuration that reside within 1 kcal/mole of the global minimum energy structure. The individual conformers generally produce bands of varying intensity and phase, and each contribution must be accurately Boltzmann averaged to produce a composite spectrum for comparison to the experimental spectrum. However, several bands (1534 cm−1, 1492 cm−1, 1472 cm−1, and 1278 cm−1) have contributions from all conformers that preserve the same phase and thus do not rely upon accurate Boltzmann weighting. These bands are more reliable in the comparison to experimental data.
However, the simulated spectra in Fig. 5 also exhibit regions where the profile and sign of a specific band is consistent across all conformations. Interpretation of these bands is less influenced by the precision of the Boltzmann weighting, and there is a higher degree of confidence that possible omissions in identified conformations and/or accuracy of calculated energy levels will not lead to erroneous assignment of absolute chirality. Bands from 1550 to 1470 cm−1 and a set of bands near 1278 cm−1 fall into this high-confidence category.
The direct comparison of phase for the Boltzmann weighted average of the calculated VCD spectra versus the experimental VCD spectra collected for Atropisomer A and Atropisomer B is presented in Fig. 6. Atropisomer A unambiguously corresponds to the P configuration, while Atropisomer B corresponds to the M configuration. By naming convention, Atropisomer A can be assigned as 9-amino-2-cyclopropyl-5-((P)-2-fluoro-6-methoxyphenyl)-2,3-dihydro-pyrrolo[3,4-b]quinolin-1-one and Atropisomer B as 9-amino-2-cyclopropyl-5-((M)-2-fluoro-6-methoxy-phenyl)-2,3-dihydro-pyrrolo[3,4-b]quinolin-1-one.
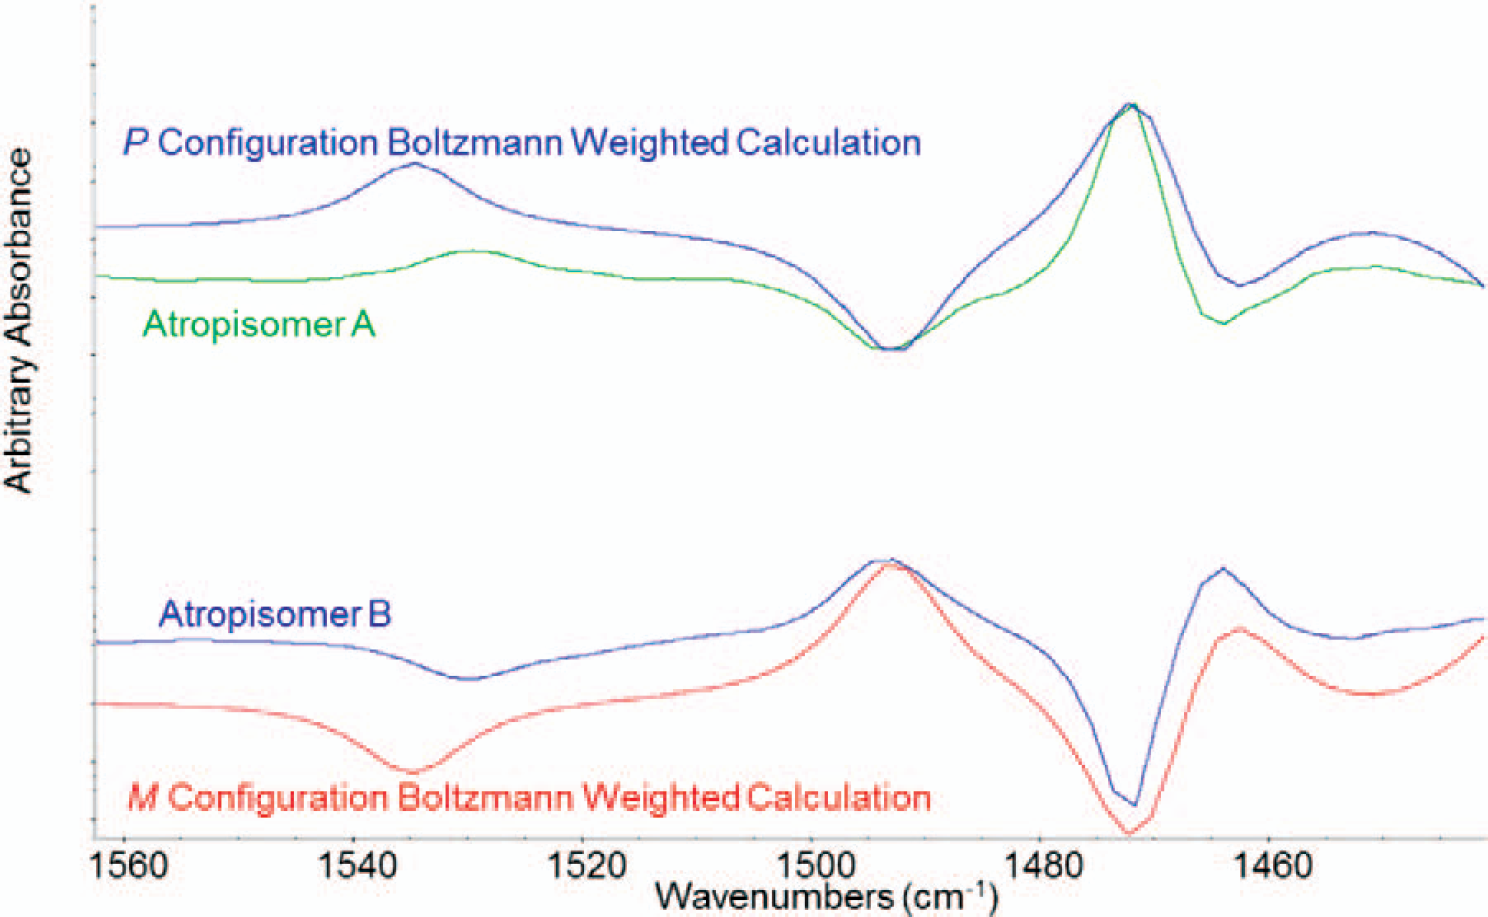
Direct comparison of the measured VCD spectra and the Boltzmann weighted simulated spectra. The matching of phase within this high-confidence region of the spectrum allows assignment of Atropisomer A as the P configuration and Atropisomer B as the M configuration.
Interpretation of the vibrational origin of a band also plays a role in adding confidence to the VCD assignment. These assignments were deduced from animations of the vibrational modes in the simulated spectra and verified by their consistency with standard ranges of IR mode assignments. For example, the 1646 cm−1 band corresponds to deformation of the primary amine. The 1614 cm−1 band corresponds to aromatic ring deformations of the fused ring system in conjugation with the pendant aromatic and involves some NH2 deformation and will therefore be matrix sensitive. The 1534 cm−1 band, however, corresponds to a highly localized in-plane fused ring vibration. As such, this band is expected to be largely insensitive to differences in the vapor phase matrix of the calculation versus the solution phase of the actual sample. Fortunately, this band also exhibited consistency of sign in the computed spectra across all conformers. The 1493 cm−1 band is associated with CH3 deformation of the aryl methoxy. Analogous to the 1534 cm−1 fused ring vibration band, the CH3 deformation should be largely insensitive to matrix.
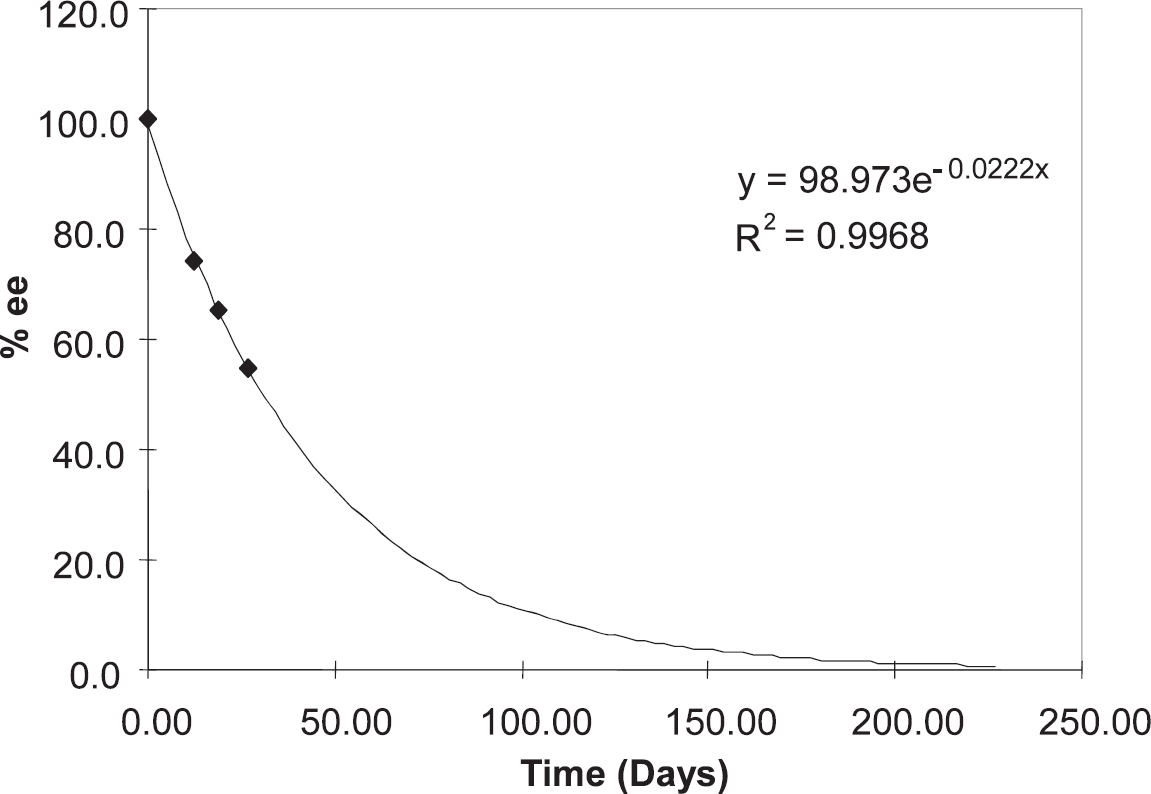
Contains the plot of percent ee vs. time for Atropisomer A at 31 °C in d6-DMSO. The exponential fit of the four data points has been extrapolated to 250 days but was not forced to zero.
RACEMIZATION KINETICS
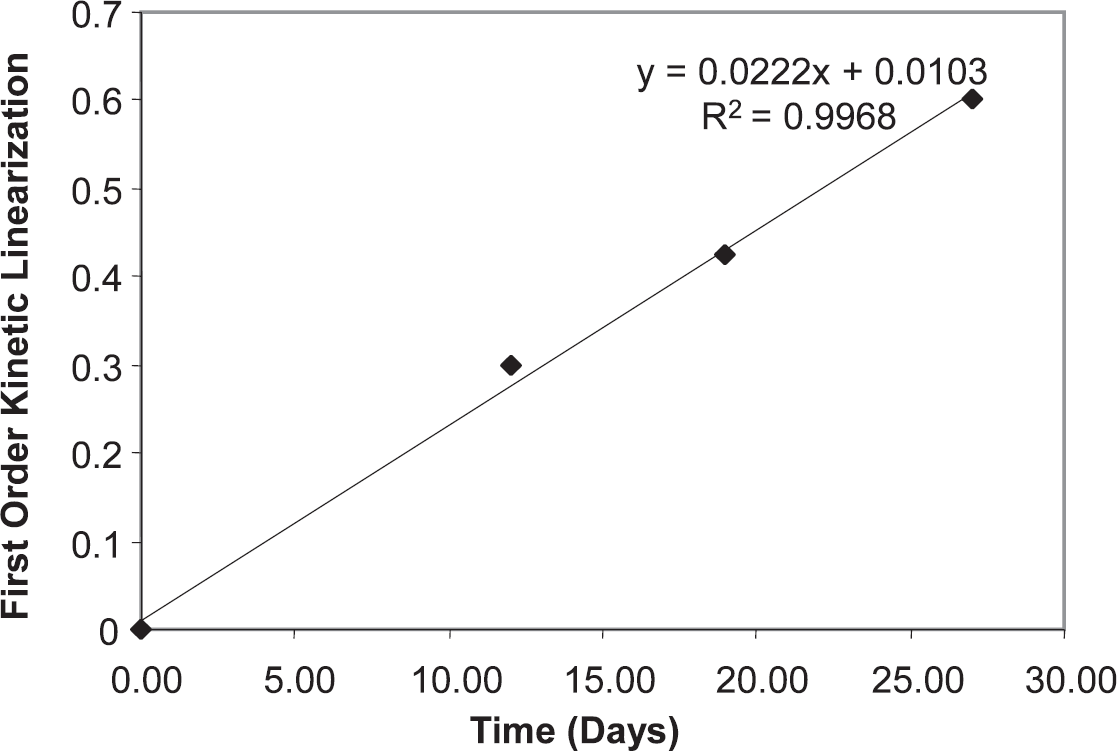
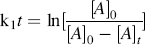
First-order kinetic calculations were performed according to the rate law mathematics presented in Eq. 1, where k1 is the rate constant and A is the relative analyte concentration, i.e., intensity. The integrated form of the first-order rate equation is presented in Eq. 2, where the subscripts denote the initial time (0) and subsequent times thereafter (t), respectively. Finally, the equation for calculation of the reaction half-life (t1/2) is presented in Eq. 3. Results of the first-order kinetics analysis are presented in Fig. 8.


CONCLUSION
Experimental and computational VCD studies have been applied to a representative compound within a chemical series of GABA modulators exhibiting biological activity consistent with anxiolytic benefit. The resulting absolute assignment provides drug discovery teams with data that can be used for important decisions regarding advancement into clinical trials. In this work, the atropisomer associated with stronger biological activity is assigned to the P configuration. Second, the computed barrier to interconversion (∼27 kcal/mol) suggests that development of the more active atropisomer as a single entity represents an elevated risk of technical challenges during drug development with respect to chiral stability. The measured racemization half-life via monitoring of VCD signal was 31 days in deuterated dimethyl sulfoxide (d6-DMSO) and could conceivably be significantly shorter under biological conditions. Finally, the procedure was applied to assess related compounds within the series. The computed barriers provide a reasonable means for prospective molecular designs such that the resulting compounds either have essentially free rotation or are locked into a single atropisomer with an exceedingly slow interconversion rate.8,9
EXPERIMENTAL
Simulations of infrared and VCD spectra for each conformer were generated using an in-house program to extract spectral data from the Gaussian09 output file and fit Lorentzian line shapes (5 cm−1 line width) to the computed spectra. The software also provided for interactive selection of conformers and calculation of Boltzmann averages. Finally, the in-house software facilitated automated upload into commercial Fourier transform infrared spectroscopy software packages (e.g., Thermo Electron Omnic®) accepting the .csv format. In this manner, direct comparisons between simulated and experimental spectra can be made using the flexibility and tools of the commercial software.
Footnotes
ACKNOWLEDGMENTS
The authors thank Keith Herzog for synthesizing the racemate and Dr. John McCauley for performing the chiral separation into its atropisomers. We also thank Kathy Knappenberger for testing each atropisomer in the GABAA2 binding assay. Additional thanks to Dr. Marc Chapdelaine for leading the chemistry efforts in this project, and for being a tireless champion (along with Dr. Jim Empfield) of the utilization of VCD at AstraZeneca. Finally, special thanks to Pat Capobianco and Lars Jonsson for building and maintaining a computing system capable of handling hundreds of QM simulations per week.