






Abstract
We measured the photothermal lens signal in samples exhibiting high turbidity using a pump-probe scheme. We show that the photothermal lens signal properties remain nearly unchanged up to values of turbidity of 6 cm−1 despite the signal reduction due to the decrease of excitation power associated to turbidity losses. The signal starts decreasing abruptly for values of turbidity larger than 6 cm−1. Multiple light scattering yields a reduction of the temperature gradients' which results in a decrease of the effective signal. However, the signal-to-noise ratio remains above 50 for turbidity values of 9 cm−1, which corresponds to a reduction of light transmission by more than four orders of magnitude. We report on the detection of the photothermal lens signal through a 2 mm layer of organic tissue with a signal-to-noise ratio of about 500. This technique appears promising for imaging applications in organic samples, which usually exhibit high turbidity for visible and near-infrared light.
INTRODUCTION
The development of optical imaging methods using visible and near-infrared light for the detection of structures embedded in highly turbid environments has potentially important biomedical applications.1–3 These methods may become powerful alternatives to the widely used X-ray imaging and magnetic resonance imaging (MRI), without the associated safety and cost concerns. The levels of scattering and absorption of the tissue generally impede direct visualization of organs, tumors, and other structures inside a living body using light. Fluorescence, 4 bioluminescence, 5 photoacoustic, 6 and photoradiometry 7 imaging techniques have been developed. We propose a photothermal lens (PTL) method as an alternative for imaging and microscopy studies of complex turbid biosamples.8–10 In this work, we detail the applicability of the PTL method for strongly turbid media. The method is based on the detection of distortions of the wavefront of light generated by heat that results from the absorption of photons. Different authors have shown that the PTL method successfully determines absorption in the case of inhomogeneous systems. Olivares et al. have used PTL to measure absorption of titanium dioxide (TiO2) particles in films, keeping the scattering contribution low by reducing the pathlength of the sample. 11 Ryndina et al. have shown that the PTL method can be used to monitor crystallization processes in aqueous solutions despite the presence of scattering. 12 Larkin et al. have shown that for small turbidities the PTL signal decreases linearly as turbidity increases. 13 Lin and Yan have shown that the PTL technique can avoid the effect of light scattering in the determination of the sample's absorption. 14 Other authors have reported similar results on the negligible effect of scattering over the value of the PTL signal.15–18 The opposite is not true in general since PTL has been reported to affect the values of the scattering field. 19 The previous studies were limited to samples of relatively low turbidity. Real biosamples, such as human skin, exhibit turbidity values above 10 cm−1. Our goal was to evaluate the efficiency of the PTL method in samples with turbidity values well above 1 cm−1. We used a pump-probe, mode-mismatched experimental configuration where the excitation field is focused on to the sample and probe beam is collimated. To simulate turbid media, we used a water solution of latex microspheres of different diameters. Apart from the losses of excitation power due to scattering, the PTL signal is well described within the predictions of the usual thin-lens approximation for turbidity values below 6 cm−1 in a 1 cm-thick sample. This approximation considers that the Gaussian profile of the excitation field, and consequently the induced thermal lens, is not affected by turbidity losses. However, for values of turbidity larger than 7 cm−1, the signal starts decreasing abruptly. Turbidity that is high enough distorts the field's wavefront within the limits of the sample, reducing the temperature gradients and, as a consequence, reducing the efficiency of the PTL effect. These results confirm previously published theoretical predictions about the effect of high turbidity on the PTL signal. 20 Despite this limitation, we found that, even for turbidity values above 9 cm−1, we obtained a signal-to-noise ratio above 50. We demonstrate the efficiency of the PTL signal-detection method as a possible technique for imaging applications in real organic samples with high turbidity using a 2 mm thick piece of chicken meat and a highly turbid water solution of whole milk.
THEORETICAL CONSIDERATIONS
The theory of PTL effects has been discussed extensively. The most accepted model for the PTL experiment considers Gaussian probe and excitation beams.21–23 For the intensity of the excitation field in a turbid medium WT, we considered the thin-lens approximation where the Gaussian character of the field remains unchanged although the intensity values change over propagation throughout the sample according to the Beer– Lambert Law. Under this condition,

where Wo is the initial Gaussian excitation field intensity; αa = Naσa and accounts for losses related to the absorption that yields to heating, where Na is the concentration of absorbing species and σa is the absorption cross section; αS = NSσS and refers to turbidity losses, where NS is the concentration of scattering centers and σS is the scattering cross section; and z represents the coordinate in the direction of propagation of the beam of light. The thin-lens approximation breaks down for turbidity that is high enough. However, this work shows that the approximation is still valid for samples of relatively high turbidity. Absorption of the excitation field generates changes in the local temperatures. The temperature changes can be calculated using the heat diffusion Laplace's equation.21–23 The result, which takes into account scattering losses according to Eq. 1, is

where tc = ae2/4D and is the time buildup of the thermal lens, where ae is the radius of the excitation beam and D is the thermal diffusivity; Pe is the excitation light power; r is the transversal coordinate; and κ is the thermal conductivity. The change in temperature generates a phase shift of the probe electromagnetic field and can be calculated from

where λp is the probe light wavelength and ∂n/∂T is the thermal gradient of the refraction index. In the thin-lens approximation, integration of Eq. 3 along the pathlength of the sample L yields

where Φo = αaPeLeff(∂n/∂T)/(2 κλp) and is the on-axis phase shift, and Leff = [1 – exp([αa + αS]L)]/(αa + αS) and is the effective length. In this calculation we have considered that the radius of the Gaussian beam is nearly constant within the limits of the sample despite the presence of high turbidity. Phase shift Φ(r,t) affects the propagation of the probe field. Shen et al. have calculated the probe field at the detection plane with the phase distorted by the PTL effect. 22 The probe light transmission through a small aperture located at the detection plane can be calculated on the basis of this model.22–23 The signal S(t) is then defined as the relative change of the probe light transmittance of the aperture:
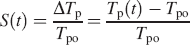
where Tp(t) is the aperture probe light transmission in the presence of the excitation beam and Tpo is the aperture's probe transmission in the absence of the excitation beam. In the derivation of Eq. 5, we neglected the effect of absorption and turbidity losses on the probe field. These losses affect in equal proportion the change in probe light transmission ΔTp and the probe transmission Tpo. As a consequence, this effect is automatically cancelled by the measurement of the signal according to Eq. 5. In the small-phase approximation (Φo ≪ 1), the stationary value of the signal (t/tc ≫ 1) can be expressed as22–23

where So = KαaPeL(∂n/∂T)/(κλp) is the signal for low losses, and K is a coefficient that depends only on parameters of the probe and excitation beams: Rayleigh ranges, wavelengths, and waist positions. This parameter does not depend on the properties of the sample, including its absorption and turbidity coefficients. The effect of turbidity losses on the value of the PTL signal is the reduction of the effective excitation power, which is taken into account in Eq. 6. This equation is valid within the approximation already discussed: The wavefront of the electromagnetic field is not affected by the presence of turbidity. In this situation, the value of the signal can be recovered by increasing the incoming power by the same amount. At high-enough turbidity (αSL ≫ 1) the thin-lens approximation will break down. In this situation, the wavefront of the field is substantially affected within the limits of the sample. As a consequence, the induced temperature values also change, thereby depleting the gradients of the refractive index and erasing the thermal lens. Under this condition, the signal can no longer be recovered by increasing the excitation power. A two-dimensional numerical calculation of the propagating field in the presence of scattering centers illustrates this idea. In Fig. 1 the effect of the presence of 1 μm diameter, two-dimensional simulated dielectric particle on an initially Gaussian wave is shown. The calculation was performed using the finite-difference time-domain (FDTD) method over a computational domain of dimensions 20 × 80 μm. 24 One particle of refractive index 1.5 located at the origin (see Fig. 1a) was considered. The initial Gaussian beam has a diameter of 10 μm and a maximal intensity of Wo = 2.5 × 10⁻³ W/m2. The field wavelength is 532 nm. Figure 1b shows the electric field intensity resulting from the scattering of the Gaussian electromagnetic wave on the simulated particle. The initial Gaussian distribution has been distorted even at a short distance from the particle. The average distance between particles is generally larger than 50 μm, even within the condition of high turbidity. The electromagnetic wave will encounter several particles before exiting a sample with a pathlength larger than the average distance between particles. Each scattering event requires a recalculation of the resulting field. The numerically calculated field intensity WT can be inserted into Laplace's equation to compute the new temperature gradient. The problem is not trivial and requires heavy computation. For practical reasons, we next followed an empirical approach to evaluate the effect of high turbidity on the PTL signal. High values of turbidity do indeed deplete the PTL signal below the values predicted by the thin-lens approximation. In addition to providing a detailed description of the light wave propagation, more accurate models must represent the scattering effects by a diffusion equation. However, in the experiments described next, the thin-lens approximation is still a good choice for values of turbidity up to 6–7 cm−1 in a 1 cm-thick sample. This result is remarkable considering the complexity of the problem, the substantial reduction of the transmitted power for those levels of turbidity, and the simplicity of the approximation.
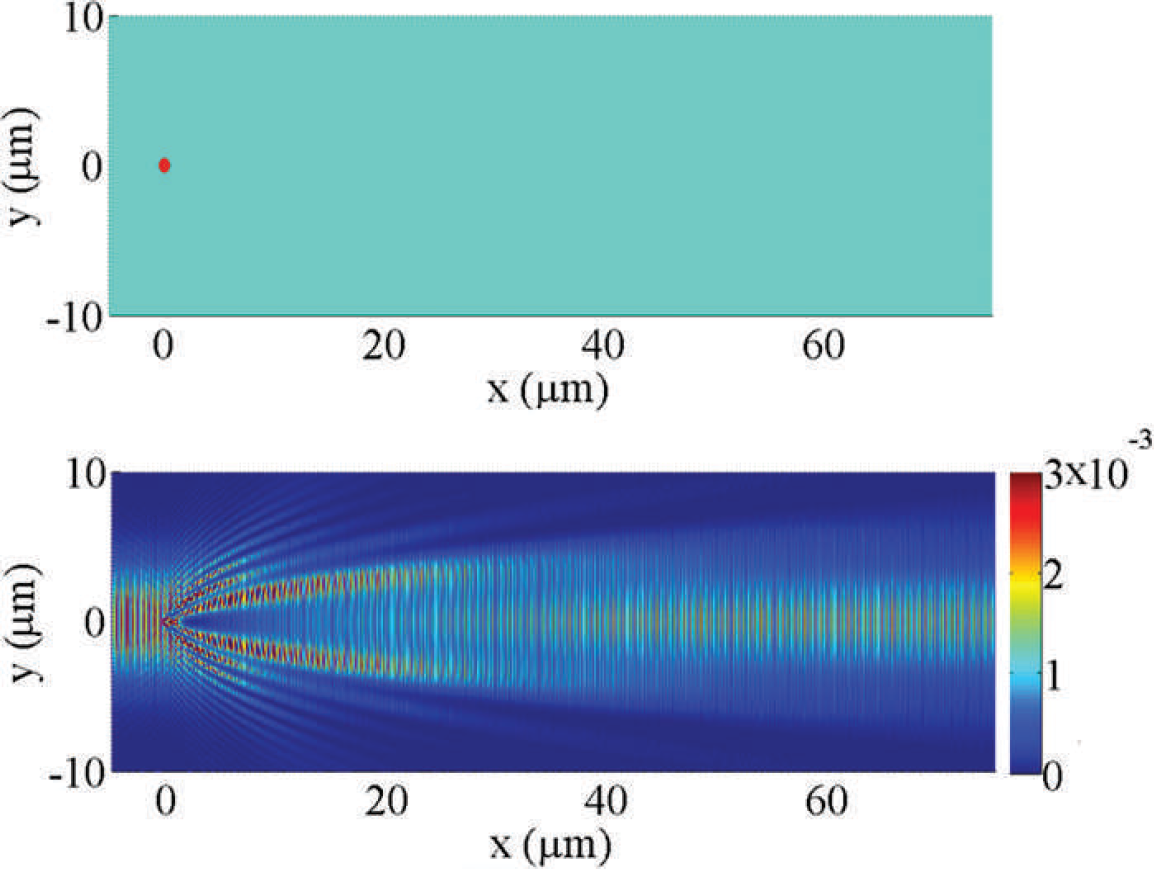
Numerical calculation of the electric field in the presence of a scattering particle. (
EXPERIMENT
In Fig. 2, depicts a schematic of the experimental setup. An optimized pump-probe PTL scheme that has been described elsewhere was used. 23 In this arrangement, the excitation beam is focused and the probe beam is highly collimated. As excitation light, a 200 mW continuous-wave (CW) diode-pumped solid-state (DPSS) second-harmonic Nd:YAG laser (532 nm) is used. The excitation beam focuses on the sample using a 20 cm focal-length lens (L1). An interference filter (F) is placed behind the sample to deplete the excitation light. This light is modulated using an optical shutter (Sh) at low frequency (0.2 Hz). A 1 mW CW radiation at 632 nm from a helium-neon (He-Ne) laser is used as the probe light. The probe light collimates up to a beam of 4 mm in diameter using a telescope arrangement (lenses L2 and L3). A beam splitter (B) directs the probe beam collinearly on to the excitation beam. Behind the sample, the probe light passes through a small aperture (A) and then to a diode detector (D). The detector signal is amplified using a current preamplifier before sending it into a digital oscilloscope for processing. The samples were water solutions of latex microspheres (Polyscience, Inc.) contained in glass cells of 0.5 cm pathlength at concentrations that simulate a high-turbidity environment. Adding drops of the 2% water solution of 2 μm diameter latex microspheres increased turbidity. Turbidity values up to 15 cm−1 were obtained. The sample was located at the focal point of the excitation beam. At this position, the experimental setup provides the maximal possible PTL signal. For each sample, we measured the turbidity coefficient α S by determining excitation light transmittance of the sample according to
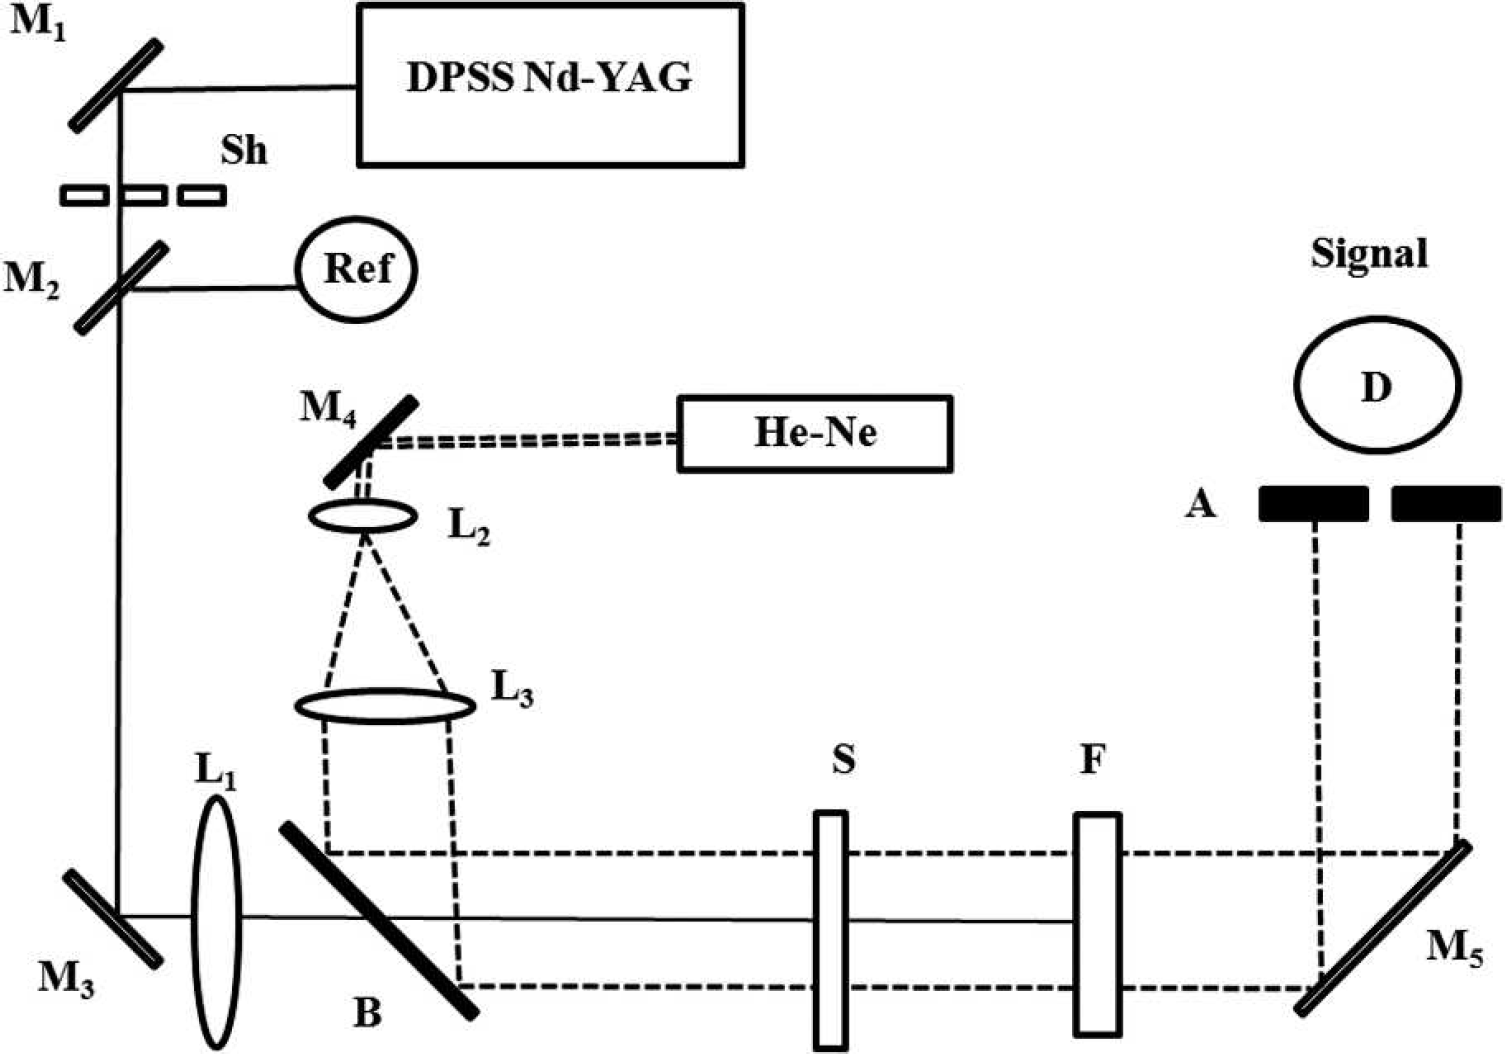
Schematic of the experimental setup showing the excitation laser (DPSS Nd:YAG); probe laser (He-Ne); mirrors M1, M2, M3, M4, and M5; shutter Sh; lenses L1, L2, and L3, reference detector Ref; signal detector D; sample S; interference filter F; and aperture A.

where L is the sample pathlength, WTS is the intensity of the transmitted excitation light with scattering and W is the transmitted excitation intensity in the absence of scattering. To increase the absorption of water, we used 2 nm gold nanoparticles at a concentration of 100 ng/mL. We took into account the value of the resulting absorbance of the sample to obtain the sample's turbidity value.
We performed three experiments. In the first experiment, we recorded the PTL signal as a function of time for different turbidity values. Second, we measured the PTL signal as a function of position (Z-scan) for different turbidity values. Finally, we measured the PTL signal as a function of each sample's turbidity.
RESULTS
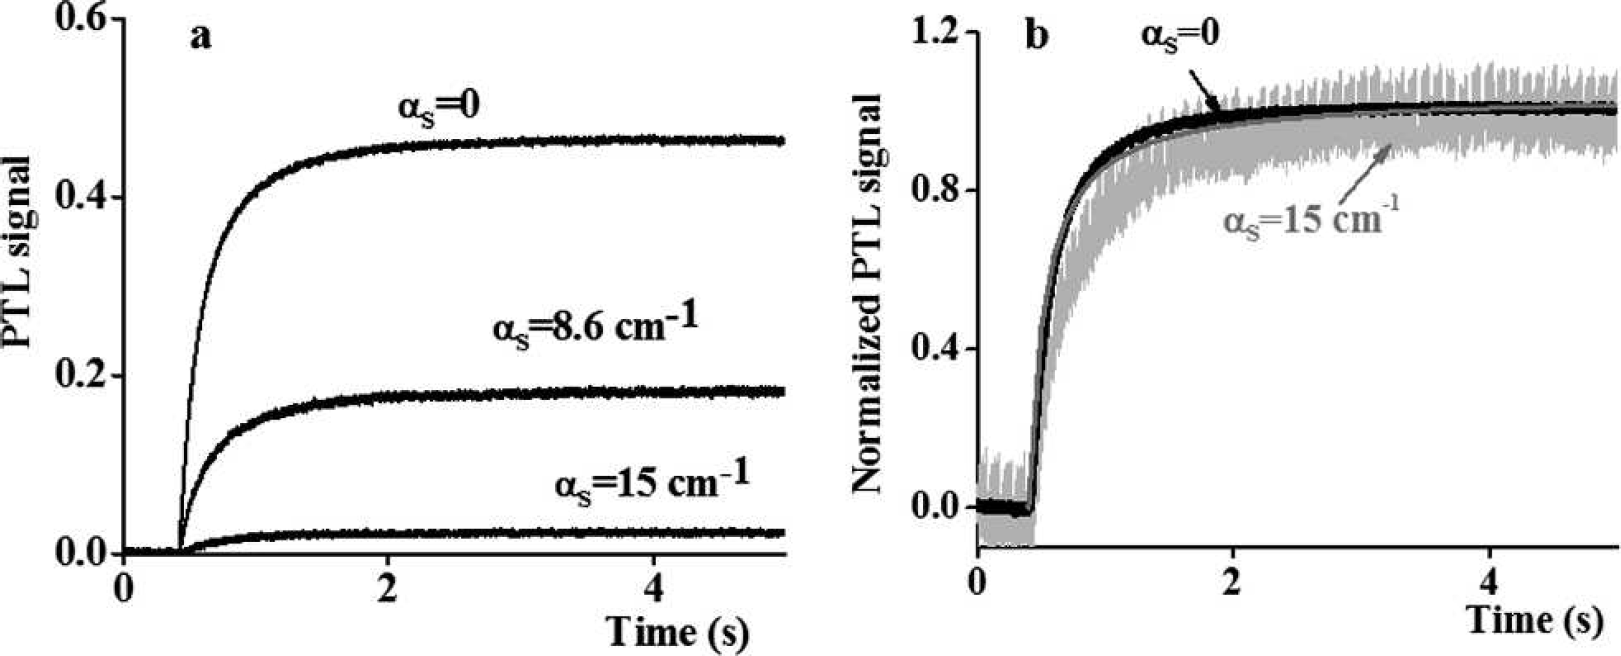
Figure 3a shows the PTL signal from samples of different turbidity values: 0, 8.6, and 15 cm−1. The PTL signal grows until it reaches a stationary value. The stationary condition occurs when thermal diffusion equilibrates the intake of energy due to absorption. The effect is well described within the framework of the thin-lens approximation (Eqs. 1–6). As previously discussed, the increase in turbidity reduces the value of the signal, but to a much lesser extent than the reduction of transmission. Turbidity of 8.6 cm−1 results in a reduction of the transmission by a factor of 78. The PTL signal decreases by only a factor of 2.5 for the same sample. Turbidity of 15 cm−1 results in a reduction of transmission by more than a factor of 2000. Meanwhile the PTL signal decreases by only a factor of 20. Figure 3b shows the normalized PTL signal of the data for a sample with αT = 0 (black line) and αT = 15 cm−1 (light gray line). Changes in the signal-to-noise ratio can be appreciated graphically. Despite the losses due to high turbidity, the PTL signal can still be detected with reasonable signal-to-noise ratio. The signal-to-noise ratio is 12 for the sample with a turbidity of 15 cm−1. The solid dark line is a fitting of the experimental data using the model for the PTL signal described elsewhere. 23 In this calculation, the values of 632 and 532 nm for the probe and excitation light wavelengths were used, respectively; 50 and 0.08 cm for the probe and excitation beam Rayleigh range values, respectively; and Φo = 0.1 and D = 1.41 10−7 m2s−1 for the on-axis phase shift and thermal diffusivity of water, respectively. The signal calculated in the thin-lens approximation reproduces the PTL time dependence well. The slight differences observed in the time behavior of the two experimental curves of Fig. 3b show that the thermal refraction gradient is becoming slightly affected by turbidity. High turbidity is expected to distort the beam profiles of both the excitation and probe beams, reducing the efficiency of the PTL effect.
(
The normalized PTL signal as a function of the sample position (Z-scan), obtained for two different values of turbidity, 0 and 4.2 cm−1, under the same experimental conditions is show in Fig. 4. The solid line is a fitting of the data calculated in the thin-lens approximation. For this fitting, the same parameters were used as in Fig. 3b. The Z-scan signals do not show significant change for αT = 4.2 cm−1, despite the fact that transmission is depleted by almost two orders of magnitude.
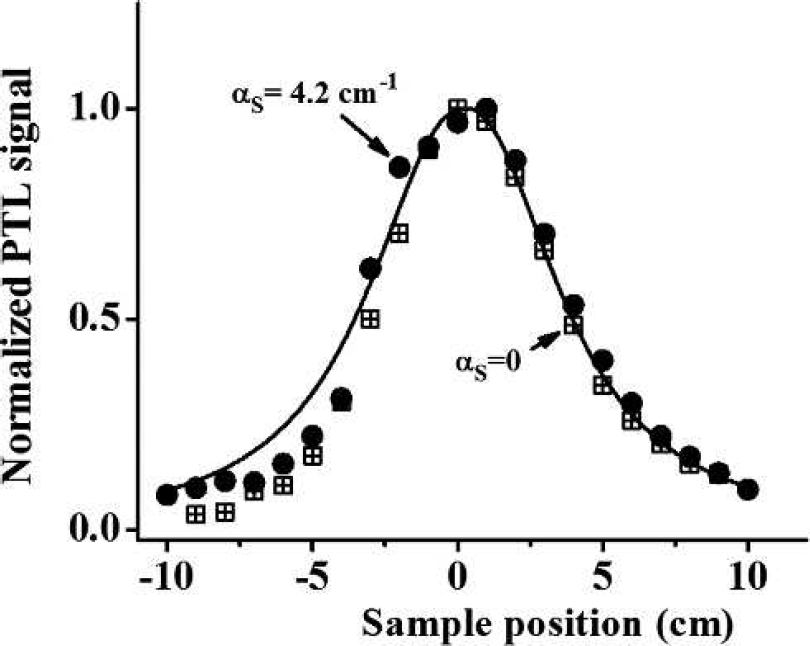
Z-scan profile of water solution containing 2 μm diameter latex microspheres for turbidity values: α S = 0 (crossed squares) and α S = 4.2 cm−1 (solid circles). The conditions of the experiments are the same as in Fig. 3. The solid line is a fitting of the experimental data calculated in the thin-lens approximation with the same parameters as in Fig. 3b.
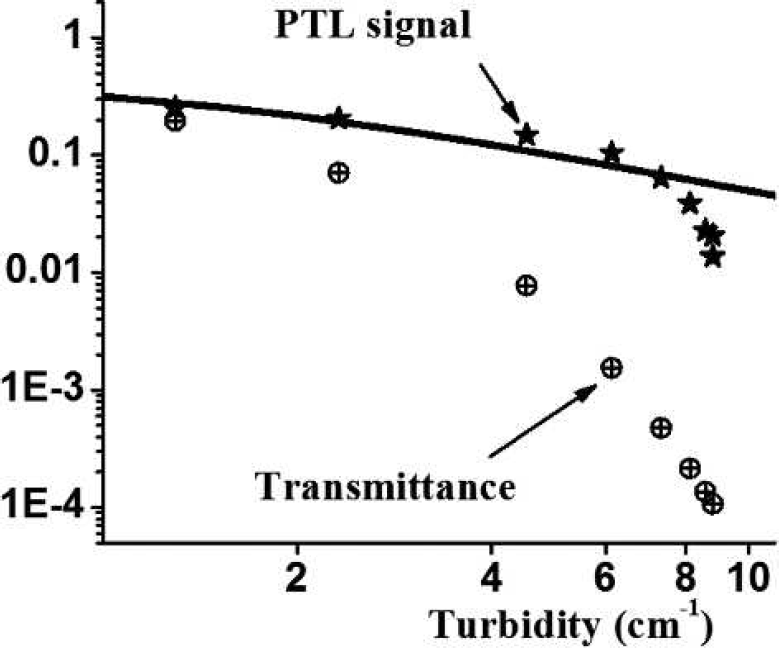
In Fig. 5, the PTL signal as a function of turbidity on a logarithmic scale is shown. The solid line in this figure corresponds to calculations based on the thin-lens approximation (see Eq. 6). For comparison, in the same plot the sample's transmittance of the excitation light is shown. Up to values of turbidity on the order of 6–7 cm−1, the thin-lens approximation works reasonable well. For turbidities below 1 cm−1, no significant change is observed. This result confirms the scattering-free character of the PTL signal reported by several authors who studied the use of the method in samples of limited turbidity.11–18 Despite the signal reduction, the method performs much better than the usual transmittance measurements: The transmittance decreases four orders of magnitude when the turbidity changes from 1 to 9 cm−1. Meanwhile, the PTL signal reduces by only one order of magnitude. This plot demonstrates the advantages of the PTL method over the traditional transmittance technique for possible imaging applications in turbid media. For values of turbidity between 0 and 4 cm−1, the PTL signal decreases by only 50%. This result confirms previous results reported by Larkin et al., who determined the PTL signal for turbidities up to 2 cm−1 in 1 cm pathlength samples. 13 Within the framework of the thin-lens approximation, the signal reduction due to turbidity described by Eq. 6 can be compensated by increasing the power of the excitation field. The limit will be the damage threshold of the sample. For turbidities above 7 cm−1, the PTL signal reduces signaling abruptly over the limits of the thin-lens approximation. We associate this effect to the distortions of the excitation wavefront that take place in a turbid environment. The field amplitude distribution becomes broadened, resulting in a reduction of the local thermal gradient. The simulation discussed in Fig. 1 illustrates this process.
In the case of high turbidity and strong enough temperature gradients, the Soret effect can take place. Gradients of temperature induced by the absorption of light can generate gradients of the distribution of the scattering microspheres. In this situation, the turbidity coefficient αS may become intensity dependent, yielding a deviation from the Beer–Lambert Law. We have established that the relation between turbidity determined by Eq. 7 and concentration of latex microspheres is linear, in accordance with the Beer–Lambert Law. We conclude that the Soret effect is still negligible for the values of excitation power and microsphere concentration used in the experiments.
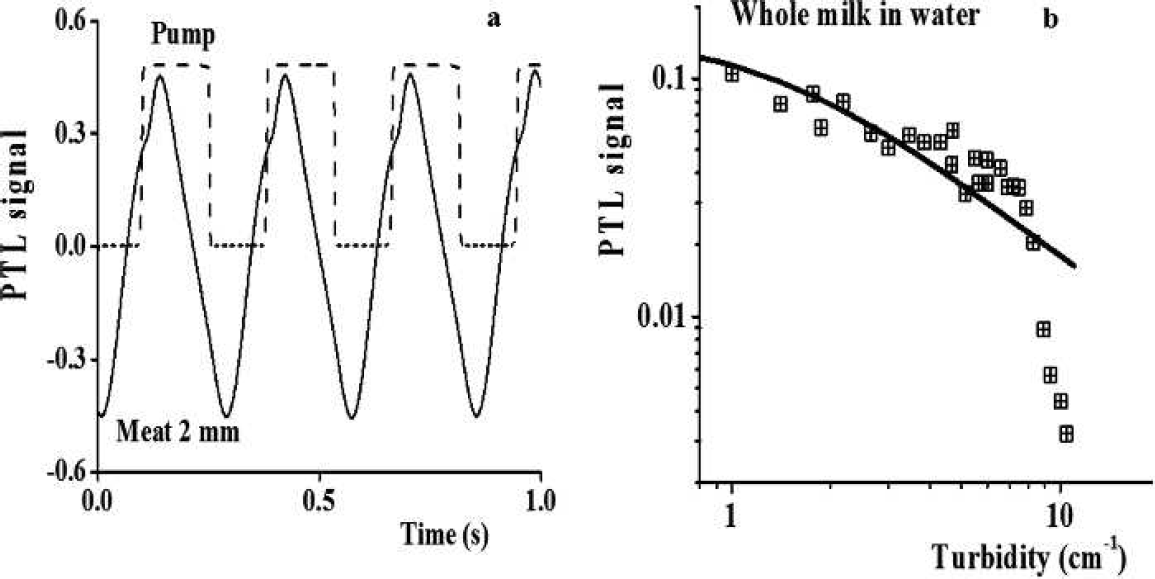
We evaluated the use of the PTL method in real organic samples. In Fig. 6a, we show the PTL signal from a 2 mm-thick piece of chicken meat. The sample is sandwiched between two nonabsorbing glass microscopic slides and exposed to 76 mW of the 532 nm radiation modulated at 3.6 Hz. No damage to the sample was observed for the level of power used. Turbidity of the sample is estimated in 44 cm−1 using Eq. 7. For comparison, we have plotted the excitation field. The signal decreases in the presence of the excitation light, corresponding to negative thermal gradient of the refraction index. The signal recovers in the absence of the field. After averaging 500 times, the signal-to-noise ratio of this experiment is 500. We estimated up to a 4 mm penetration depth using the PTL method with the given level of power.
(
PTL signal as a function of turbidity for a water solution of whole milk is shown in Fig. 6b. The turbidity changed by adding successive 10 μL drops of whole milk to 3 mL of distilled water contained in a 1 cm pathlength glass cell. In this experiment, 200 mW at 532 nm radiation modulated at 3.6 Hz was used. As in the model with the latex microspheres, the PTL signal decreases by about a factor of three for a turbidity value of 6 cm−1. The solid line shown in this figure corresponds to a fitting of the data completed using Eq. 6 (thin-lens approximation). Again, the thin-lens approximation explains the experimental results well up to turbidity values of 7 cm−1. Above this value, the PTL signal decreases more abruptly because of the reduction of local thermal gradients. However, the reduction is several orders of magnitude smaller than the decrease in transmission. For example, for a turbidity of 10 cm−1 the signal decreases by about a factor of 50, while the transmittance of both the excitation and probe beams decreases by more than a factor of 22 000. Despite this, the signal is still six times larger than the noise level. This experiment shows the potentials of the PTL technique for detection and imaging in real organic tissues, which are samples characterized by high levels of turbidity.
CONCLUSION
We performed an evaluation of the PTL technique for spectrometric studies of samples of high turbidity. We demonstrated that the experimental PTL signal follows the predictions of the thin-lens approximation up to turbidities values of 6 cm−1 in a 1 cm-thick medium. For turbidities above this value, the photothermal signal decreased abruptly. We attribute this phenomenon to the effect of depletion of the thermal gradients caused by the absorption of the scattered field. However, a measurable signal can still be detected for samples with turbidity values around 9 cm−1 in a 1 cm-thick sample for which the reduction of the intensity of transmitted light is more than three orders of magnitude. We demonstrated PTL detection in real organic samples with relatively high levels of turbidity. The result confirms the possibility of using the PTL method for imaging biosamples as an alternative to photoacoustic, fluorescence, and photoradiometry techniques.
Footnotes
ACKNOWLEDGMENTS
This research has been possible thanks to the support of the National Science Foundation (NSF-CREST Grant No. 1242067 and NSF-OISE 1156640), of the National Aeronautics and Space Administration (NASA URC 5 Grant No. NNX09AU90A), and of the U.S. Air Force Office of Scientific Research (Grant FA9550-10-1-0127).