
Abstract
Transmission near-infrared (NIR) measurements of a 1 mm thick aspirin disk were made at different positions as it was moved through a stack of eight 0.5 mm thick disks of microcrystalline cellulose (Avicel). The magnitude of the first derivative of absorbance for the aspirin interlayer at 8934 cm−1 was lower when the disk was placed at the top or bottom of the stack of Avicel disks, with the largest signal observed when the aspirin was positioned at the central positions. The variation in signal with depth is consistent with that observed previously for transmission Raman spectrometry. In both cases, the trend observed can be attributed to lower photon density at the air-sample interface, relative to the center of the sample, owing to loss of photons to the air. This results in a reduction in the number of photons absorbed or Raman photons generated and subsequently detected when the interlayer occupies a near-surface position.
Keywords
INTRODUCTION
There is growing interest in the use of near-infrared (NIR) spectrometry for the non-destructive analysis of intact pharmaceutical dosage forms.1,2 NIR measurements of tablets and capsules can be made in reflectance or transmission mode, and a number of studies have been made comparing the relative merits of the two modes of measurement.3–8 In many of the reported studies, the usable spectral region for transmission measurements was generally restricted to higher wave-numbers owing to the high absorptivity of the first overtone and combination band regions. 9 Transmission measurements have been shown to be better for quantitative analysis, yielding more accurate and precise predictions of the component(s) of interest.3,6,8 In addition, calibration models built using transmission mode data were shown to be more robust than those built using reflectance data when there was considerable variability in the chemical composition and physical properties of the tablets. 5 Spectra measured in reflectance mode were also found to be dominated by tablet coatings10,11 and were more sensitive to tablet engraving or embossing.4,5 Transmission measurements have been shown to be less affected by sample inhomogeneity.3,5,8–11 For example, comparable spectra were obtained for bilayer tablets irrespective of which of the two layers was uppermost, 12 and more accurate prediction of the two forms of carbamazepine in bilayer tablets was attainable with transmission measurements. 13 However, when the inhomogeneity was in the direction perpendicular to the axis of irradiation, then both measurement modes were found to be affected. 14
The reason for the observations above can be attributed to differences in the sampling volume of the two measurement modes. Reflectance measurements predominantly sample the upper surface of a tablet, with a recent study estimating that 0.2–0.25 mm of the surface of the tablet contributes to approximately 90% of the NIR reflectance signal. 10 However, the depth of penetration is both wavelength and material dependent. 15 In comparison, transmission NIR measurements have a larger sampling volume;3,10,11 it has been estimated that .90% of the transmission NIR signal comes from the central 7 mm section of a typical 10 mm diameter pharmaceutical tablet, 16 and in transmission mode light propagates through the entire thickness of the tablet. Theoretical models have been devised to describe the propagation of light through diffusely scattering multilayered materials.17–19 Kubelka measured the transmittance of visible light by a sheet of blue paper when placed at different positions within several sheets of white paper. 17 However, the relative contribution of layers at different depths in a tablet to the overall transmission NIR signal does not appear to have been examined. In comparison, owing to the recent interest in the use of transmission Raman spectrometry for the analysis of pharmaceutical dosage forms,20,21 there have been a number of theoretical and experimental studies examining the variation of the transmission Raman signal with depth in turbid media.22–26 It was suggested in a recent paper that the variation in the transmission Raman signal with depth would also be exhibited by transmission NIR spectrometry. 22 While transmission Raman spectrometry can be employed with non-absorbing and weak to moderately absorbing materials, 22 it is inherent to NIR spectrometry that at least weakly absorbing materials are present to give rise to a signal. Therefore, in this work, the variation in the transmission NIR signal with depth in compressed layers of pharmaceutical materials has been investigated experimentally for the first time.
EXPERIMENTAL
(
RESULTS
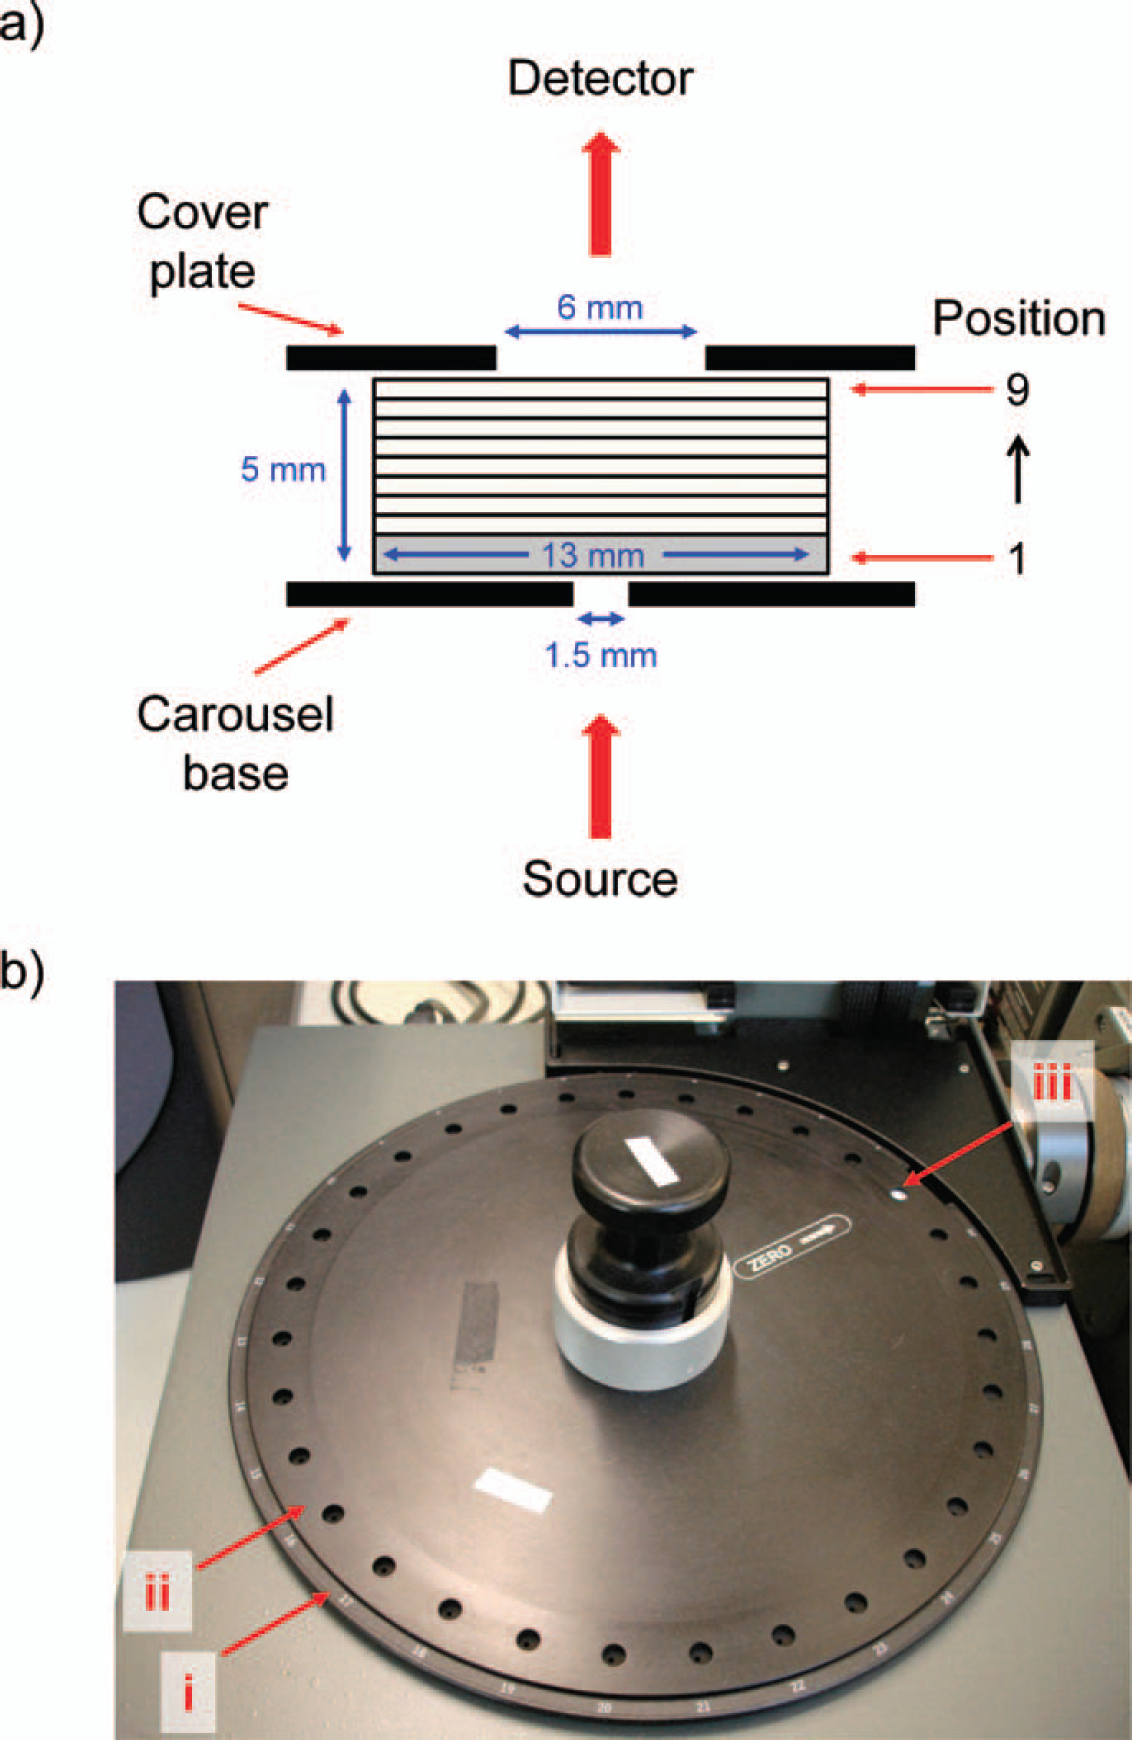
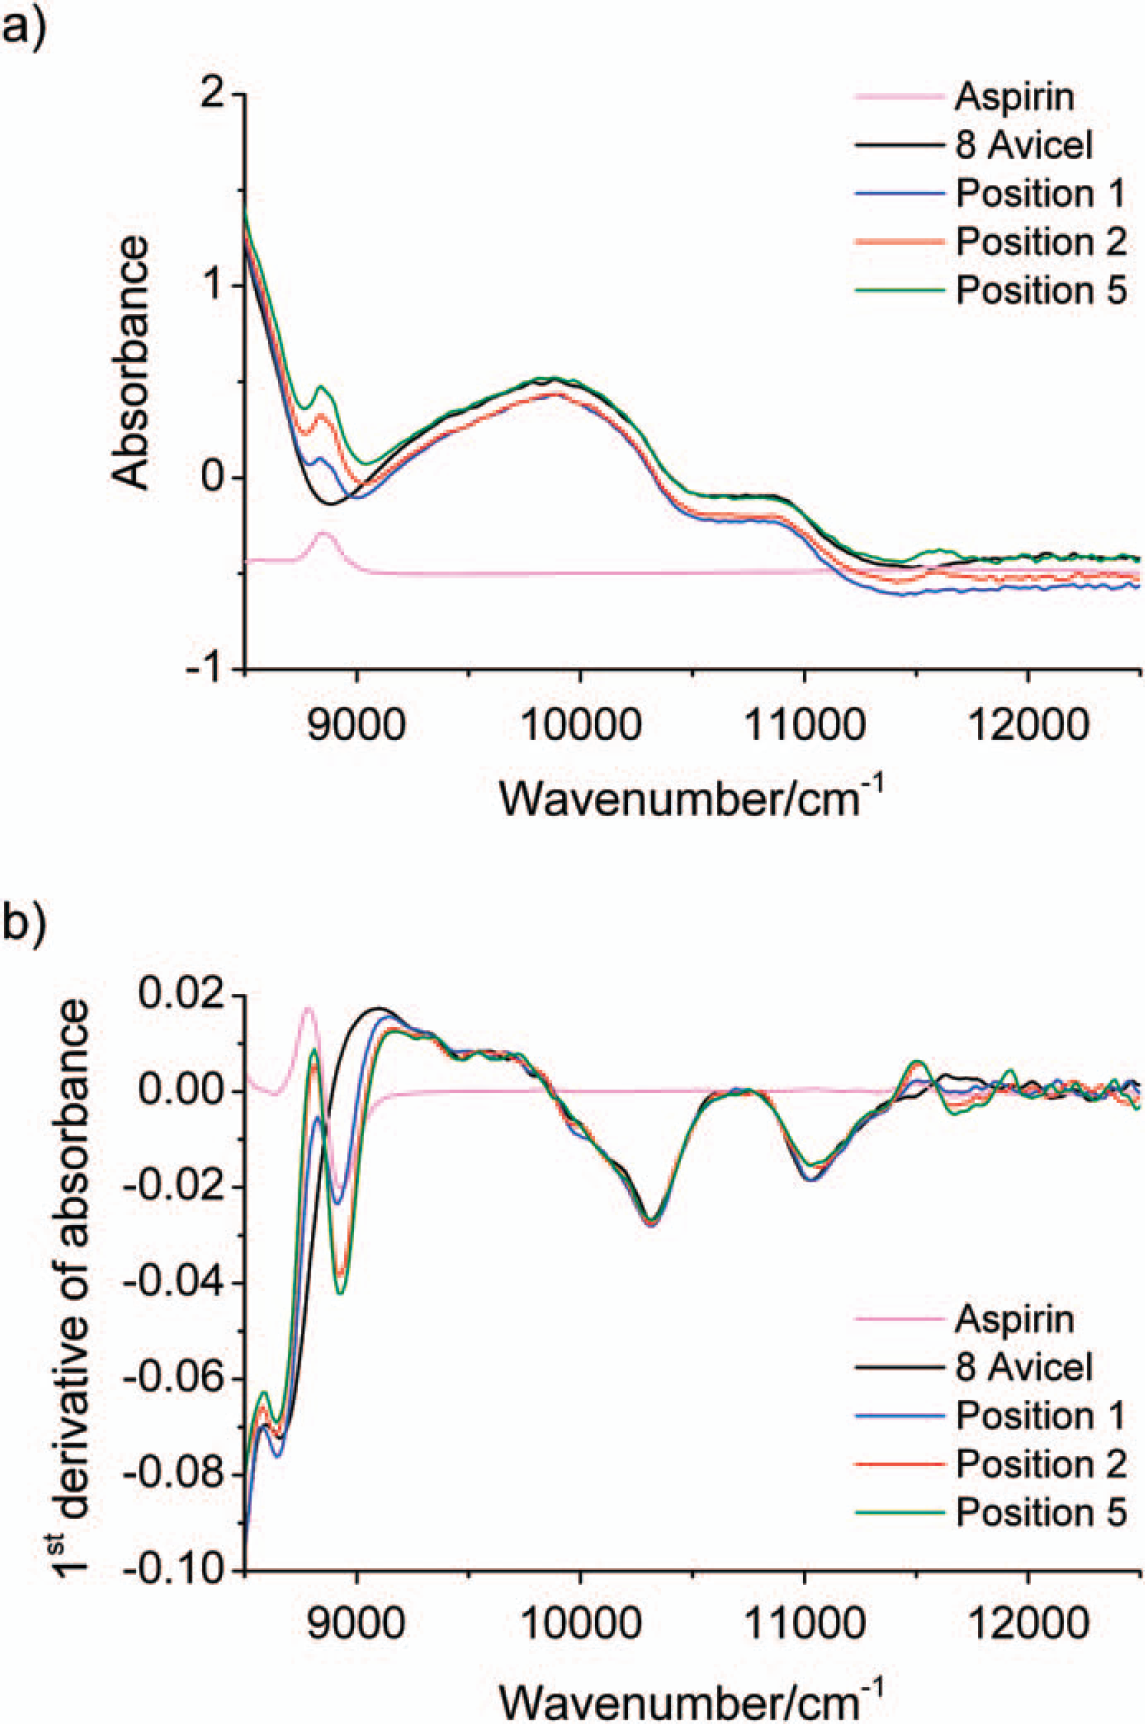
Absorbance spectra of eight Avicel disks, one aspirin disk, and an aspirin disk at positions 1, 2, and 5 within a stack of eight Avicel disks are given in Fig. 2a. Owing to the thickness of the stack of disks, it was possible to use the spectral region only above 8500 cm−1. Variability in the stacking of the disks gave rise to variations in the baseline offset, and hence, first-derivative spectra were calculated for further analysis. There is a strong aspirin signal in the first-derivative spectra at 8934 cm−1 (see Fig. 2b), which overlaps to some extent with a signal from Avicel. However, the first-derivative spectra contain a peak at 10 322 cm−1, which arises only from Avicel; the intensity of this peak did not change when the aspirin disk was added to or moved through the stack of eight Avicel disks. Consequently, the spectrum of eight Avicel disks was subtracted from all spectra, and the magnitude of the peak at 8934 cm−1 in the residual (aspirin) spectrum was then used to investigate the effect of aspirin position within the Avicel disks on the transmission NIR spectrum.
(
When the aspirin disk was placed at different positions within the stack of Avicel disks, the results shown in Fig. 3 were obtained. Each data point is the mean of three repeat measurements (average relative standard deviation of 0.76%), and the experiment was reproduced three times to assess the procedural variability. For seven of the nine positions, there was no statistical difference at the 95% confidence level between the measurement repeatability and the procedural reproducibility. It can be seen that when the aspirin disk is at the bottom or the top (positions 1 or 9) the signal intensities are comparable, but they are lower than when the aspirin is located within the stack of Avicel disks (positions 2 to 8). The signal is largest for the central positions (4 to 6) with a gradual decrease observed as the aspirin layer moves closer to the surface positions. Kubelka found that the transmittance of visible light by a blue sheet of paper was lower (i.e., absorbance was higher) when it was placed in the center of several sheets of white paper compared to when it occupied a surface position. 17 The variation in aspirin signal with depth is symmetrical about the center position as predicted by Kubelka's model for transmittance of light through multilayered materials. 17
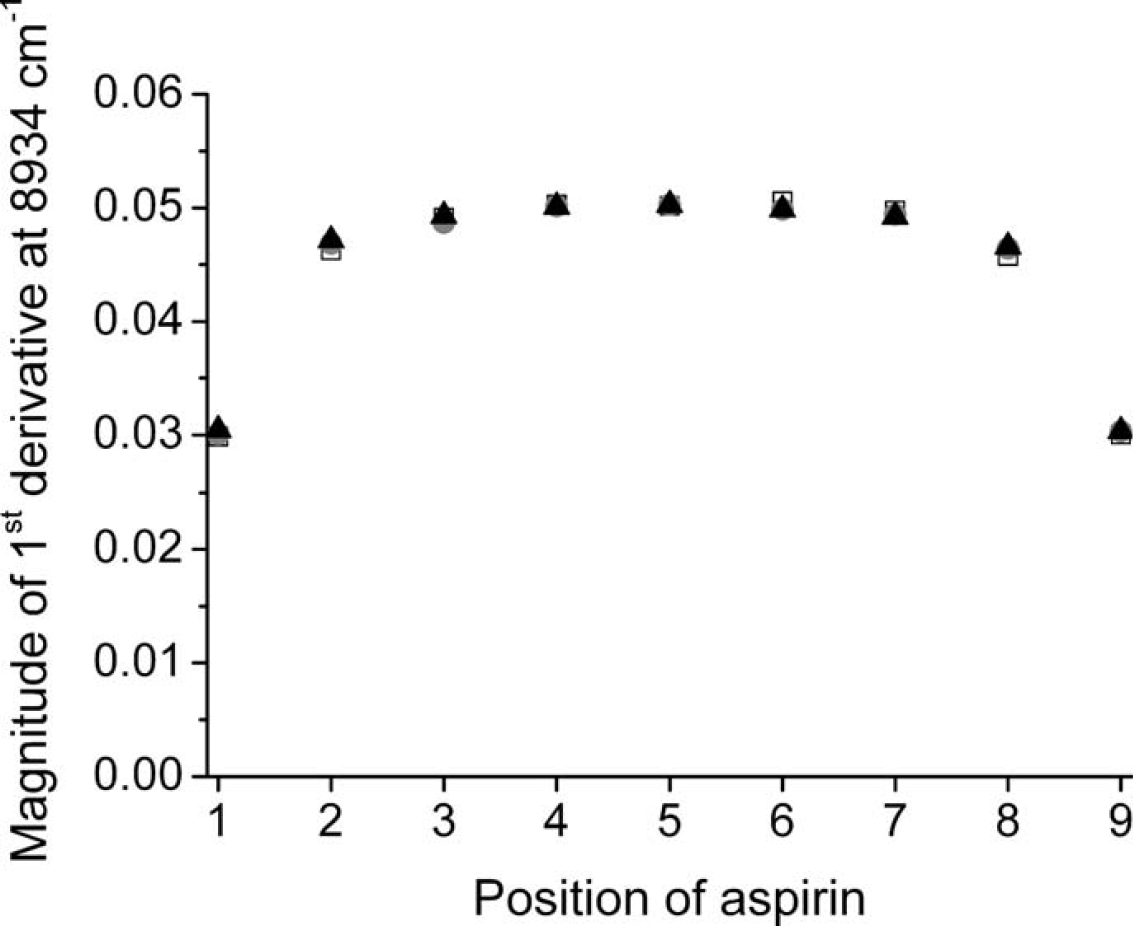
Variation in the magnitude of the first-derivative NIR signal for aspirin at 8934 cm−1 as the aspirin disk is progressively moved through the stack of Avicel disks from position 1 (bottom of stack) to position 9 (top of stack). The experiment was reproduced three times.
These observations are also consistent with those noted for the Raman signal from an interlayer containing TiO2 as it was moved through a stack of the eight Avicel disks. 22 In previous Raman studies,22–26 the lower Raman signal observed when the interlayer occupied a surface position was attributed to loss of photons to the air at the air-sample interface. This results in a reduction in the number of Raman photons generated and subsequently detected when the interlayer occupies a near-surface position. A similar explanation can be used to describe the variation in the aspirin NIR signal in the present study; as the Avicel signal was invariant with the position of the aspirin disk, only absorption by aspirin is considered. When the aspirin disk is at a surface position, fewer photons are absorbed by the aspirin owing to the lower photon density at the air interface; this gives rise to a smaller aspirin peak in the NIR absorbance spectrum. Conversely, when the aspirin disk is sited in the center of the stack of Avicel disks, there is a higher photon density in the proximity of the interlayer owing to extensive scattering of light by the surrounding layers. This increases the residence time of the photons in the center of the stack, and hence, a greater number of photons will be absorbed by the aspirin layer, giving rise to a larger aspirin peak in the spectrum. These findings are also consistent with a recent study of the penetration of light into multiple scattering media. 27 Monte Carlo simulations were used to calculate the probability density (equal to the residence time of a photon at a given depth, relative to the residence time of a normally incident photon in a scatter-free layer) as a function of depth, with the maximum probability density observed at the center of the layer.
The ratio of the aspirin NIR signal from position 5 compared to the outer positions was greater by a factor of 1.7. In the previous study, the ratio of the TiO2 Raman signal from the center compared to the outer positions was greater by a factor of 1.8. 22 This suggests that the portion of photons lost at the air-interlayer disk interface is comparable. The equivalence of the depth profiles stems from the fact that the photon propagation trajectories are equivalent in the two sets of experiments; the same Avicel disks were used for both sets of measurements, and the wavelengths of the two techniques are comparable (approximately 800–1200 nm for NIR and 830–1050 nm for Raman). The absorption and scattering of photons in powdered solids can be described using Kubelka-Munk theory. 28 Schrader and Bergmann extended Kubelka-Munk theory to Raman spectrometry by incorporation of the generation of Raman photons into the model. 29 Hence, the same underlying theory can be used to describe NIR and Raman signals in turbid media. The primary difference between the two types of measurements is the process leading to generation of the signal, i.e., photon absorption for NIR and photon conversion for Raman.
CONCLUSIONS
The present study has confirmed that the variation in transmission NIR signal with depth is consistent with that observed previously for the transmission Raman signal.22–26 The lower NIR absorbance and Raman intensity observed for the interlayer when positioned at the surface can in both cases be attributed to lower photon density at the air–sample interface, relative to the center of the sample, owing to loss of photons to the air. This results in a reduction in the number of photons absorbed or Raman photons generated and subsequently detected when the interlayer occupies a near-surface position. The NIR absorbance or Raman intensity at any given depth will be dependent on the properties (e.g., particle size and packing density) of both the interlayer and surrounding material. The observed signal will also be dependent on the diameter of the sampling area, which should be approximately six times the sample thickness for quantitative transmission measurements.30,31 In cases where this condition is not met, as in the present study, radial diffusion will mean that some photons emerge outside the detection area. However, qualitatively, the variation in interlayer signal with depth will still be the same. Although lower NIR signals are obtained for the interlayer when it is positioned at the surface, the variation in the transmission NIR signal with depth is far less marked than that observed in reflectance NIR measurements. 32 Nevertheless, the depth dependence of transmission NIR measurements may need to be taken into account for quantitative analysis of highly heterogeneous or multilayer tablets.
Footnotes
ACKNOWLEDGMENTS
The Royal Society is thanked for the award of a University Research Fellowship to AN. We wish to thank Dr. Neil Everall for supplying the Avicel disks.