
Abstract
The mold temperature dependence of bisphenol A polycarbonate (BPAPC) in the view of changing the “flexed state” was investigated by mid-infrared spectroscopy combined with a previously developed thin sample preparation system. The differences in the samples of different mold temperatures were clearly detected. The structural changes in the flexed state of each mold temperature were analyzed by comparing the results using dielectric function analysis of different cutting procedures. Some structure parameters were associated with the contact angle of liquids on polymer plate. The evidence suggests that mold temperature and surface wettability affects the cohesive or entanglement state of polymers at the chemical structure level.
Keywords
INTRODUCTION
The changes in the molecular conformations of bisphenol A polycarbonate (BPAPC) after supplying a shear force field were monitored by a very thin surface preparation system.1,2 Robertson 3 proposed a theory to describe how shear stress can induce structural changes in a glassy polymer, decreasing the rigidity of the glass and allowing the polymer flow. He also demonstrated that a shear force field could induce a structural state characteristic of the polymer at temperatures above the glass transition temperature. The resultant structures were termed as being in a “flexed state”. Argon developed a theory that introduced low-temperature plastic deformation through localized molecular kinks caused by intermolecular interactions and used this theory to calculate the shear activation volume, which was on the order of a few cubic nanometers. 4 The sizes of shear activation volume were larger than those of functional groups but smaller than the length of a polymer molecule. The flexed state was obtained effectively by cutting the very thin surface layers using a blade. The cutting instrument was called a “Nano Catcher” (NC) in our previous paper, 1 and the technique can detect a very thin surface region of ∼100 nm in depth. The trans-trans and cis-trans conformations of BPAPC are shown in Fig. 1a, and Figs. 1b and 1c show our analytical concept using simple potential models. As shown in Fig. 1b, the stable, lower energy state of BPAPC is mainly the amorphous trans-trans conformation distributed around the minimum of the potential well. Some of the BPAPC molecules are distributed at secondary minimums of semicrystalline trans-trans or cis-trans conformations, which have higher potential energies than the amorphous trans-trans conformation. These conformations are discussed by Dybal et al. 5 As shown in the figure, some amorphous trans-trans structures are located on the slope of the potential wall rather than the bottom. These situations originate from differences in the degree of segmental interaction of the surrounding chains or the degree of entanglement.4,6 If we apply shear force to the sample slab by cutting, some amorphous trans-trans structures transform into higher energy semicrystalline trans-trans or cis-trans conformations that reflect the initial configuration (Fig. 1c). The structures located at the potential minimum and at the slopes of the potential well in the amorphous trans-trans conformation could not be distinguished using typical Fourier transform infrared spectroscopy (FT-IR) techniques because FT-IR only probes local structures. We proposed that the flexed state reflects the entanglements and/or interactions of the surrounding molecular segments (namely, higher order structures) and that the flexed state also is concerned with the macroscopic properties of polymers. 2 For example, we proposed the structural models under fatigue using “flexed state analysis”. The changes in these structures could not be detected by conventional mid-infrared spectroscopy (mid-IR), including the attenuated total reflection (ATR) technique. 7
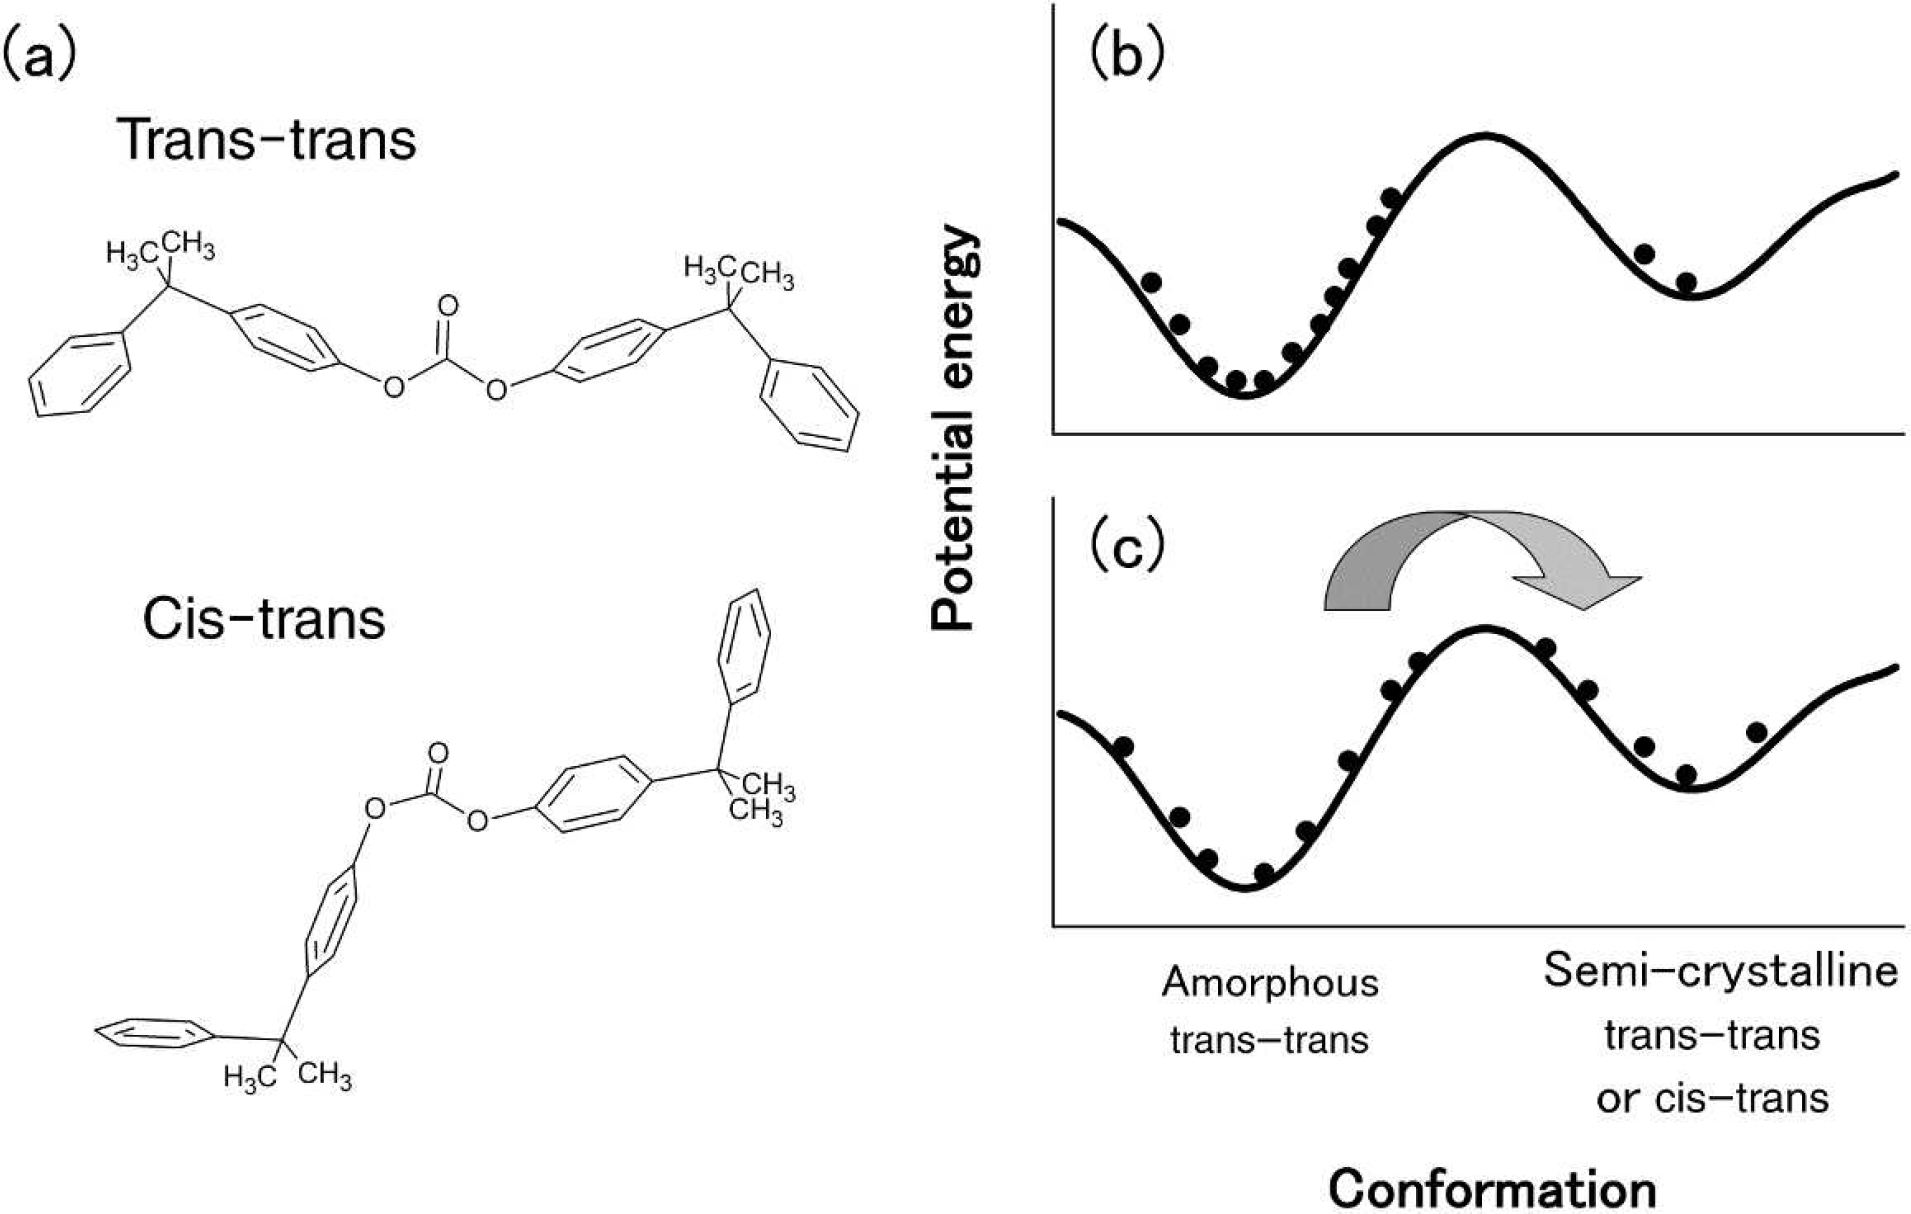
Illustration of the trans-trans conformation and cis-trans conformation of BPAPC (
We focused on wettability, a macroscopic property, in terms of flexed state analysis. Wettability is an important surface property in the industrial field because it affects the adhesion of hard coated layers on polymer plates. However, the origin of the wettability differences among polymers is not clear because wettability is a complicated phenomenon involving many forces, such as dipole–dipole interactions (Keesom force), dipole-induced dipole interactions (Debye force), and dispersion interactions (London force) in van der Waals interactions. 8 Conversely, our previous study on the fatigue process suggests that the initial entanglement state 2 (including cohesional entanglement9,10) is a major factor in the fatigue lifetime. It is well known that fatigue fracture depends strongly on the molecular weight; 11 however, different fatigue lifetimes are often observed for different mold conditions despite using pellets of the same molecular weight. For example, the lifetime is approximately 280 000 cycles for a sample prepared at a mold temperature of 100 °C in our fatigue cycle test. 2 Alternatively, the lifetime is below 180 000 cycles for a sample prepared at a lower mold temperature. Based on these observations, wettability and fatigue lifetime are thought to be strongly related to molecular cohesion and entanglement, likely due to the adopted structure varying by mold temperature. However, we could not observe the structural differences using conventional IR or Raman spectroscopy and could find no such reports in the literature. These differences are thought to originate from the structures' scaled shear activation volume. Here, we characterize the water and oil contact angles on polymer plates prepared under mold temperatures from pellets of the same molecular weight and propose a structural model to explain the differences.
EXPERIMENTAL AND CALCULUS
The vertical cutting force in the final stage was typically 24 mN, and the final shaving speed in the upward direction was 200 nm/s. The method of cutting is discussed in a later section to induce more movement in the molecular segments (higher shear force field). After the sample was shaved, the diamond blade was carefully removed from the sample surface and placed on the stage of the FT-IR microscope system. Some of the slab thicknesses were evaluated in terms of the roughness distribution of the surface of the shaved polymer plate using an optical measurement system (Wyko NT3300, Veeco). The spectra were obtained in reflection mode. The aperture was set to a position on the diamond blade without the sample to obtain a background measurement. Next, the aperture was moved to a location containing the sample, and the measurement was acquired again in reflection mode. The obtained samples were typically 100 μm × 30 μm. The measurements were performed on the head of the blade with a 50 μm × 15 μm aperture with several parts displaced.
A Spectrum One (PerkinElmer) FT-IR instrument was used for the analysis. FT-IR microscopy measurements were performed with a 4 cm−1 spectral resolution (2 zero-filling) without a polarizer, with 128 co-added scans, and using a HgCdTe semiconductor (MCT) detector. The spectra were obtained in reflection mode and are shown on a logarithmic scale to enable comparison with the absorption spectra.
The dielectric function used for the phenomenological interpretation of the spectra is a combination of the Gervais function 12 and the Kim function 13 :
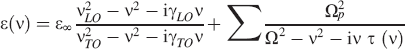
where

νLO is the longitudinal-optic (LO) mode frequency, νTO is the transverse-optic (TO) mode frequency, γLO is the damping factor for the LO mode, γTO is the damping factor for the TO mode, and ε∞ is the dielectric constant at the high-frequency limit. Kim's function can be used as a classical model of the Gaussian and Lorentzian mixed function that is generally used for semiconductors and insulators. Ω is the resonance frequency of the oscillator, Ωp is the oscillator strength, Ωτ is the damping factor, and σ is the Gauss–Lorentz switch. The Gervais model is semiquantum because the frequency dependence of the self-energy of the phonon is neglected in the vicinity of the resonance frequency, but γLO is allowed to be different from γTO. The motivation for choosing the Gervais dielectric function is summarized as follows: (1) if the cutting slabs are very thin, we can evaluate structures based on the polariton-like behavior of the spectra of polar thin materials with only four parameters, and (2) we can account for anharmonic effects, such as that due to the fracture process and/or the flexed state induced by the cutting procedure. A detailed discussion of the choice of the dielectric function model can be found in our previous paper. 2
The assignments of the carbonyl peak positions were as follows: cis-trans conformation, 1785 cm−1; amorphous trans-trans conformation, 1776 cm−1; and the semicrystalline trans-trans conformation, 1765 cm−1. The simulation of the NC reflection spectra was performed by fixing the peak positions and the half-widths of the bands (∼20 cm−1) with the Gaussian function shape [σ is zero in Eq. (1)]. Therefore, the carbonyl bands were characterized by the overlapping Gaussian function of these modes.2,4 However, the peak positions are slightly modified as changeable parameters in the high load cutting mode, as discussed below.
The value of ε∞ was fixed to 2.5, a typical value for BPAPC as evaluated from the refractive index in the visible range. The spectra were well fitted when accounting for the thicknesses of the thin slab and the air gap between the sample and the surface of the diamond blade in the NC measurements. These values were obtained simultaneously with the dielectric function shape because the slab thicknesses are ideally used for a smooth model. 2 In the Gervais model, values of νTO = 1240–1250 cm−1 and νLO = 1260–1280 cm−1 were used as initial parameters. For Kim's function, 1230, 1312, 1295, 1200 (two peaks), and 1165 cm−1 were used as the oscillator peaks. Finally, the dielectric dispersion curves were obtained by spectral fitting with the dielectric function model in the 1900–1700, 1700–1400, and 1400–1120 cm−1 regions simultaneously. The quality of the agreement between the simulated and measured spectra is given by the fit deviation (mean squared difference). The goal of the automated fitting is a sum of the fit deviation of the individual spectra that is below the threshold value of 0.001.
RESULTS
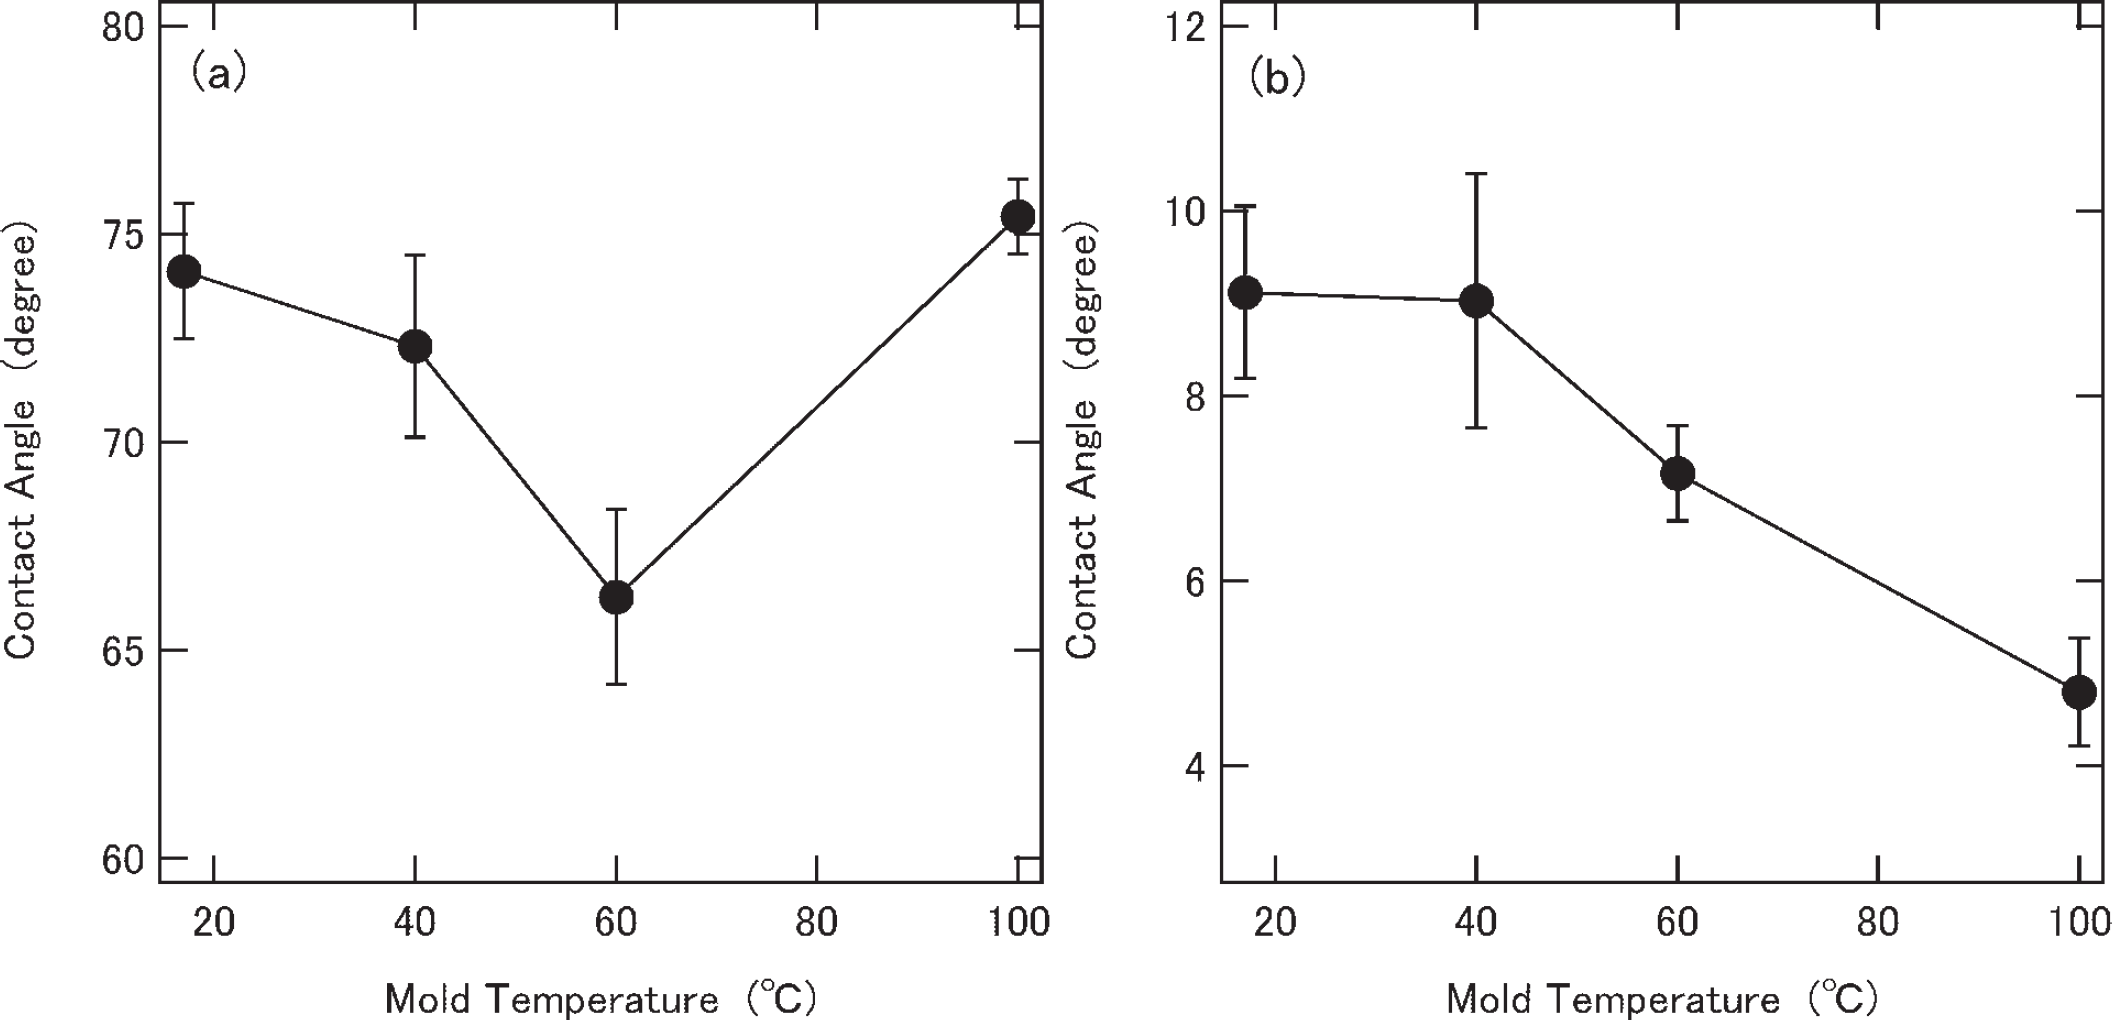
Water contact angle vs. mold temperature profile (
The shear force τs under shaving depends on the rake angle, as shown in the equation below: 14

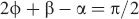
where Fc is the cutting force (horizontal load), Ft is the thrust cutting force (vertical load), φ is the shear angle, α is the rake angle, β is the friction angle, and A0 is cutting area = d (cutting depth) × width of the cut. We have adopted a 40° rake angle as a cutting knife because the cutting proceeds smoothly under this condition. If we were to use a smaller rake angle, Eq. (2) suggests that the shear force will increase, leading to a higher molecular flow. When the shaving is in the steady state, the ratio of the horizontal and vertical load, which varies by sample, is almost constant. Thus, if we monitor one of the loads (e.g., the horizontal load) on the blade, we can control the supplied shear force to some extent.
Figure 3 shows the IR spectra, which reflect the targeted thickness. The solid lines are the experimental results, and the dotted lines are the results calculated using the dielectric function model. Table I shows the representative values of the calculated parameters obtained from the spectra of the same sample plate prepared from a 100 °C mold temperature. The shaved load increases as the targeted thickness increases. A gradual change in the structural parameters and changes in the conformation are observed. However, large increases in the final horizontal load could not be obtained when using a cutting mode in which the thickness parallel to the surface is constant because when cutting deeper makes it difficult to maintain the constant depth parallel to the surface.
Comparison of typical obtained parameters from the NC spectra. The listed data correspond to the case of cutting with different target thicknesses, horizontal cutting modes (Figs. 4a and 4b), and rake angles (20°).
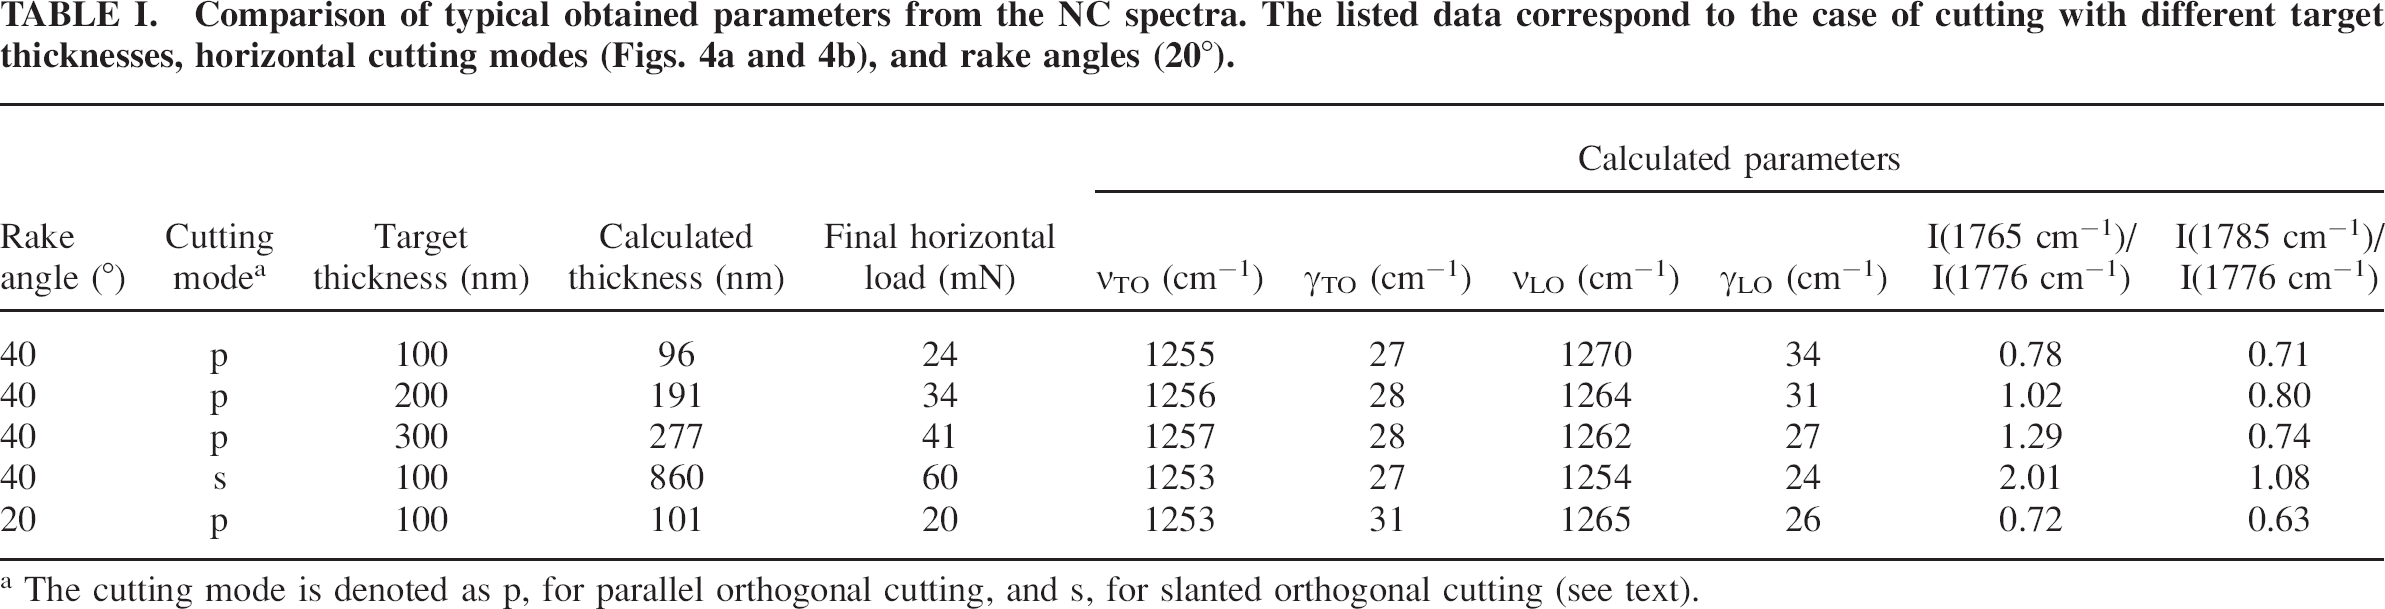
The cutting mode is denoted as p, for parallel orthogonal cutting, and s, for slanted orthogonal cutting (see text).
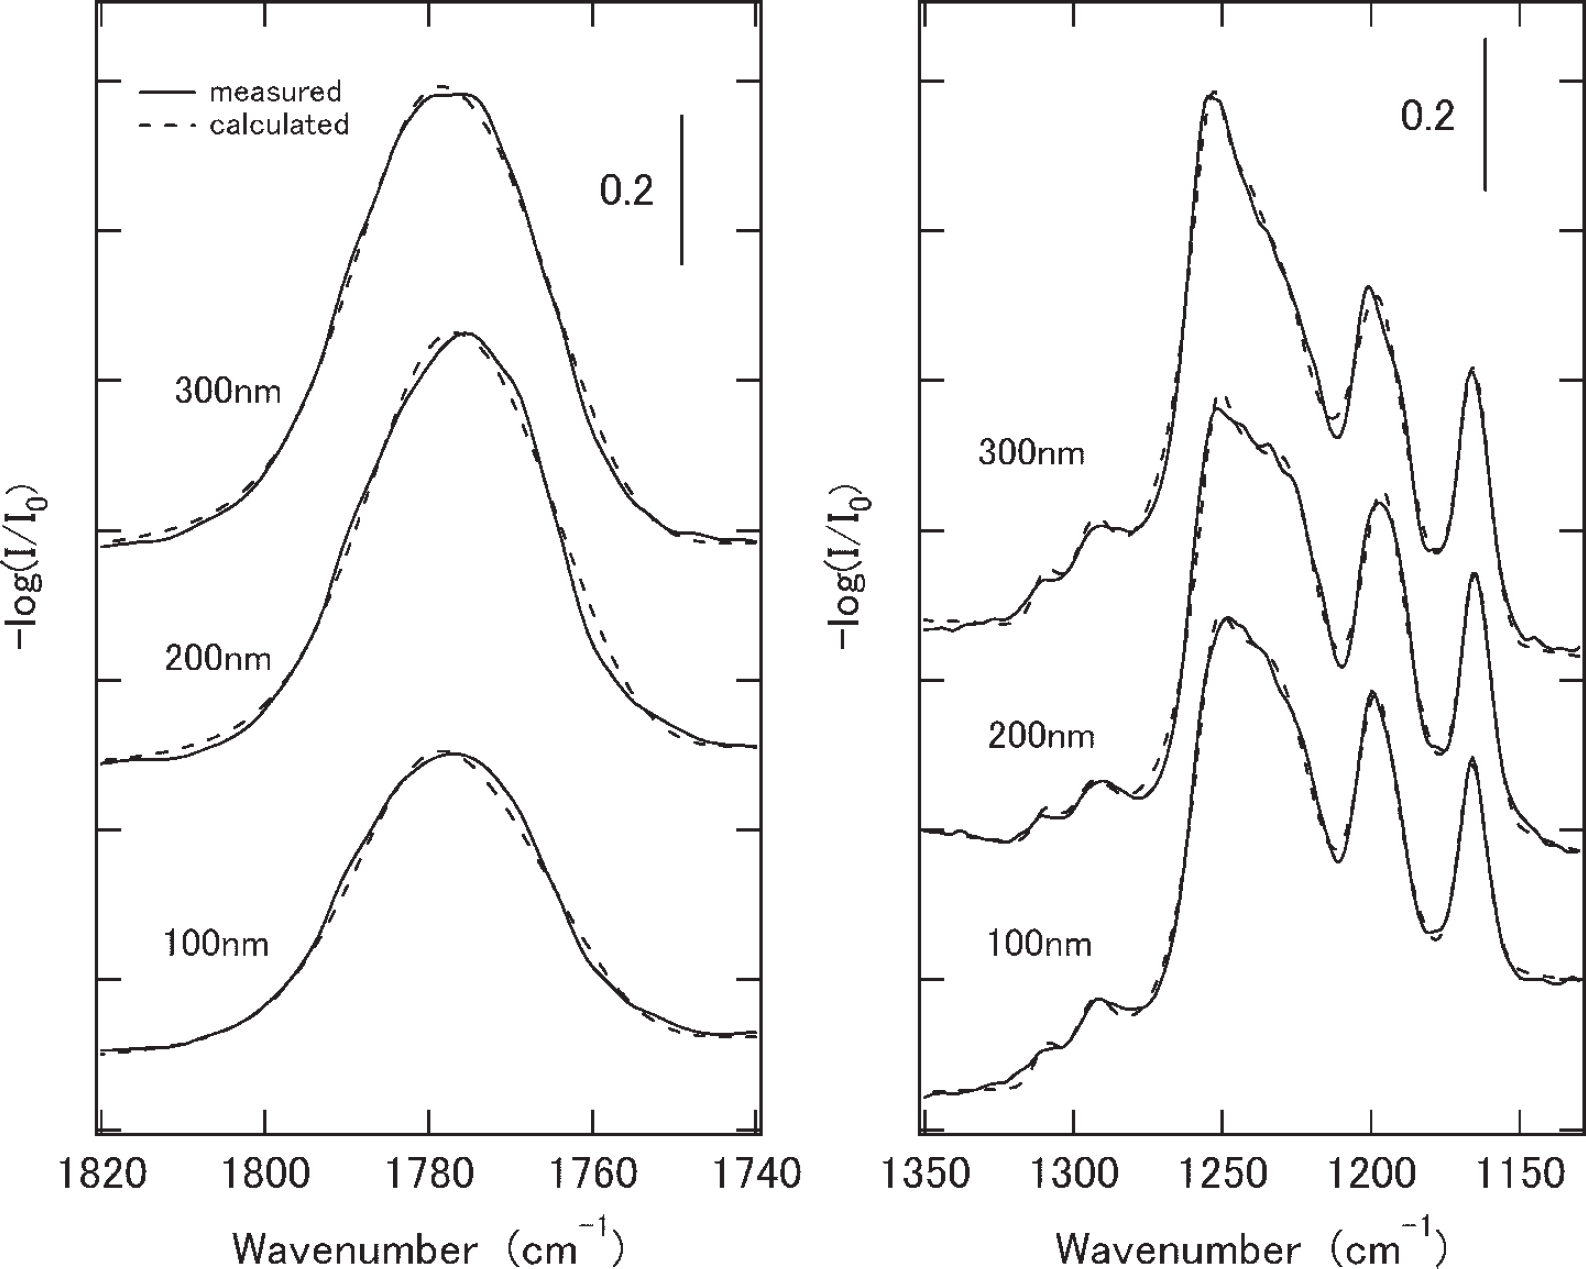
NC spectra of different targeted thicknesses for the 100 °C mold temperature sample. The solid lines are the measured data, and the dotted lines are the calculated spectra.
When we observe the state of the slab under a shaving using a 20° rake angle blade, the slabs seem to have creased and shrunk slightly relative to the 40° rake angle. In addition, the changes in the calculated parameters differ slight from the case of the 40° rake angle. These observations are attributed to slight differences in molecular movements. The variation of the rake angle will induce extremely different cutting modes, as suggested by Kobayashi and Saito.14,15 Regardless, the larger and effective molecular movements could not be obtained in this cutting mode.
To efficiently induce and control the molecular movements, we propose using another method to change the track line of shaving slightly inclined from parallel to the sample surface, as shown in Fig. 4a in the shaving process. This method was studied by Saito et al. 16 , who called it “slanted orthogonal cutting” (Fig. 4a) in contrast to the traditional orthogonal cutting mode (Fig. 4b) that was called “parallel orthogonal cutting.” Thus, the analysis was performed after the horizontal load attained a steady value under shaving and the area was adequate (Fig. 4a). Another proposed method is to shave at the moment of attaining the target horizontal load with a constant rate of increase of approximately 0.3 mN/s for the horizontal load and set a constant depth, as shown in Fig. 4a. The inclined angle was estimated 0.7° in our cutting process. As shown in Table I, the parameters for the carbonyl and ethers from the data for the 60 mN horizontal load change dramatically in this cutting mode. This method can supply shear force effectively and smoothly. Saito et al. 16 showed that the shear stress of the shear plane is independent of the angle of incline in the cutting process. However, they did not discuss the shear on the cutting slabs remaining on the cutting knife after the cutting process. After shaving the slabs in the slanted orthogonal cutting mode, the cutting depth at the final stage is approximately 850–1000 nm for an approximately 60 mN horizontal load and 500–600 nm for an approximately 45 mN horizontal load. This larger depth supplies the excess energy to the slabs in the cut and tearing process rather than in the thin parallel orthogonal cutting process. Thus, this method can supply the shear effectively and smoothly to the sample slabs. The shape of the cut and measured region of the slanted orthogonal cutting mode viewed from the side line (depth direction) is trapezoidlike; however, the spectral calculations were performed using a unique thickness model. When we applied an uneven thickness model, including thickness variation around the mean thickness value (the algorithm is described in the work of Theiss 17 ), we obtain almost the same results for the structure parameters as in the unique thickness model. Thus, we used the unique thickness model for simplicity.
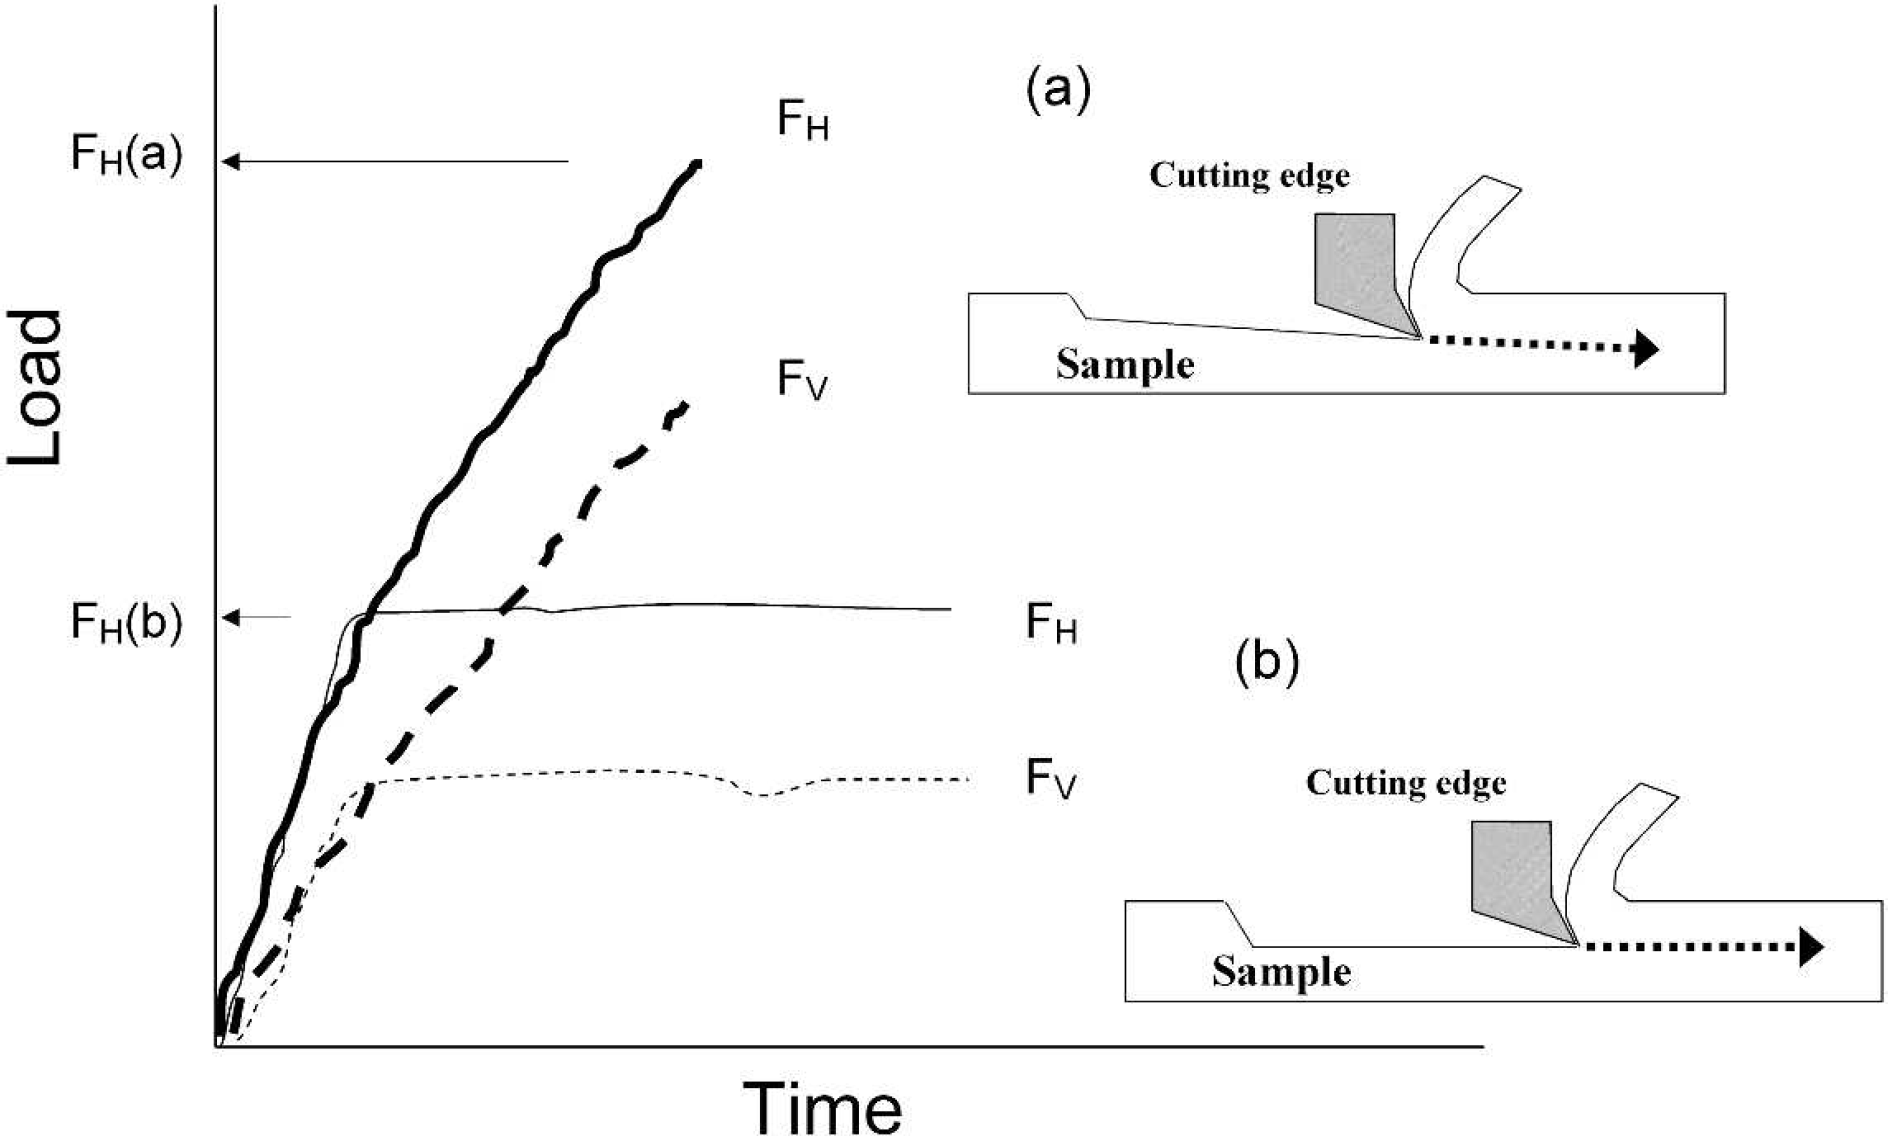
Schematic illustration of different cutting modes. (
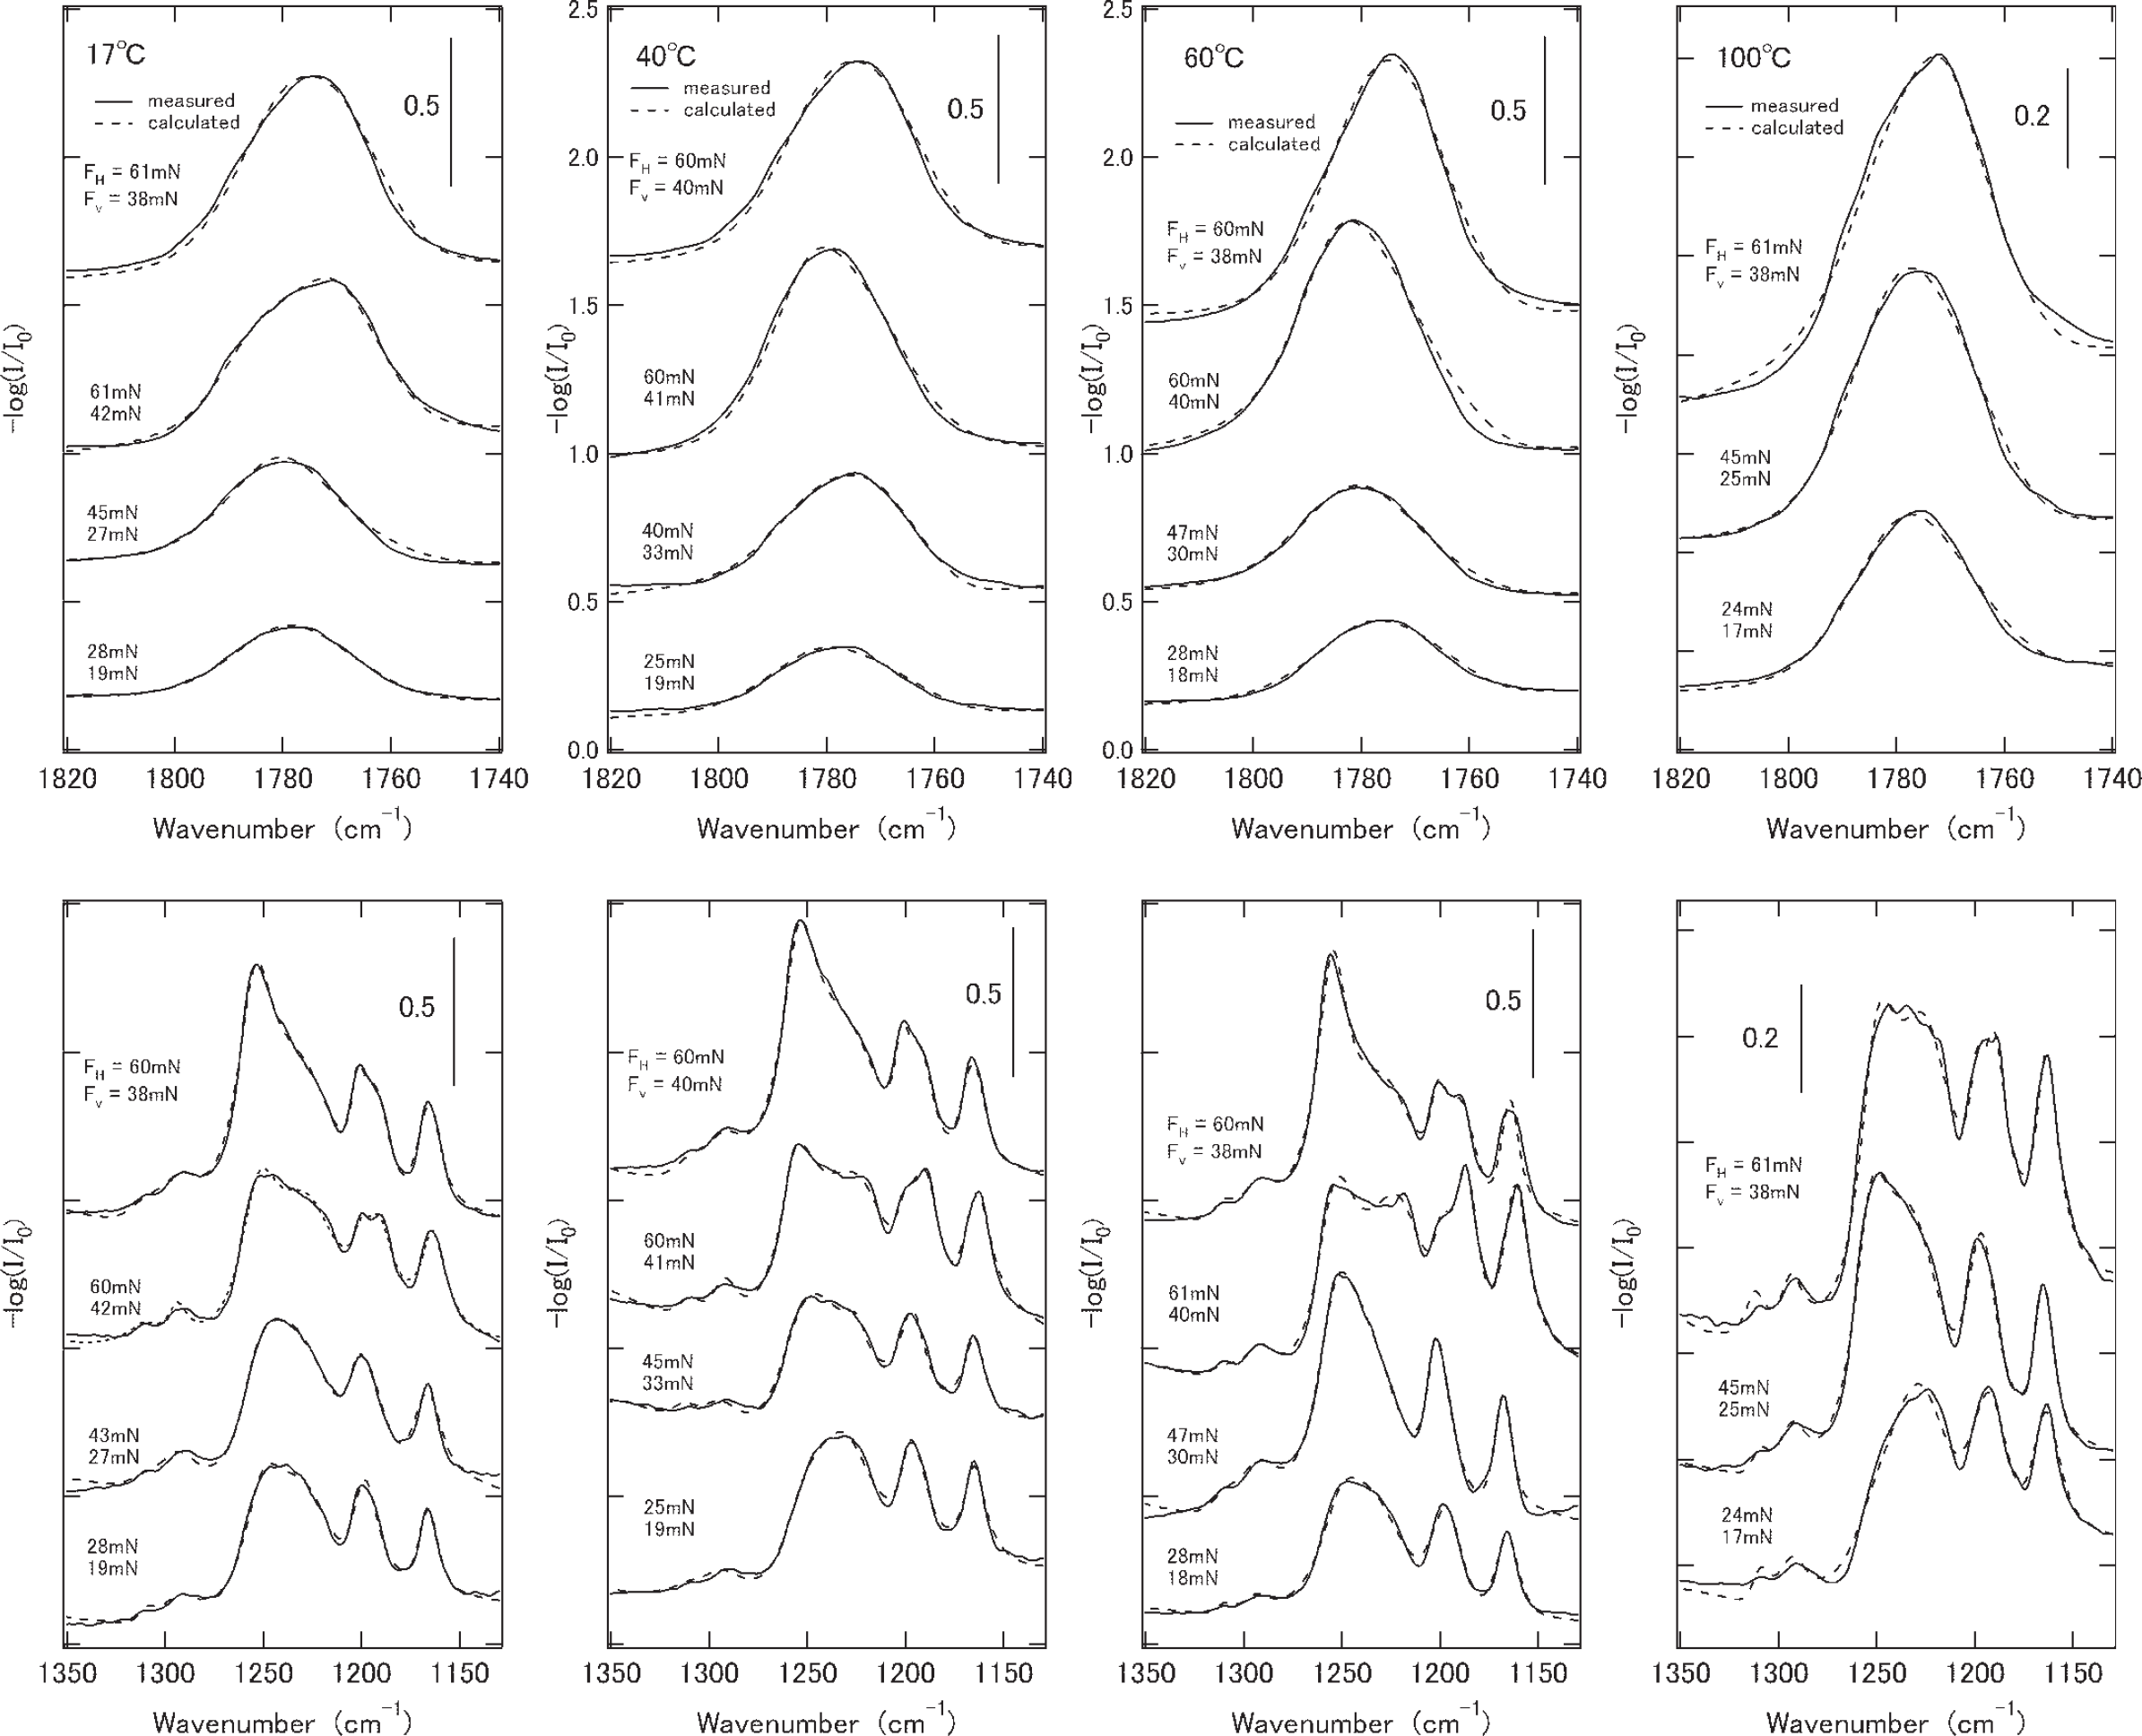
NC spectra for each mold temperature. Carbonyl band range (top) and ether band range (bottom). The final horizontal loads (FH) and vertical loads (FV) of the cutting process are shown. The solid lines are the measured data, and the dotted lines are calculated spectra.
Figure 6 shows the results of the calculated parameters as a function of horizontal load. The results are presented as the mean values of five repeated measurements (including different plates for each mold temperature). The error bars indicate the deviation of each result. The results indicate that the values at 45 and 60 mN horizontal loads are distinctively different from the lower load cutting. Namely, the changes in the configured structures by shear force fields change dramatically in the range of 30–45 mN horizontal load. The absolute value of the parameter νLO − νTO, which indicates the polarity, decreases drastically. This decrease may originate from the decrease in the depolarization effect of the slab surface as the slab thickness increases. This parameter changed by a large amount in the range of 30–45 mN. The conformation parameters also show large changes in the range of 30–45 mN horizontal load; in particular, the increase of the semicrystalline trans-trans conformation ratio is larger than that of the cis-trans conformation ratio. This phenomenon may increase the strain and alignment of the molecules during cutting and tearing, as discussed below. In particular, the change in the damping factors differs strongly from the low load cutting to the high load cutting mode of each mold temperature.
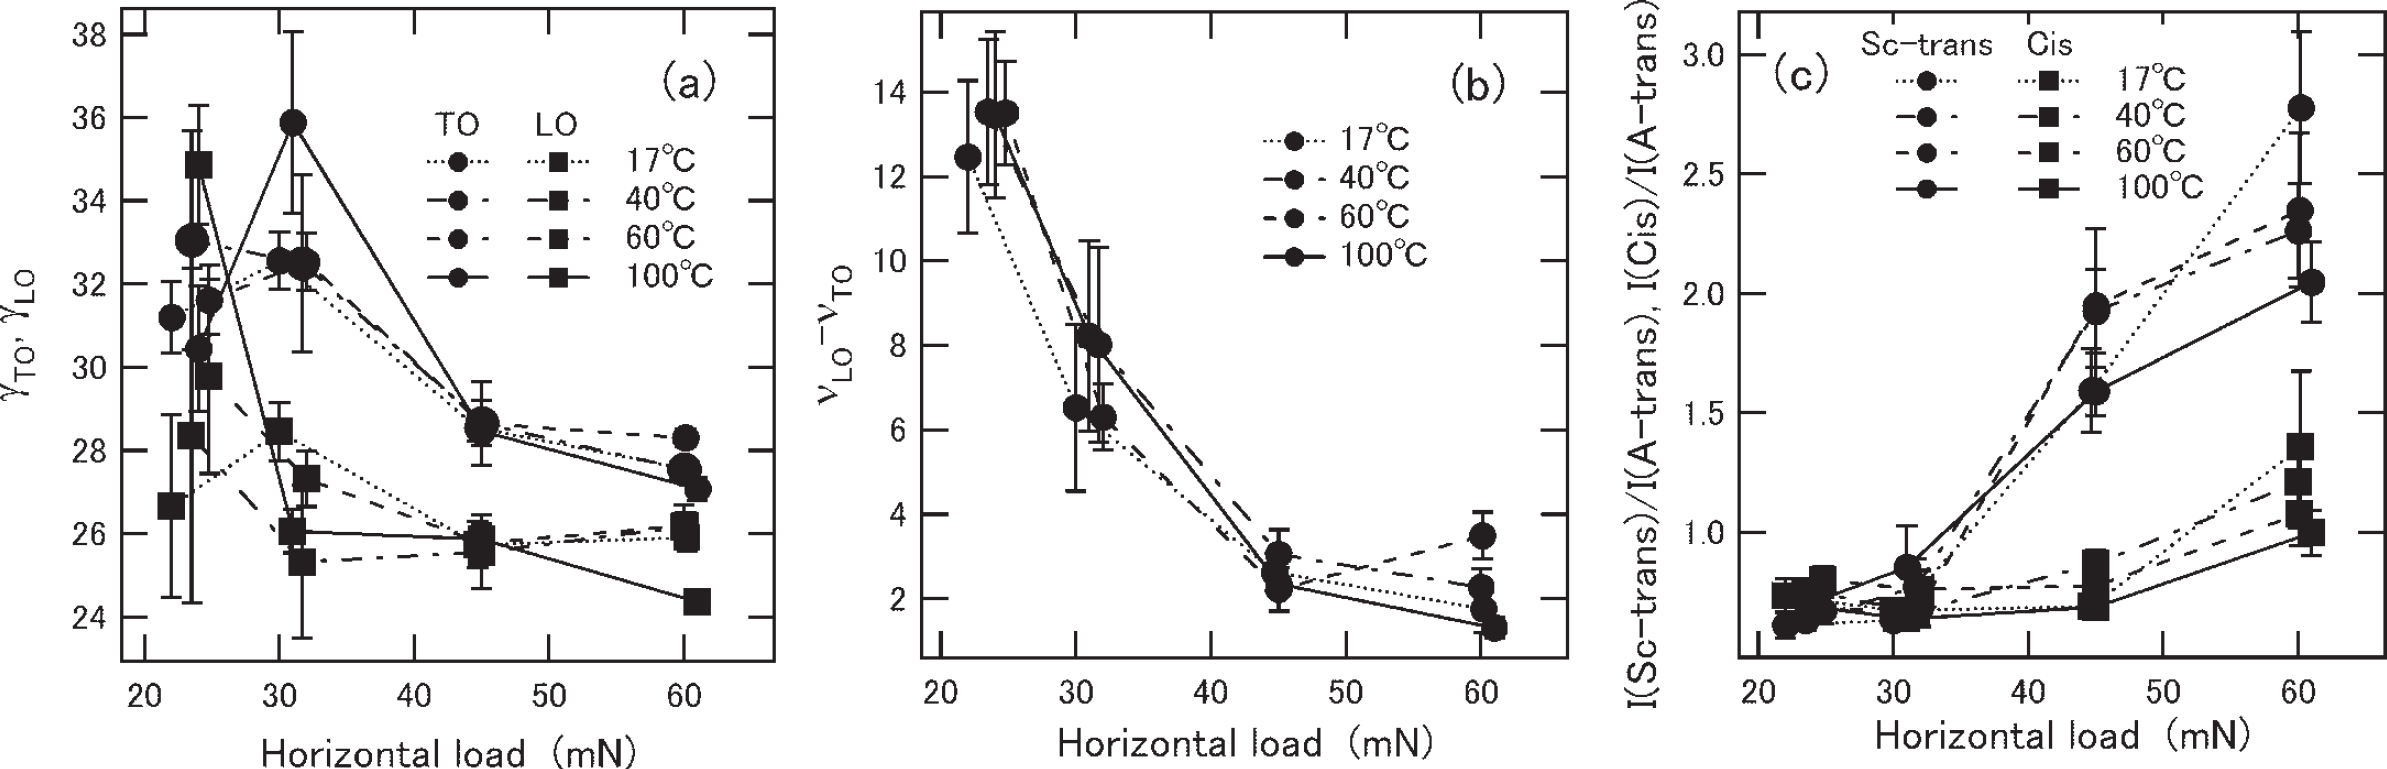
Calculated parameters as a function of final horizontal cutting load. (
Based on the evidence above, we discuss the change in the flexed state depending on the mold temperature using representative values of low- and high-load cutting conditions.
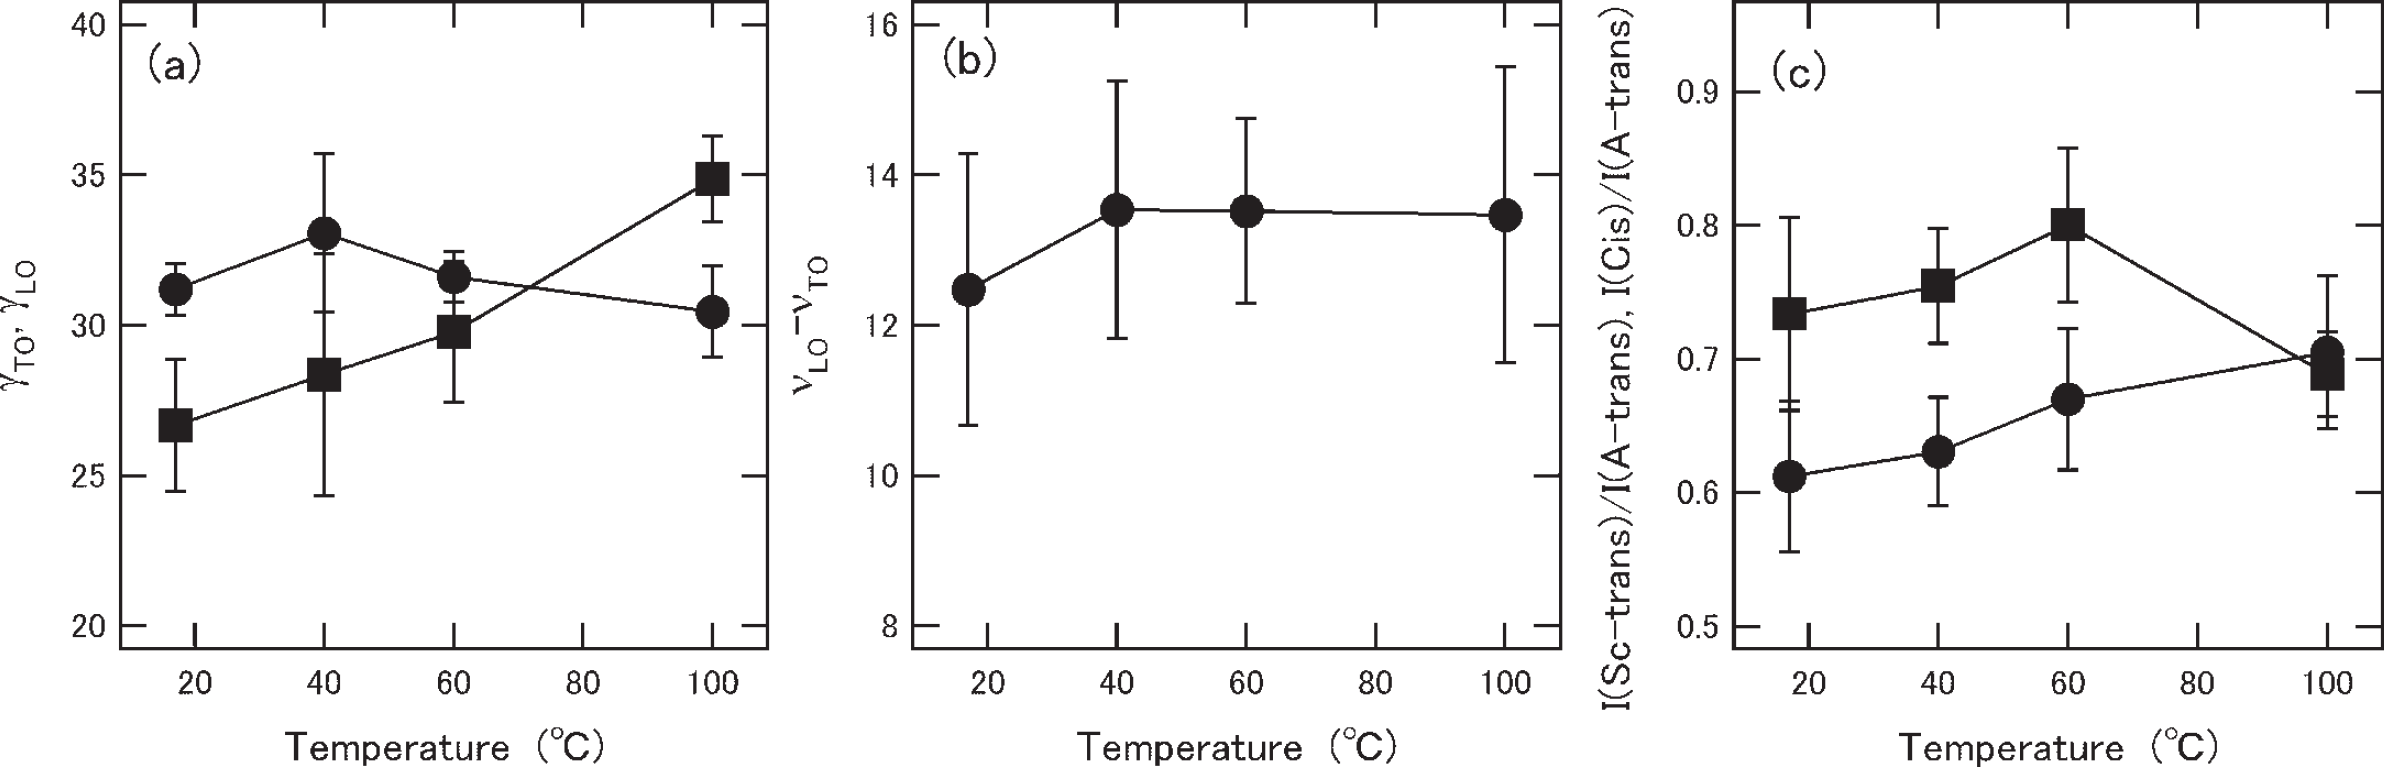
Mold temperature dependence of the calculated parameters under the low-load cutting condition. (
Figure 8 shows the calculated parameters as a function of mold temperature under the high-load cutting condition (slanted orthogonal cutting). Some parameters, such as γTO (γLO) and νLO − νTO, are also thought to be correlated with the curious behavior of the surface wettability for water. The conformation parameters of the high-load cutting condition are generally larger than those of the low-load cutting condition, and the absolute values of νLO − νTO are generally smaller than those of the low-load cutting condition. The former finding reveals the large movements by the large cutting shear, and the latter finding indicates the decreasing depolarization effects due to the increase in slab thickness. 2 Generally, the transformation from the amorphous trans-trans conformation to the semicrystalline trans-trans conformation and cis-trans conformation tends to increase as the mold temperature decreases; moreover, the increasing tendency is more dramatic for the semicrystalline trans-trans conformation. In addition, under the high-load cutting condition, the carbonyl band tends to shift to lower wavenumbers in a slightly mold temperature dependent fashion. We fitted the carbonyl peak shape of the high load cutting data as a moving parameter of the semicrystalline trans-trans peak position and assumed that the peak distance between the semicrystalline trans-trans band and amorphous trans-trans band is fixed as 11 cm−1 and the distance of the amorphous trans-trans band and cis-trans band is fixed as 9 cm−1. These assumptions also were applied to the low-load cutting condition (namely, peak positions are fixed as 1765, 1776, and 1785 cm−1; each distance is 11 and 9 cm−1) because the strain tendency of the carbonyl functional group will occur with equal probability in all conformations. In this analysis, we can observe slightly lower wavenumber peak shifts in all samples under the high-load cutting condition. The largest fluctuations are observed for the 40 °C mold sample, as shown in Fig. 8d.
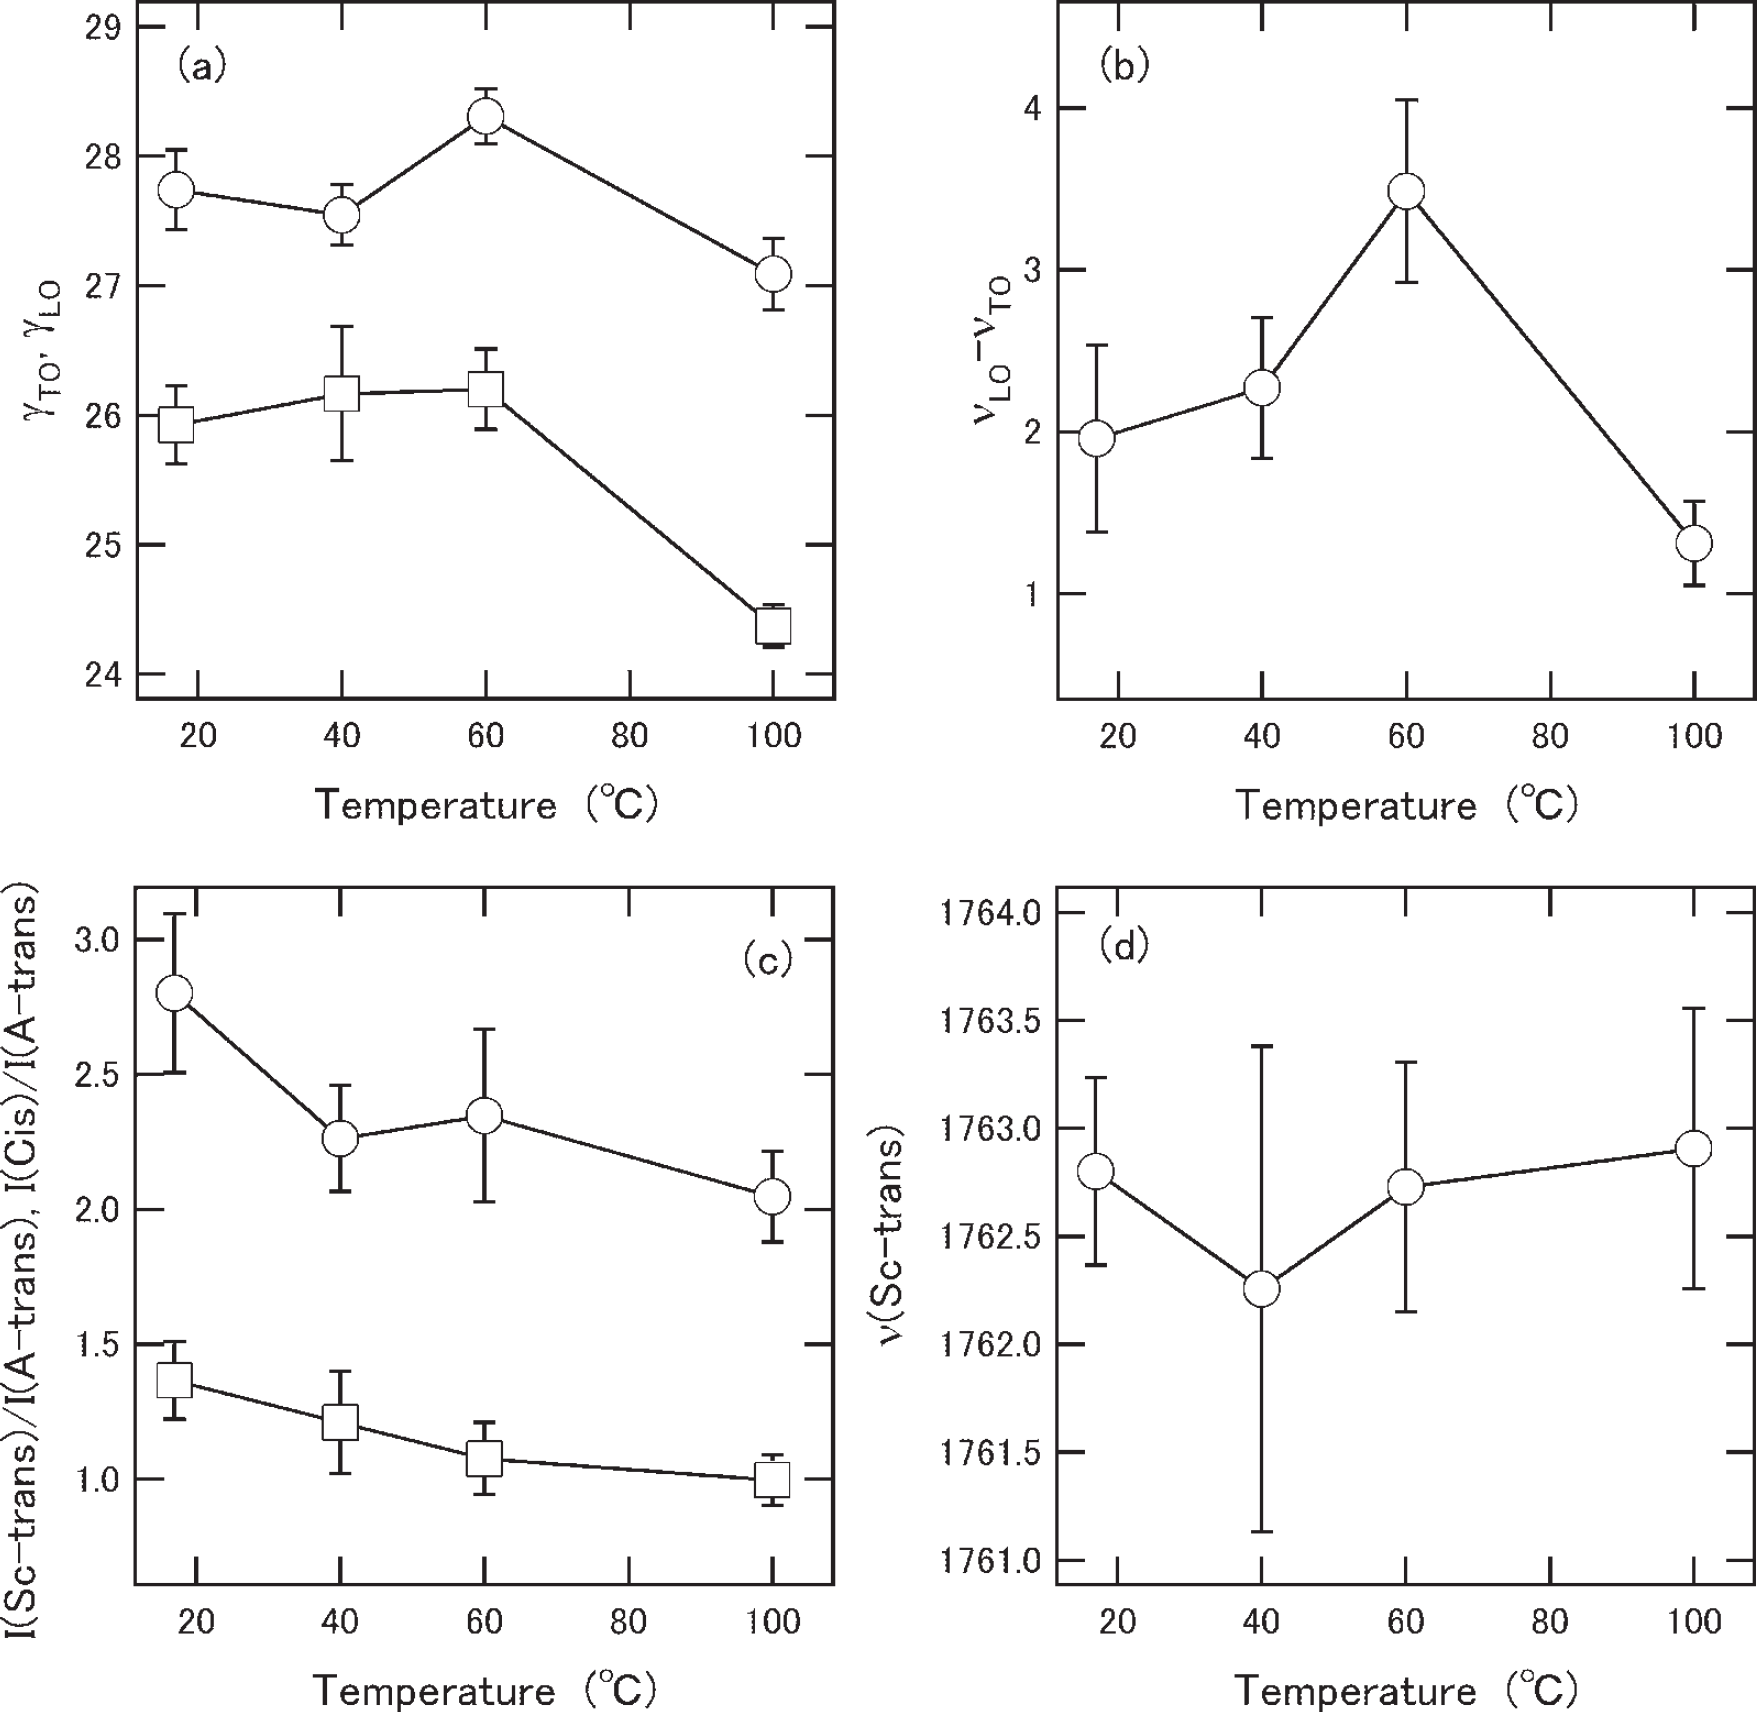
Mold temperature dependence of calculated parameters under high-load cutting conditions. (
DISCUSSION
The flexed state under the low-load cutting condition is thought to be similar to the intrinsic structures before cutting. The marked point appears as the change in the relative content of cis-trans conformations in the low-load cutting condition, especially for the 60 °C mold sample. The cis-trans structures have a large dipole moment and bent structures; 2 thus, this conformation tends to increase the size or number of voids. The voids apparently increase the water contact angle; however, longitudinal vibrations in polar materials such as BPAPC act as a compression wave of charge, inducing a charge at the boundary between the voids and matter. If the voids are not too large, the induced charge at the void boundary will behave as an induced dipole moment. Thus, such voids decrease the water contact angle.
The semicrystalline trans-trans conformation of the 100 °C mold sample is high under the low cutting condition; thus, the cohesive state of the molecular segments is thought to be higher and the void content lower than those of the 60 °C mold sample. However, γLO increases for the 100 °C mold temperature sample under the low-load cutting condition. The high value of γLO for the 100 °C mold sample is thought to originate from the high scattering rate of vibrations due to the entanglements (including cohesive entanglements) rather than the existence of voids because only this parameter for the 100 °C mold sample is lower than that under the high-load cutting condition.
Apparently, the 17 and 40 °C mold samples exhibit less of the semicrystalline trans-trans conformation than the 60 and 100 °C mold temperature samples, as shown in from Fig. 7. In addition, cis-trans is fairly scarce in the 17 and 40 °C mold temperature samples. Thus, the void content is thought to be lower in these samples than the 60 °C sample. The main flexed state of the 17 and 40 °C mold samples features amorphous trans-trans structures, and the cohesive state is weaker than that of the 100 °C sample. However, its void content is lower than that of the 60 °C mold sample. Considering the conformation and polarity parameters, slightly fewer voids are thought to be generated by shear force in the 40 °C mold sample than in the 60 °C mold sample, but slightly more than in the 17 °C mold sample. The difference between the 40 and 100 °C mold samples also appears in γTO and γLO. The cohesive structures in the 40 °C mold sample are different from that in the 100 °C sample because γTO is higher and γLO is lower than in the 100 °C mold sample. These characteristics are thought to be due to the difference in the scattering mechanisms of vibration, namely, the different dominant cohesive states. A large deviation was observed in γTO and γLO in the 40 °C mold sample, which suggests large spatial fluctuations of the cohesive and noncohesive structures.
The results obtained from the high-load cutting condition partially reflect the intrinsic structures before cutting and can be used to speculate about the transition of the molecules from the flexed state observed under the low-load cutting condition to the polymers under the high-load cutting condition to study the molecular interactions. Regarding conformation changes, the conformation profile under the low-load cutting condition as a function of mold temperature, which reflects the water contact angle profile, disappears under the high-load cutting condition. The semicrystalline trans-trans and cis-trans conformations gradually increase as the mold temperature decreases. This tendency is interpreted as an increase in the transformation from amorphous trans-trans to these conformations due to the high shear force as the mold temperature decreases. The results are supported by the structure of the 100 °C mold sample, which is in the higher cohesive state, and the 17 °C mold sample, which is in another lower cohesive state, i.e., a mainly amorphous trans-trans structure, under the low load shaving condition. This finding is attributed to the high load cutting providing a large amount of energy to the sample, contributing mainly to molecular movement in the relatively loosely bound amorphous trans-trans structure.
The change in the polarity parameter νLO − νTO indicates that the number or size of voids increases dramatically in the 60 °C mold sample. The void formation, which cannot be clearly observed in the low-load cutting condition, is manifested by molecular movement and release from the entangled state by the high-load cutting condition. Such microscopic fracture structures induce differences in the damping factors even though the absolute values indicate a lower tendency than the values for the low-load cutting condition. Therefore, γTO and γLO, which reflect the anharmonic scattering due to fracture-related voids under the high-load cutting condition, are higher in the 60 °C mold sample. In particular, there is a high content of such voids in all samples except the 100 °C mold sample. It seems that the 100 °C mold sample is difficult to disentangle, even under high-load cutting conditions. Considering the conformation change, we note the entirely lower wavenumber shift of the carbonyl band, which was not observed under the low-load cutting conditions. Generally, the carbonyl band shifts to higher wavenumbers under high compressive pressure. 18 Therefore, the lower wavenumber shift indicates the strain tendency in the process of high load shaving. The strain of the molecules is due to the segmental dipole interactions of the carbonyl. We can monitor the lower wavenumber side shift of the representative carbonyl band, such as the shift of the semicrystalline trans-trans band. The 1765 cm−1 peak shifted by approximately 2–2.5 cm−1 in all samples. This large difference was not observed for each mold temperature, however; a slightly smaller shift of the peak position and relatively large fluctuation was observed in the 40 °C mold sample. We can speculate that the shifts evidence cohesional entanglements due to dipole moment interactions of carbonyl9,10 and that the strengths of the cohesional entanglements in each conformation are relatively similar but the cohesional entanglements fluctuate spatially in the 40 °C mold sample. The results show that the cohesional entanglements from the carbonyl functional group associated with the dipole interaction is relatively high in the 40 °C mold sample. Based on our previous analysis, the total cohesion is superior in the 100 °C mold sample; thus, the cohesional entanglements from dispersion forces are superior in the 100 °C mold sample. The peak shift profiles are thought to associate with γTO in the low load cutting mode. The cohesional entanglements due to carbonyl dipole interactions are manifested in γTO as a scattering of transverse vibrations in the low load cutting mode and peak shifts of the carbonyl band in the high load cutting mode.
The contact angle directly reflects the cohesive state of the molecular structures at the surface of the polymer plate. However, water is a special material, with large dipole moments and large orientation polarization in addition to dispersion forces. The contribution of dispersion forces to the surface tension of water is approximately 27% of the total, and the remainder arises from nondispersion forces, such as polar interactions and hydrogen bonding interactions. 8 In contrast, the main forces of the contribution to the surface tension of the hydrocarbon oil are dispersion forces. Therefore, water and oil will be used to manifest the main origin of the cohesion forces of polymers as a contact angle.
In the flexed state of the 60 °C mold temperature, the cis-trans structures accompanying the voids can be observed, especially for lower water contact angles. For the 100 °C mold sample, the semicrystalline trans-trans structures with low dipole moments tend to decrease the wettability of water despite high cohesion. It is well known that the van der Waals pair potential goes as ∼C/r 6 from large distance, where C is a constant and r is the intermolecular distance. In the van der Waals interactions, the dispersion forces behave as ∼C/r 5 when the molecular segments are aligned parallel.8,19 In contrast, the dispersion forces behave as ∼C/r 7 (the Casimir–Polder force) due to the retardation effect when the molecular distance is large.20,21 Namely, the dispersion forces work effectively when the segmental distances approach one another and in locally aligned structures, such as the semicrystalline trans-trans conformation. Therefore, the 100 °C mold sample seems to consist of a highly cohesive state mainly constituted by dispersion forces, which would explain its oil contact angle being the lowest. Alternatively, the 60 °C mold sample is in the cohesive state mainly constituted by dipole interactions (mostly dipole-induced dipole interactions). Cis-trans bent structures apply large dipole moments, but the increased segmental distances will work to decrease the dispersion forces rapidly in the vicinity of such conformations. In the 40 °C mold sample, there are fewer cis-trans structures than in the 60 °C mold sample and semicrystalline trans-trans cohesion structures than in the 60 and 100 °C mold samples. However, cohesional entanglement–associated dipole interactions on the carbonyl functional groups are accompanied by large spatial fluctuations; thus, the contact angle of water the 40 °C mold sample is ranked immediately after that of the 60 °C sample even though the main structures are of the amorphous trans-trans conformation. The main structures of the 17 °C mold sample are loosely bound amorphous trans-trans conformations. The above-mentioned cohesive models, which incorporate dipole interactions and dispersion interactions, well explain the behaviors of the water and oil contact angles.
The mold temperature will strongly affect the melting pressure of the sample in the injection process, and the process will determine the entanglement and the cohesion in the polymer molecules in the glassy state. The 100 °C mold temperature seems to have a good effect in terms of entanglements or cohesion assisted by the dispersion forces.
We have already observed that the fatigue lifetime for samples prepared at low mold temperatures is shorter than that of the 100 °C mold sample. Roughly speaking, based on the above-mentioned results, the molecular entanglements and the cohesion of each segment (and thus the distribution of voids) are very different among different mold temperature conditions. The fatigue lifetime strongly depends on the molecular weight, with the lifetime being longer for higher molecular weights. 11 If the molecular weight is high, the relative ratio and the probability of entanglement is higher than those of the lower molecular weight samples. Thus, in this model, the molecular chains will take a long time to disentangle and rupture. However, this model cannot explain the plentiful evidence that some samples have extremely different lifetimes despite having the same molecular weight. The differences in cohesive state and entanglement originating from the order of the structures can be set by the molding conditions, and it will strongly affect the macroscopic properties of polymers, such as wettability and fatigue lifetime.
CONCLUSIONS
Our proposed method provides images of the changes of the conformational structures of BPAPC in the flexed state. We also propose a mold temperature dependence of the flexed state. The samples prepared at a 100 °C mold temperature exhibit a flexed state structure relatively rich in the semicrystalline trans-trans conformation, and the cohesion and/or entanglement is high. Conversely, the samples prepared at a 17 °C mold temperature feature a flexed state structure rich in the amorphous trans-trans conformation. The samples prepared at a 60 °C mold temperature have a structure rich in the cis-trans conformation, including many small voids. The samples prepared at a 40 °C mold temperature feature a flexed state containing spatially distributed cis-trans, amorphous trans-trans, and semicrystalline trans-trans conformations, but the main structures are amorphous trans-trans. These higher order structures are thought to be related to the macroscopic properties of glassy BPAPC, such as the liquid contact angle. In addition, the wettability can be explained by such models using flexed state analysis of the Gervais model. Thus, the anharmonic effect is important for explaining such macroscopic properties.