
Abstract
Solid-state chiral chemistry has attracted significant scientific interest because of its application in the chiral-selective production, chiral recognition, resolution, and detection of enantiomers of a chiral compound. Combining a novel diffuse reflectance circular dichroism (DRCD) technique with powder X-ray crystallographic analysis, we investigated the origin of chiral properties from the molecular and supramolecular chiralities and the possibility of separating independent CD signals from the superimposed CD signal resulting from different chiral origins.
Many researchers have studied chiral chemistry since Louis Pasteur 1 discovered the chiral nature of molecules more than 160 years ago. As a consequence of the biological homochirality on Earth, metabolic and regulatory processes mediated by biological systems are sensitive to particular enantiomers, and different responses can often be observed for chiral molecules interacting with such systems. Therefore, to study chiral chemistry as it relates to various biological processes, such as for the development of new therapeutic drugs, agricultural chemicals, and food additives, chiral recognition and resolution are very important. Recently, solid-state chiral chemistry has come into the spotlight in many research fields because of the remarkable molecular recognition/discrimination, chiral transcription, and chiral amplification in the solid state compared to the solution state, caused by the short distances between adjacent molecules in crystals.
The best-known chiroptical technique for chirality measurements is circular dichroism (CD) spectroscopy. However, a disadvantage of commercially available CD spectrophotometers is that they are restricted solely to samples in the solution state. With the aim of opening up a new field of solid-state chiral chemistry, we designed and recently constructed solidstate CD spectrophotometers (the Universal Chiroptical Spectrophotometer [UCS]) and developed an analytical procedure based on the Stokes–Mueller matrix approach. 2 We then used these instruments and the analytical methods to carry out several valid chirality measurements3–14 in the solid and condensed phases that cannot be achieved with conventional CD or circular birefringence (CB, or optical rotational dispersion) spectrophotometers. The UCS is very useful for measuring transmittance CD spectra of uniaxial single crystals2,15–18 (size > 1 × 1 × 1 mm 3 ) and potassium bromide (KBr)/potassium chloride (KCl) disks used for microcrystalline samples, which are now widely used in solid-state chirality measurements. However, standard KBr/KCl matrix methods 19 and the alternative Nujol mull method cannot be applied to sublimable samples 20 or to samples that react with diluent matrices 21 during the KBr (or KCl) disk-formation processes or that dissolve in Nujol. 20 These samples must be studied as powdered samples. However, there has been no way to obtain their CD spectra directly because transmittance spectroscopy is not applicable. Thus, in situ chirality measurement of these materials is of great interest in many research fields of solidstate chirality chemistry. Recently, diffuse reflectance circular dichroism (DRCD) spectroscopy, which was first developed by Bilotti et al. 22 in 2002, has attracted considerable attention as a new analytical tool for in situ chirality measurements and is most suitable for microcrystalline samples. The DRCD spectrophotometer was originally constructed by using an optimized integrating sphere; its detailed instrumentation is provided in previous papers.23,24 Using a DRCD method, CD measurements for all powdered and microcrystalline samples are attained irrespective of the size of a single crystal. However, despite its high potential for solid-state chirality measurements, this method has not been extensively exploited because it was devised only recently. We found the method to be effective for measuring sublimable samples 20 and the crystalline powders obtained from solid-state crystallization by cogrinding two types of crystals. 25
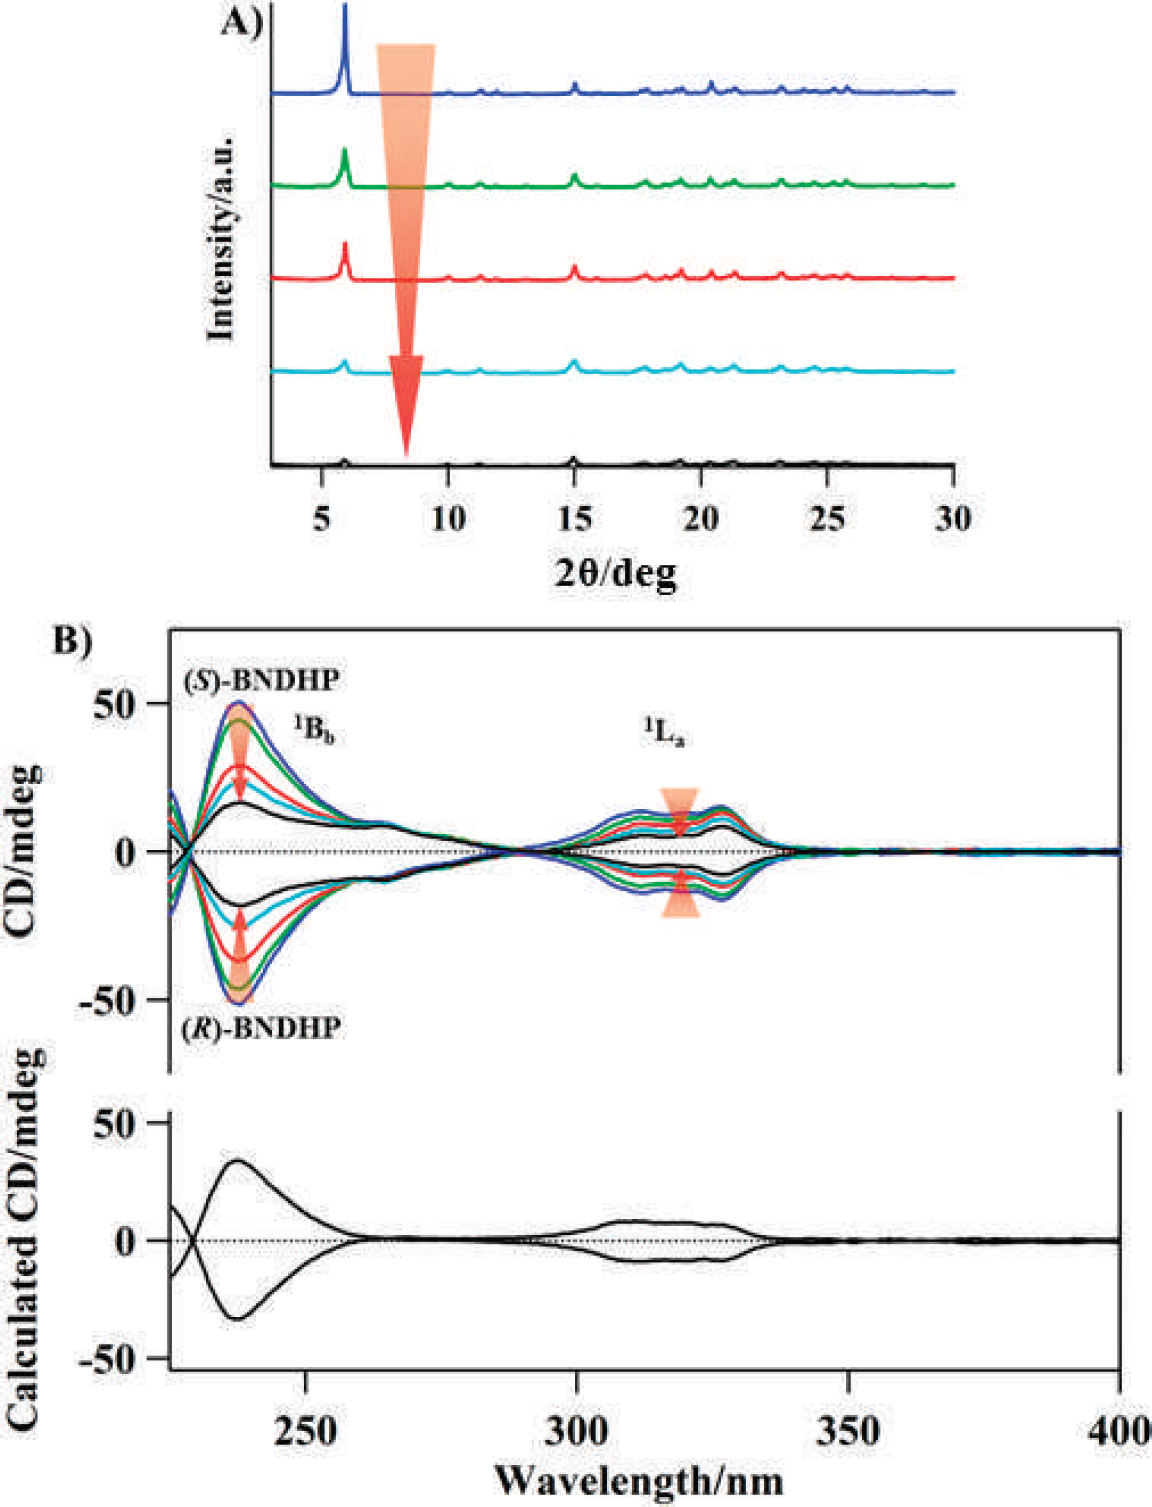
In this paper, we show a new application of the DRCD method for developing solid-state chirality measurements, in which it is possible to separate independent CD signals from the superimposed CD signal resulting from different chiral origins, the configurational and constitutional chiralities. Optically active (S)-(+)-1,1′-binaphthyl-2,2′-diyl hydrogenphosphate ([S]-BNDHP) and (R)-(–)-1,1′-binaphthyl-2,2′-diyl hydrogenphosphate ([R]-BNDHP), having a chiral biaryl axis, were used in this experiment (Fig. 1). The crystals of (S)- and (R)-BNDHP (Tokyo Kasei Co. Ltd.) 27 were recrystallized from a methanol (MeOH) solution prior to use. A single crystal has optical activities originating from the chiral supramolecular arrangement and molecular chirality. It belongs to the orthorhombic symmetry class with the space group P212121. 26 The BNDHP molecules are packed in a specific way to form hydrophobic and hydrophilic layers that are well separated. Between BNDHP molecules, at the interface of these hydrophobic and hydrophilic layers, a space with chirality is formed. Therefore, the chirality of BNDHP single crystals originates from the molecular and crystal structures arising from the chiral packing of the molecule. Some single crystals have the extraordinary property that the crystal structure (crystal lattice) is easily broken by simple grinding of the microcrystallites. The BNDHP crystal belongs to this group. Using powder X-ray diffraction (XRD) measurements, we investigated the influence of external factors on its easily collapsed crystal lattice. Powder XRD patterns were recorded on a Rigaku X-ray MultiFlex diffractometer. The intensity of the XRD pattern decreased on changing the external factor—that is, increasing the strength of grinding—and the grinding process changed single crystals into the amorphous state, as shown in Fig. 2A. The sample volume in a series of XRD measurements was made the same wherever possible. In the figure, BNDHP is the bottom XRD signal (black); it is predominantly amorphous because the crystalline amount is below 7%, which is a similar value to that from crystallization by the rapid cooling of a melt. To investigate the influence of the external factor on the chiral supramolecular structure, we carried out DRCD measurements with grinding in the solid state as well as XRD measurements. The DRCD spectra were obtained from a pure microcrystalline sample using a UCS-4 that has a performance equivalent to a DRCD spectrophotometer.23,24 The UCS-4 is based on the electrical and optical systems of a commercially available spectrophotometer (JASCO J-820) equipped with two lock-in amplifiers (for 50 and 100 kHz signals), a photoelastic modulator (PEM) having a small residual static birefringence (α = 0.16 at 400 nm), and a homemade integrating sphere made from the ISV-469 model (JASCO) whose optical arrangement is shown in Fig. 3 together with the electrical system. The optical axis of the photomultiplier as detector was set at 45° with respect to the x- and y-axes of its photoelectric surface, and the PEM driving voltage was adjusted to J0(δ0) = 0. In general, both diffuse reflectance, the intensities of which obey Lambert's law, and specular components, the intensities of which do not obey this law, are usually present in DRCD measurements. 28 Similarly, DRCD is not only from diffuse reflections but also from regular reflections, and the relative magnitudes of their contributions to the total reflectance depend on the nature of the reflecting medium. It is therefore essential to prevent the contamination of regular reflections into diffuse reflections in the measurement of solid materials, particularly in those with a strong absorption. It is well known that the specular component can be partially removed from the detected signal by selecting a smaller particle size. 29 To decrease the specular reflection, the microcrystalline samples were sieved to select a narrow sieve fraction (100–53 μm) using special two-tier sieves (Nonaka Rikaki Co., Ltd). The artifact signals, which arise from the interaction between the intrinsic macroscopic anisotropies (linear birefringence [LB] and linear dichroism [LD]) of the sample and the nonideal characteristics of the polarization–modulation instruments, 2 were checked using the Stokes–Mueller matrix approach. The apparent CD signal (50 kHz) has terms dependent on, as well as independent of, the sample rotation in the plane perpendicular to the light beam, as shown in Eq. 1.
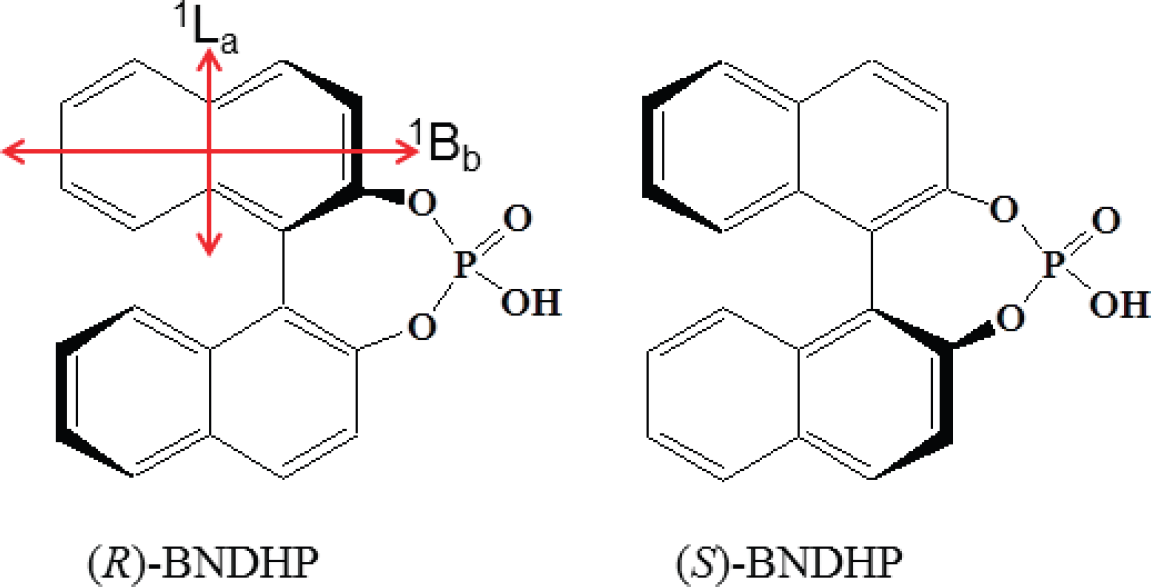
Structures of optically active (R)-BNDHP and (S)-BNDHP are shown together with the transition moments for the naphthalene moiety.
(
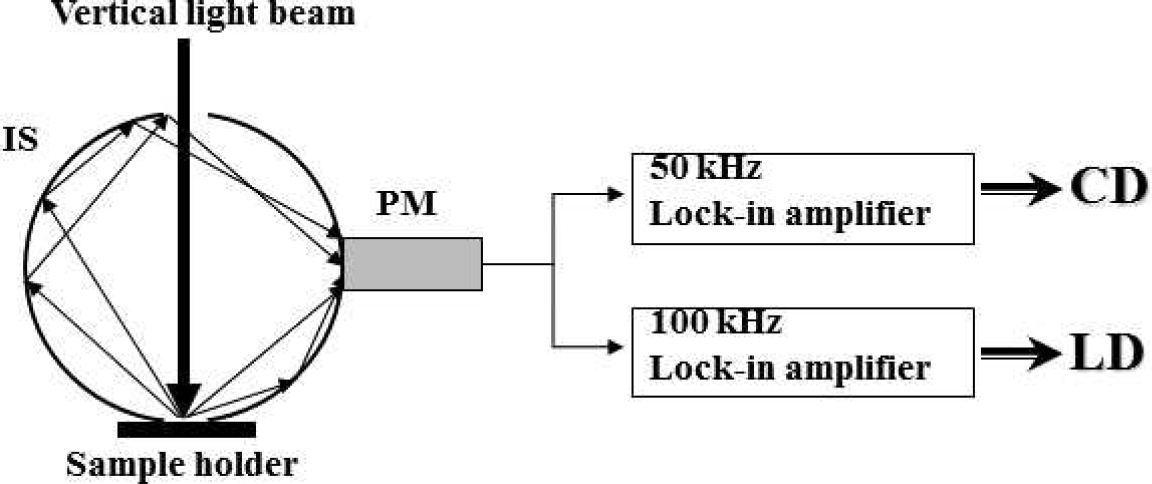
Optical arrangement showing the integrating sphere in the UCS-4 together with the electrical system. IS, integrating sphere; PM, photomultiplier tube.
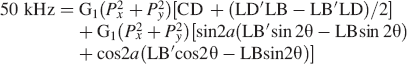
where G1 is the apparatus constant related to the sensitivity of the lock-in amplifier at 50 kHz; LB′ and LD′ are the 45° LB and LD, respectively; P 2 x – P 2 y are the transmittance of the photomultiplier along the x and y directions; a is the azimuth angle of its optical axis with respect to the x axis; and θ is the rotation angle of the sample.
The DRCD signals of BNDHP hardly changed with sample rotation (Fig. S1 † ), and hence, the angular-dependent terms multiplied by the polarization of the detector, P, are negligible. Here, the components of P from the detector are expressed as (P 2 x – P 2 y ) sin 2a and (P 2 x – P 2 y ) cos 2a. The LB values of the sample were expected to be less than 10−2 to 10−3 optical density (OD; 1 mdeg = 3.05 × 10⁻⁵ OD) because the value of P for the UCS-4 was estimated to be on the order of 10−3 at 350 nm. 30 Similarly, the 100 kHz signal is given as follows:
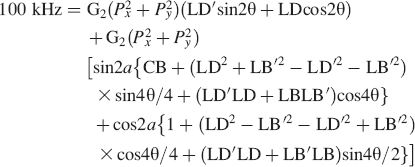
where G2 is the apparatus constant related to the sensitivity of the spectrometer at 100 kHz. The 100 kHz signal is nearly equal to the LD signal because the terms multiplied by (P 2 x – P 2 y ) are negligibly small. 31 The LD signals of the current samples were measured to be on the order of 10−3 to 10−4 OD (Fig. S1), and hence the angular-independent terms are 10−2 to 10−3 times smaller than the true DRCD signal.
Thus, we can conclude that the DRCD spectra of microcrystalline BNDHP recorded on the UCS-4 are free from artifact signals related to regular reflections and macroscopic anisotropies. The correctness of the observed DRCD spectra was checked using transmittance CD measurements in the solid state. The DRCD spectra for pseudo-amorphous samples showed a quite good coincidence with the transmittance CD spectrum (Fig. S2 and Table SI) obtained using the KBr method, even though a characteristic red shift (9 nm) and decrease in signal intensity were observed in the allowed 1 Bb transition. The transmittance CD spectra for microcrystalline BNDHP were obtained for a freshly prepared KBr disk and recorded using a UCS-4. A mixture of approximately 10 μg of the sample and 130 mg of dried KBr was ground and formed into a disk 0.5 mm thick with a radius of 10 mm. True CD spectra in the solid state were obtained using a specially devised set of procedures based on the Stokes–Mueller matrix method. 31 The red shift at the shorter wavelength might be influenced by its large extinction coefficient (ε227 = 6.97 × 10⁴ M−1 cm−1 in propan-1-ol solution; Fig. S3), which is 10 times larger than that (103 order) of the other 1 La band at a longer wavelength. This might be moderately improved by diluting the light-absorbing BNDHP with an inert low-absorbing matrix. Thus, these results are enough to prove the validity of true DRCD spectra.
The grinding had remarkable effects on the DRCD spectra and XRD pattern: The intensity of the XRD pattern decreased with increasing strength of grinding and the grinding process changed single crystals into pseudo-amorphous crystals; the corresponding DRCD signals for BNDHP enantiomers also showed a marked declining trend with grinding, as shown in Fig. 2B. It might be suggested that the mirror image of DRCD spectra for enantiomeric amorphous samples originating only from intrinsic molecular chirality were obtained. In practice, the spectra essentially agree well in solution, although there is a red shift from the solution spectrum produced by the solvent effect (Fig. S3). Accordingly, the DRCD spectrum arising from only supramolecular chirality could be calculated by subtracting the DRCD spectrum for the amorphous BNDHP from that for the single crystal without grinding (Fig. 2B, bottom). The electronic transition energies and rotational strengths for BNDHP monomer and dimer were calculated using time-dependent-response function theory 32 on the basis of the B3LYP hybrid density functional 33 with the cc-pVDZ basis set.34,35 See Fig. S4 for the calculated data. This experimentally calculated CD curve is similar to the curve for the crystal. This is consistent with the simulation results of the CD spectrum for the dimeric molecular cluster, which was picked out of the X-ray crystal structure, typically showing the same band shape as for the monomer (Fig. S4). It is also implied that the lowenergy shoulder on the charge-transfer (CT) band (260–280 nm) between binaphthalenes 36 is not influenced by the configurational chirality, which is mainly governed by intermolecular CH–π interactions between the naphthalene moieties, given that a difference in its intensity was not observed between crystalline and pseudo-amorphous states. In conclusion, we could obtain, for the first time, distinguishable CD spectra well separated from the molecular and supramolecular chiralities of isomeric BNDHP chiral crystals. In the crystal, enhancement of the CD intensity occurs because of the increase in rotational strength related to an exciton coupling and reflects the fact that the BNDHP molecule has a smaller dihedral angle between the two naphthalene planes of 57.7°, associated with higher CD intensity. 37
In summary, solid-state DRCD spectroscopy provides a unique chance to study not only supramolecular chiral compounds in the crystalline state but also chiral molecular assemblies in films, gels, micelles and liquid crystals. We were able to acquire intriguing physicochemical information that is not obtainable using commercially available CD spectrophotometers. The information will contribute to opening up a new field of solid-state chiral chemistry and offers many new experimental possibilities. This DRCD method will become a versatile tool that can contribute to research to discriminate between the molecular chiral structure and the chiral structures of ordered molecules or atoms, supramolecular chirality, which cannot be obtained using other methods.
Footnotes
ACKNOWLEDGMENTS
The authors thank Professor R. Kuroda of the Tokyo University of Science for helpful discussions. This work was supported by a MEXT-Supported Program for the Strategic Research Foundation at Private Universities, Japan.
Notes
†
For Figures S1–S4 and Table SI see the Supplementary Material.