






Abstract
Vibrational spectroscopy is one of the most powerful tools in polymer science. Three main techniques—Fourier transform infrared spectroscopy (FT-IR), FT-Raman spectroscopy, and FT near-infrared (NIR) spectroscopy—can also be applied to wood science. Here, these three techniques were used to investigate the chemical modification occurring in wood after impregnation with tannin–hexamine preservatives. These spectroscopic techniques have the capacity to detect the externally added tannin. FT-IR has very strong sensitivity to the aromatic peak at around 1610 cm−1 in the tannin-treated samples, whereas FT-Raman reflects the peak at around 1600 cm−1 for the externally added tannin. This high efficacy in distinguishing chemical features was demonstrated in univariate analysis and confirmed via cluster analysis. Conversely, the results of the NIR measurements show noticeable sensitivity for small differences. For this technique, multivariate analysis is required and with this chemometric tool, it is also possible to predict the concentration of tannin on the surface.
Keywords
INTRODUCTION
A cradle-to-cradle approach is used in miming the naturally occurring processes for synthetic systems,1–3 and protecting wood with the same processes occurring in the plant kingdom represents an interesting solution for a cradle-to-cradle-designed wood preservative. Trees protect their living matter with resistant dead cells in the bark and heartwood. Metabolic pathways are activated during the natural physiological aging process, including a complex series of chemical reactions that produces tannins.4,5 Protecting wood with tannins has been known for decades.6,7 Within the vegetal world, such compounds are used as preservatives, offering protection against light (e.g., developing free radicals due to ultraviolet irradiation) and against biological attack by insects, fungi, and bacteria.8–10 Advanced formulations based on condensed tannins allow us to overcome the considerable drawback of leachability.11–13 Thus, preservative retention and its distribution in impregnated wood are very important issues relating to the service life of these products. Diluted tannin-based water solutions with low viscosity allow a liquid preservative to penetrate the wood structure and disperse more homogeneously within the wood.14–18
Thus, a fast and nondestructive method is required for transfer from laboratory to industrial conditions for the analysis of tannin distribution in wood. Fourier transform infrared spectroscopy (FT-IR) can be used to investigate the changes in wood components and preservatives.19,20 Many studies have examined the use of tannins for various products and their influence on these materials' properties;21–24 however, using different types of vibrational spectroscopy to examine tannins and their interactions with wood components are rare.
Pizzi 25 mentioned that the infrared (IR) band at about 1450 cm−1 corresponded with the aryl ring vibrations of the tannin resin. Other researchers have characterized various tannin extracts from different sources via FT-IR.26–28 Kim and Kim 29 analyzed the curing behavior of tannin-based adhesives and found that the different molecule bridges of the pure tannin resin (mimosa tannin hardened with hexamine) can be observed only for the N–H wagging peak at 750 cm−1, whereas Ozacar et al. 30 conducted similar studies related to condensation with formaldehyde to analyze various reaction products. The curing reactions between the mimosa and chestnut tannin and hexamine at various acidic and alkaline pH values were analyzed by Peña et al. 31 They concluded that different chemical structures are obtained at various pH values of the solutions. However, studies on the interaction between tannin and wood components by vibrational spectroscopy techniques have not been published to date.
Here, we analyzed of the interaction between tannin and wood components and showed the possibilities of focusing on FT-IR, FT-Raman, and FT near-infrared (NIR) for the classification of various tannin-impregnated wood samples.
EXPERIMENTAL
Tannin impregnation solutions were prepared with 2.5, 5, 10, and 20% (w/w) mimosa (Acacia mearnsii) extract in deionized water. The pH values of these solutions were corrected with 50% sodium hydroxide at pH 9.0. Finally, a solution of 33% by weight hexamine (hexamethylenetetramine) was added so that the solid hexamine/tannin ratio was always 6 : 100.
RESULTS AND DISCUSSION
Estimated mean and SD of wet and dry retention of various tannin solutions.

The results showed that wood species that are more easily impregnable reach similar values of wet retention when different tannin solutions are used. The deposited tannin retentions for Scots pine and European beech wood samples are proportional to the concentration of the impregnation solution. For the Norway spruce samples, the impregnations were not complete in cross section of the samples and the core was still untreated, but the impregnation process can still be considered successful for our purposes because the spectra reflect the chemistry on the external surface of the sample. Thus, the local concentration of the deposed tannin also can be considered proportional to the concentration of the impregnating solution for Norway spruce samples.

ATR and baseline-corrected and normalized FT-IR spectra of untreated and 2.5, 5, and 20% tannin-treated Scots pine samples.
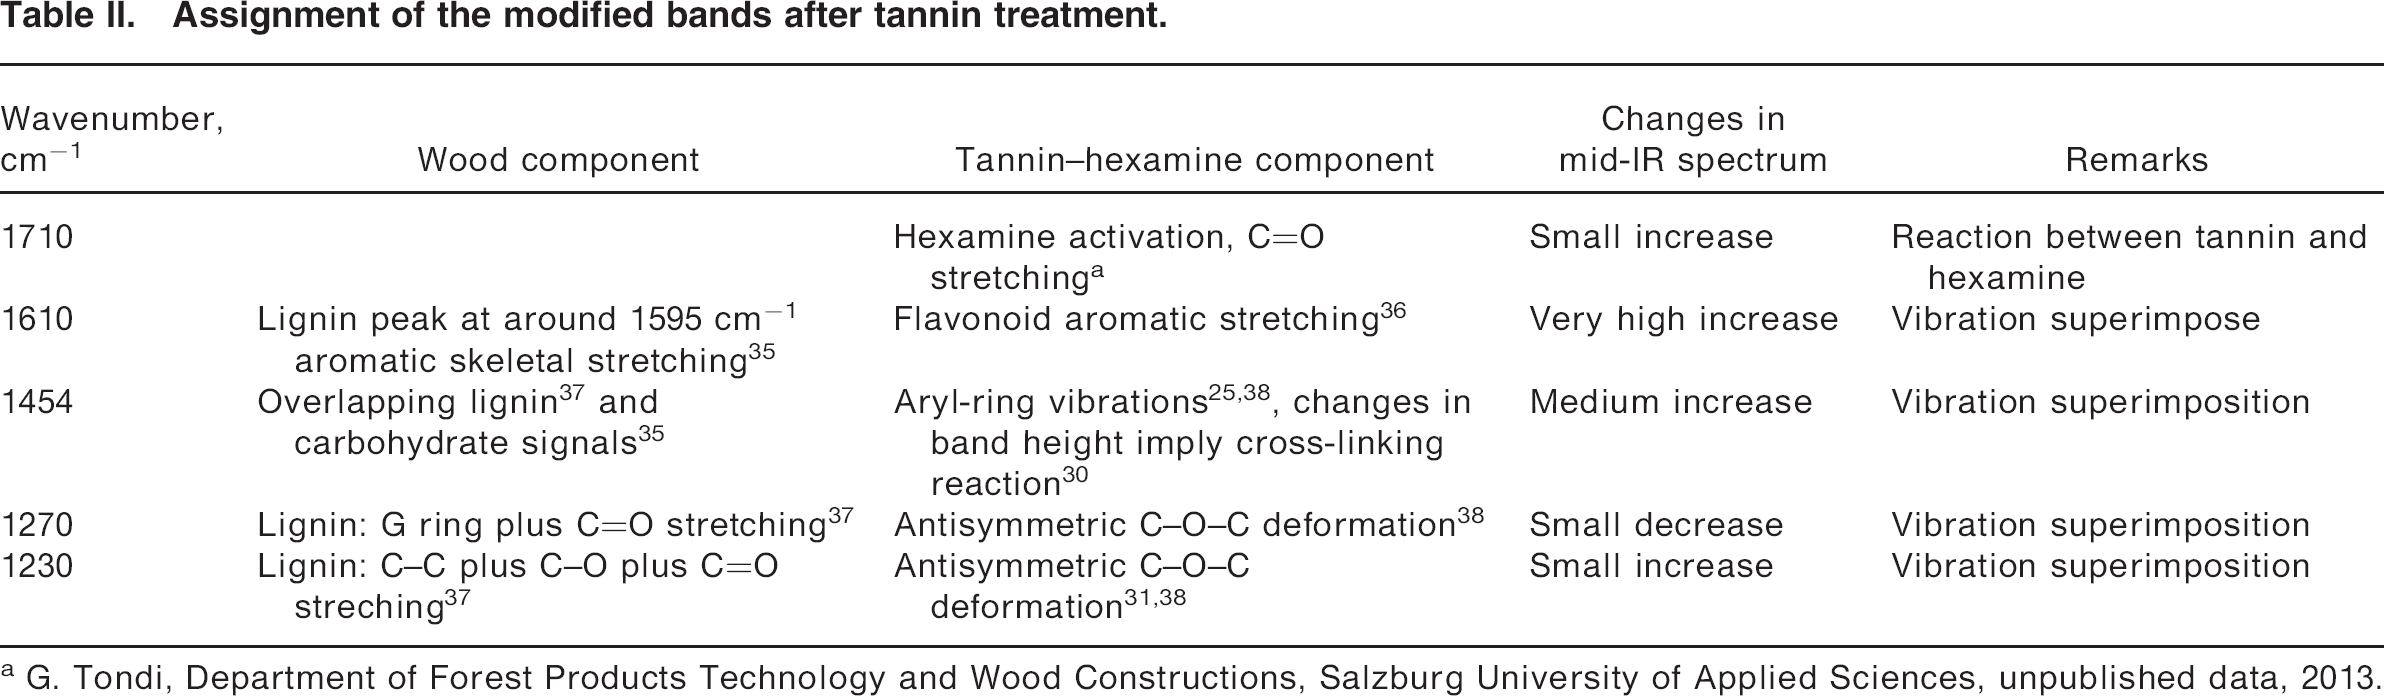
Table II shows the bands that change after tannin impregnation. No evidence of new covalent bonding between the tannin polymer and the wood surface can be observed. This information led to further analyses and an interest in defining the threshold for which the tannin impregnation level is still detectable. Figure 1 depicts the capacity of the ATR unit of the FT-IR spectrometer to detect very small concentrations of tannin. Proportionality can be revealed between the concentration of the tannin solution and the peak at around 1610 cm−1. The importance of this peak was also noted for beech and spruce wood (Fig. 2). Notwithstanding, the signal at 1454 cm−1 increases for the tannin-treated samples, confirming that this wavenumber also gives information related to the presence of wood preservative on the surface. The bands at 1270 and 1230 cm−1 showed very clearly the increase in aromatic compounds and C=O groups 37 of tannins on the surface for spruce, whereas for beech, these bands are overlapped by the absorbance of C–O vibration at 1242 cm−1 from acetyl groups of hardwoods. 39

ATR and baseline-corrected and normalized FT-IR spectra of untreated and 20% tannin-treated beech and spruce samples.
Assignment of the modified bands after tannin treatment.
G. Tondi, Department of Forest Products Technology and Wood Constructions, Salzburg University of Applied Sciences, unpublished data, 2013.

FT-Raman spectra without data treatment of Scots pine untreated, 10% tannin-treated, and 20% tannin-treated samples compared with the pure tannin–hexamine polymer.
After baseline correction, it was possible to focus on the region between 1800 and 700 cm−1; however, there is still fluorescence in the FT-Raman spectrum of 20% for the treated Scots pine samples. The spectra in Fig. 4 show the importance of the signal at 1600 cm−1. This aryl stretching peak at 1600 cm−1 increased after tannin impregnation. Also, a clear change in the Raman intensity was seen at around 1660 cm−1, corresponding to an unsaturated molecule (C=C) with a carbonyl group (C=O).40,41 Kihara et al. 42 concluded that the band around 1660 cm−1 is strongly influenced by the ring-conjugated α,β-unsaturated bonds in lignin. A slight change is also seen at 780 cm−1, where the intensity for tannin polymer in beech, pine, and spruce wood after impregnation increased. However, all spectra showed a peak around this Raman shift; therefore, this band cannot be used to evaluate the chemical changes due to tannin impregnation. The low-frequency region below 900 cm−1 of the Raman spectrum is difficult to assign to functional groups of wood. 40

Baseline-corrected FT-Raman spectra of Scots pine untreated, 10% tannin-treated, and 20% tannin-treated samples compared with the pure tannin–hexamine polymer.
Despite the technical problems due to fluorescence, FT-Raman still indicates the influence of tannin on the spectra through detection of the aromatic ring at 1600 cm−1.

(
Mitchell and Schimleck 43 detected a very good correlation between absorbance values of the band at 1595 cm−1 from mid-IR spectroscopic measurements and the intensity values from the band around 5995 cm−1 of the NIR spectra of hardwood samples, which is the first overtone of aliphatic and aromatic C–H stretching vibration.44,45 Schwanninger et al. 46 concluded that this band at around 5970 cm−1 might also arise from involved vibrations of the aromatic groups in softwood lignin. Similarly, the tannin polymer presented a band at around 4690 cm−1, and this band could be also associated to the combination of C–H stretching and C=O stretching of the acetyl groups. 46
Moreover, the first overtone of O–H stretching vibration can be observed for the amorphous region of cellulose at 7000 cm−1,46,47 and for the phenolic OH groups around 6900 cm−1.47–49 The tannin resin showed an absorption band at about 6960 cm−1. This band influenced detection of the OH groups of cellulose band at 7000 cm−1. 46 Such a phenomenon could be observed in all wood species tested.

Cluster analysis of FT-IR spectra of samples from three tannin treated and untreated wood species.
In summary, FT-IR is able to classify (1) hardwoods and softwoods, (2) treated and untreated samples, and (3) low concentrations of tannin on the surface. The chemical differences caused by the tannin treatments are more significant for the cluster than the differences between softwoods, whereas the influence of low concentration of tannin (2.5, 5, and 10%) is the last parameter that can de differentiated. However, if the concentration of tannin is high (20%), then the cluster analysis was not able to classify the tannin-impregnated samples correctly.
The cluster branching calculated for FT-Raman spectra was comparable to that for FT-IR spectra, whereas a smaller heterogeneity of the FT-Raman data could be observed.
A different behavior of the clustering was obtained for the FT-NIR data (Fig. 7), for which the highest difference was registered for treated and untreated hardwood and softwood samples; therefore, the sensitivity of this technique on externally added tannin can be observed. However, if the concentrations of tannin (2.5, 5, and 10%) on the surface are low, the heterogeneity of the FT-NIR data also is very low, and the Ward algorithms of the cluster analysis are not suitable for the correct classification of the Scots pine samples. Nevertheless, the FT-NIR data provide a classification of the samples into their family as well as their wood species if the tannin concentration on the surface is a maximum of 10%. The penetration depth of FT-NIR radiation is higher than that of FT-IR. 46 Therefore, it can assumed that FT-NIR provides information from inside the samples, where the proportion of the tannin decreased and the proportion of untreated wood increased. This sensitivity was exploited to verify the correlation between concentration of tannin solution applied and the intensity of the NIR signal for separate wood species.

(

Predicted versus measured values of the PLSR model to estimate the tannin dry retention of the impregnated Scots pine samples with the FT-NIR data.
The Scots pine wood samples were impregnated with various solutions of 2.5 to 20% tannin concentrations (Table I). The data of the tannin dry retention determination showed dependence on the tannin solutions and the amount of tannin in the wood samples. Tondi et al. 14 concluded that the penetration of flavonoids in Scots pine occurs longitudinally through tracheids with open-bordered pits and across radial direction through parenchyma rays, whereas beech is almost exclusively penetrated in the longitudinal direction through large and easily accessible vessels. Therefore, it could be assumed that the tannin impregnation in the wood is not uniformly distributed in the samples with dimensions of 25 mm 3 × 25 mm3 × 25 mm3. The highest tannin amount is on the surface and with increasing penetration depth, the tannin concentration decreases. Figure 8 shows that with higher tannin retention of the samples, the differences between the real dry tannin retention values and the regression model increased, and a heteroscedasticity in the residue can be seen. The dry tannin retention was measured gravimetrically, and the difference in tannin uptake between cross-section and radial and tangential surfaces was not determined. Therefore, these PLSR models might be influenced by the nonhomogeneous distribution of the tannin within the cross section and the different penetration depths of the tannin in the samples. To improve these regression models, further measurements of smaller samples (e.g., 10 mm3 × 10 mm3 × 10 mm3) can balance the tannin distribution in the samples to minimize the inhomogeneity of the sample thickness.
CONCLUSIONS
This study demonstrated the efficacy of three vibrational spectroscopic techniques to analyze tannin-treated wood surfaces. Each technique can be used to extract different information about the tannin impregnations. Mid-IR spectroscopy allows the detection of the tannin in the treated surfaces when the concentration of the impregnation solution is very limited (2.5%). The peak at around 1610 cm−1 is the peak that most clearly shows the presence of externally added tannins on the surface due to the aromatic chemistry of the flavonoids. The high performance of the analysis of characteristic bands in the spectra of FT-IR was not confirmed by cluster analysis. The results of a cluster analysis indicated a high spectral heterogeneity between the impregnated wood samples and wood species. However, if the concentration of tannin is high (20%), the cluster analysis was not able to classify the tannin-impregnated softwood samples correctly.
FT-Raman is also quite sensitive to tannin. After baseline correction, the aromatic peak at 1600 cm−1 and the increase in the aryl stretching peak are presented as important Raman shifts.
FT-NIR was less successful in the analysis of characteristic bands in the spectra, but it showed good sensitivity to investigate small differences of externally added tannin after cluster analysis and PLSR. These results demonstrate that a classification and estimation of tannin dry retention in various wood species are possible with fast, nondestructive measurement methods.
These findings provide a basis for further investigations of the estimation of externally added tannin content in wood. Moreover, they could serve a basis to establish guidelines for quality assurance of the tannin impregnation process and to estimate the service life performance of the tannin-impregnated wood and also aid in the transfer from laboratory to industrial conditions for consumer applications.
Footnotes
ACKNOWLEDGMENTS
We acknowledge the Austrian Science Fund (FWF) N. 1232-B16 and European Cooperation in Science and Technology–COST Action FP1006 platform for financial support for this work.