
Abstract
The fabrication and spectroscopic characterization of Ho3+ and Yb3+ co-doped phosphate glasses, also containing silver nanoparticles (SNPs), is reported. The nucleation and formation of nanoparticle structures in the samples are confirmed using transmission electron microscopy analyses. It is found that the Ho3+-Yb3+-SNP phosphate glasses exhibit an enhancement of both the resonant-absorption and the fluorescence properties when the SNP concentration is increased.
INTRODUCTION
The development of rare-earth-doped materials with defined optical properties is of interest in diverse areas, such as quantum optics and technological applications. 1 Among the most promising materials are silicate and phosphate glasses co-doped with ytterbium (Yb3+) and holmium (Ho3+). In the case of silica glasses, it has been shown that co-doping with Yb3+ and Ho3+ allows the enhancement of the Ho3+ emission because transitions near 2 μm are reachable through energy transfer from the Yb3+ ions. This attractive property has been accounted for 2 by considering that the Ho3+-Yb3+ system has a strong and broad absorption band spanning from 910 to 980 nm. Two transitions are relevant when the system is pumped with light that spectrally overlaps the 910–980 nm band: 2 F7/2 → 2 F5/2 (Yb3+) and 5 I8 → 5 I6 (Ho3+). A mechanism has been proposed † to describe the experimental observations, in particular the 2 μm and the up-conversion (UC) green emissions. The former emission is invaluable for medical applications, optical coherent tomography, and near-infrared (NIR) channels relevant for the telecom industry, whereas the latter produces undesirable power losses when the interest is the production of 2 μm radiation. 2
To avoid UC losses, an alternative is to replace silica with phosphate glass. According to Rivera-López et al., 3 phosphate groups are characterized by phonons of relatively high energy, which may increase the Nd3+ → Yb3+ energy transfer efficiency via phonon-assisted processes. In the following, we argue that the same consideration applies to the Ho3+–Yb3+ system. We start by considering the relevant Ho3+ spectrum, namely the spectrum extending up to the 5 F1 state at 22 500 cm−1. The relevance of the 5 F1 state stems from the fact that it can be reached after two 916 nm photon absorption ( 5 I8 → 5 I5 → 5 F1). By referring to the energy level scheme of the Ho3+ ion, the following spectral characteristics can be noticed: (i) two states ( 5 I6 and 5 I7) exist between the 5 I8 and 5 I5 states, and (ii) the 5 S2, 5 F4, 5 F5, and 5 I4 states lie between the 5 F1 and 5 I5 states. In the case of phonon-assisted transitions, when the energy gap between two states is larger than the maximum phonon energy in the material, the phonon cutoff energy (PCE), the emission of several phonons is required to conserve energy. Because the relaxation rate has an exponential dependence on the energy gap, 4 for a given material (i.e., for a given PCE) it decreases exponentially with the number of phonons. Thus, the decay rate via phonons is smaller for materials with smaller PCEs. This argument applies to silicate (PCE of ∼1000 cm−1) and phosphate (PCE of ∼1200 cm−1) glasses doped with Ho3+ and Yb3+. The energy gap associated to the UC transition is 18 322 cm−1. In case of phonon-assisted decay, the transition requires 18 phonons in silica glass and 15 phonons in phosphate glass. This is an explanation of why the green emission is observed in silicate glass, but is almost vanishing in phosphate glass (under pumping at 916 nm). However, this mechanism introduces a new challenge because it is necessary to increase the population of the upper Ho3+ states. In the present study, we show that this can be achieved by adding silver nanoparticles (SNPs) to the Ho3+-Yb3+ system.
It has been shown that solid-state materials containing SNPs have enhanced optical properties due to the surface plasmon resonance (SPR), which is characterized by a typical wavelength λSP5–7 The SPR effect depends on the wavelength of the incident light, the host, the metal-dielectric functions, and also the dimensions and shape of the SNPs. For instance, in the experiments reported in this article, the plasmon had a maximum around 410 nm with a tail extending up to ∼1 μm, thereafter increasing the magnitude of the Yb3+ absorption peaks. Moreover, evidence reported here shows that the SPR effect associated to the SNPs facilitates energy transfer between the Yb3+ and Ho3+ subsystems and enhances the emissive properties of the rare earths.
Analyses similar to the one presented in this study have been performed; for instance, the energy transfer process between the Yb3+ and Ho3+ ions embedded into different matrices have been considered.1,8–12 Also, several studies have established that (i) glasses doped with SNPs exhibit broadband fluorescence after excitation into the plasmon bands, (ii) SNPs positively affect the energy transfer between rare-earth ions, and (iii) in general, metallic particles play an important role in increasing the fluorescence of a rare-earth-doped material. 5
In this study, we report for the first time (to the best of our knowledge) the fabrication and characterization of Ho3+-Yb3+ co-doped phosphate glasses containing SNPs. The motivation to work with phosphate glasses stems from their ease of manufacture, their wide emission and absorption spectra compared to crystalline materials,13,14 and the fact that phosphate-glass fibers have applications in high-power lasers and telecommunications. Moreover, we show that the visible emission (via UC) is inhibited in this material but not the mid-infrared emission. Unlike in other studies, in which the SNPs were implanted and localized close to the surface (∼100 nm), 15 in our case, the SNPs are formed in situ during the manufacturing process, which resulted in a glass with SNPs located throughout its bulk. The characterization of the fabricated Ho3+-Yb3+-SNP glass samples includes an assessment of the effect of the SNPs on the absorptive and emissive properties of the samples, as well as on the Yb3+ lifetime.
EXPERIMENTAL PROCEDURES
The experiments were performed using three samples (A, B, and C) of phosphate glasses co-doped with Ho3+ and Yb3+ in equal concentrations and, in addition, co-doped with different amounts of SNPs. A sample of phosphate glass free of Ho3+ was used as reference (sample D).
The following description of the method we used to prepare the glasses is suitable to reproduce the samples. The Ho3+-Yb3+-SNP co-doped phosphate glasses were prepared using the melt-quenching technique at ambient atmosphere conditions. The chemical products were obtained (99.5–99.00% purity; Aldrich). The samples' compositions are specified in Table I; the quantities are reported in weight percentage. The reagents were melted in a porcelain crucible in air at 1050 °C for 4 h. The glasses were cut to 10 mm in diameter and 7.5 mm in thickness and then polished. Afterward, the samples were annealed at 450 °C for 2 h to produce metallic SNPs. As far as we understand, the SNPs were formed due to the thermal decomposition of silver nitrate (AgNO3) through a reaction with nitrogen dioxide (NO2) and oxygen gas (O2), 2AgNO3 → 2Ag(s) + 2NO2(g) + O2(g), where the indices s and g stand for gas and solid, respectively.
Composition of the samples (wt%). a
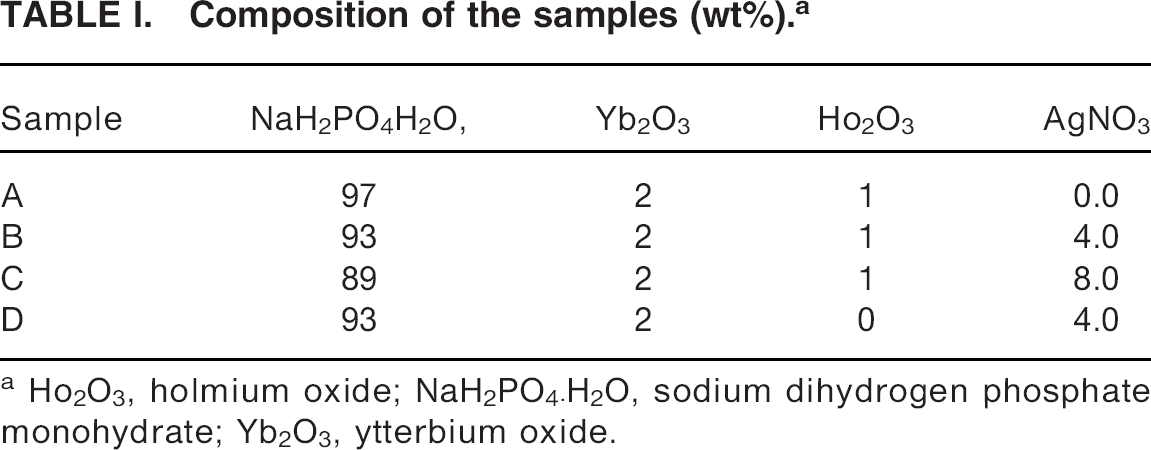
Ho2O3, holmium oxide; NaH2PO4H2O, sodium dihydrogen phosphate monohydrate; Yb2O3, ytterbium oxide.
Absorption and emission spectra, as well as the transmission electron microscopy (TEM) measurements, revealed the presence and nucleation of metallic SNPs in the glass samples. The TEM result for sample C, which had the highest SNP content, is shown in Fig. 1. The absorption spectra of the samples at room temperature were recorded between 400 and 2300 nm using a spectrophotometer (Perkin-Elmer). The result is shown in Fig. 2, in which the peaks associated to the co-dopants Yb3+ and Ho3+ and the smooth band due to the plasmon effect, produced by the presence of SNPs, are clearly revealed.
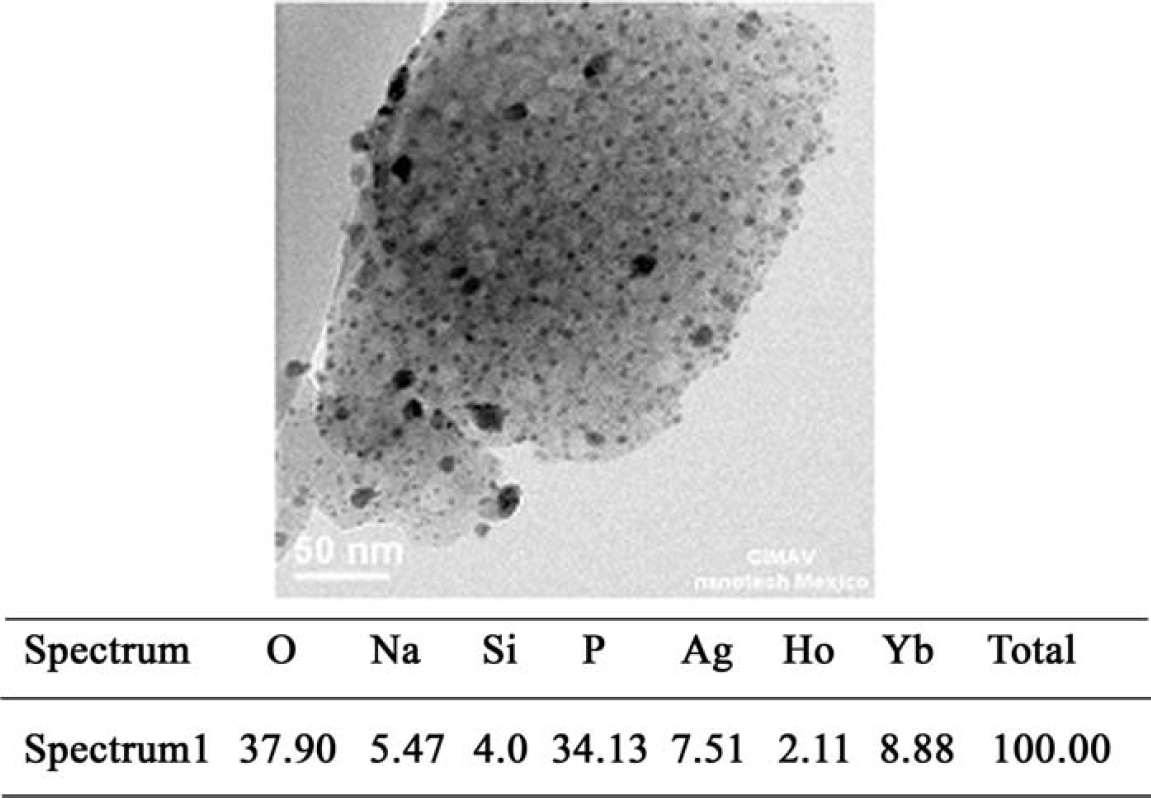
The TEM micrograph of sample C; the table at the bottom shows the elemental analysis of the sample.
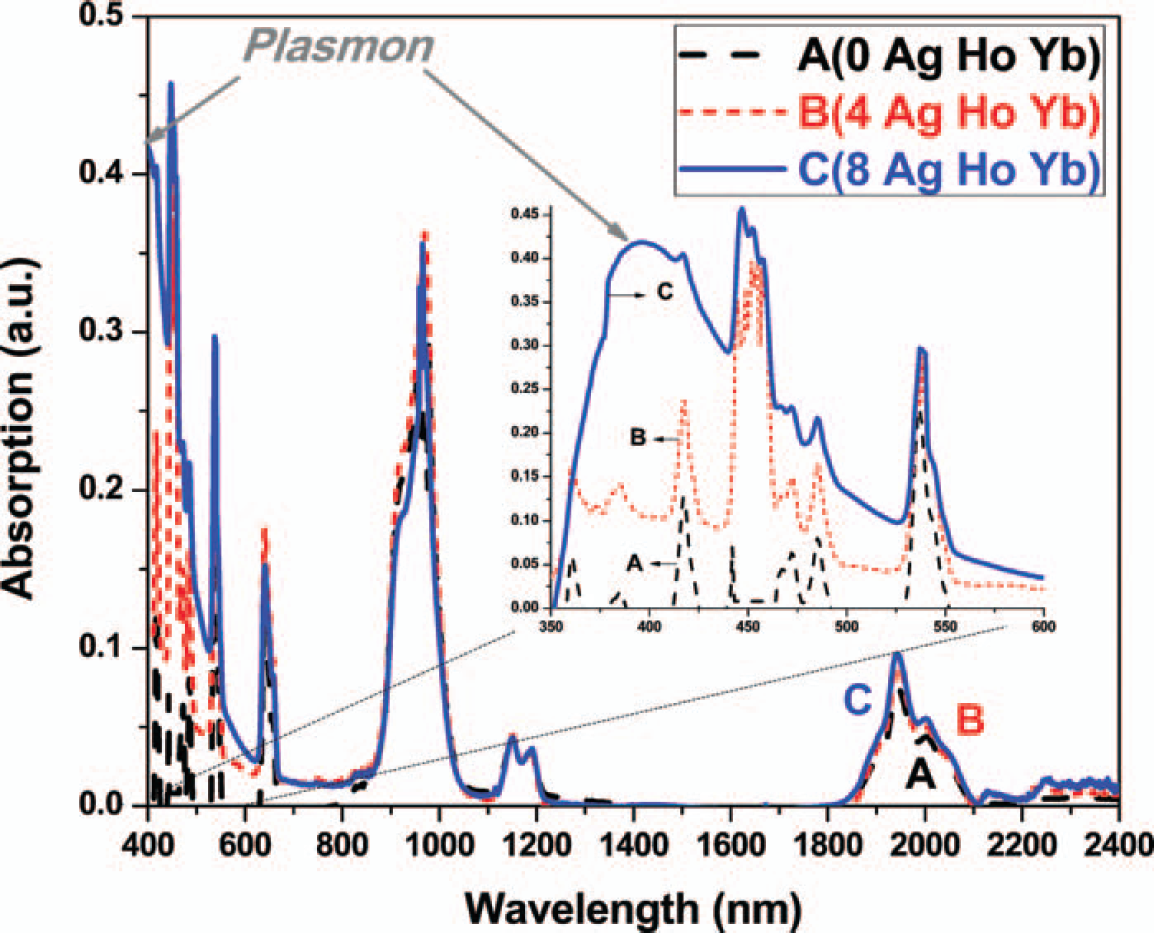
Absorption spectra of samples A (dashed line), B (short dashed line), and C (solid line); inset shows a zoom (350–600 nm) and labeling of peaks listed in Table II.
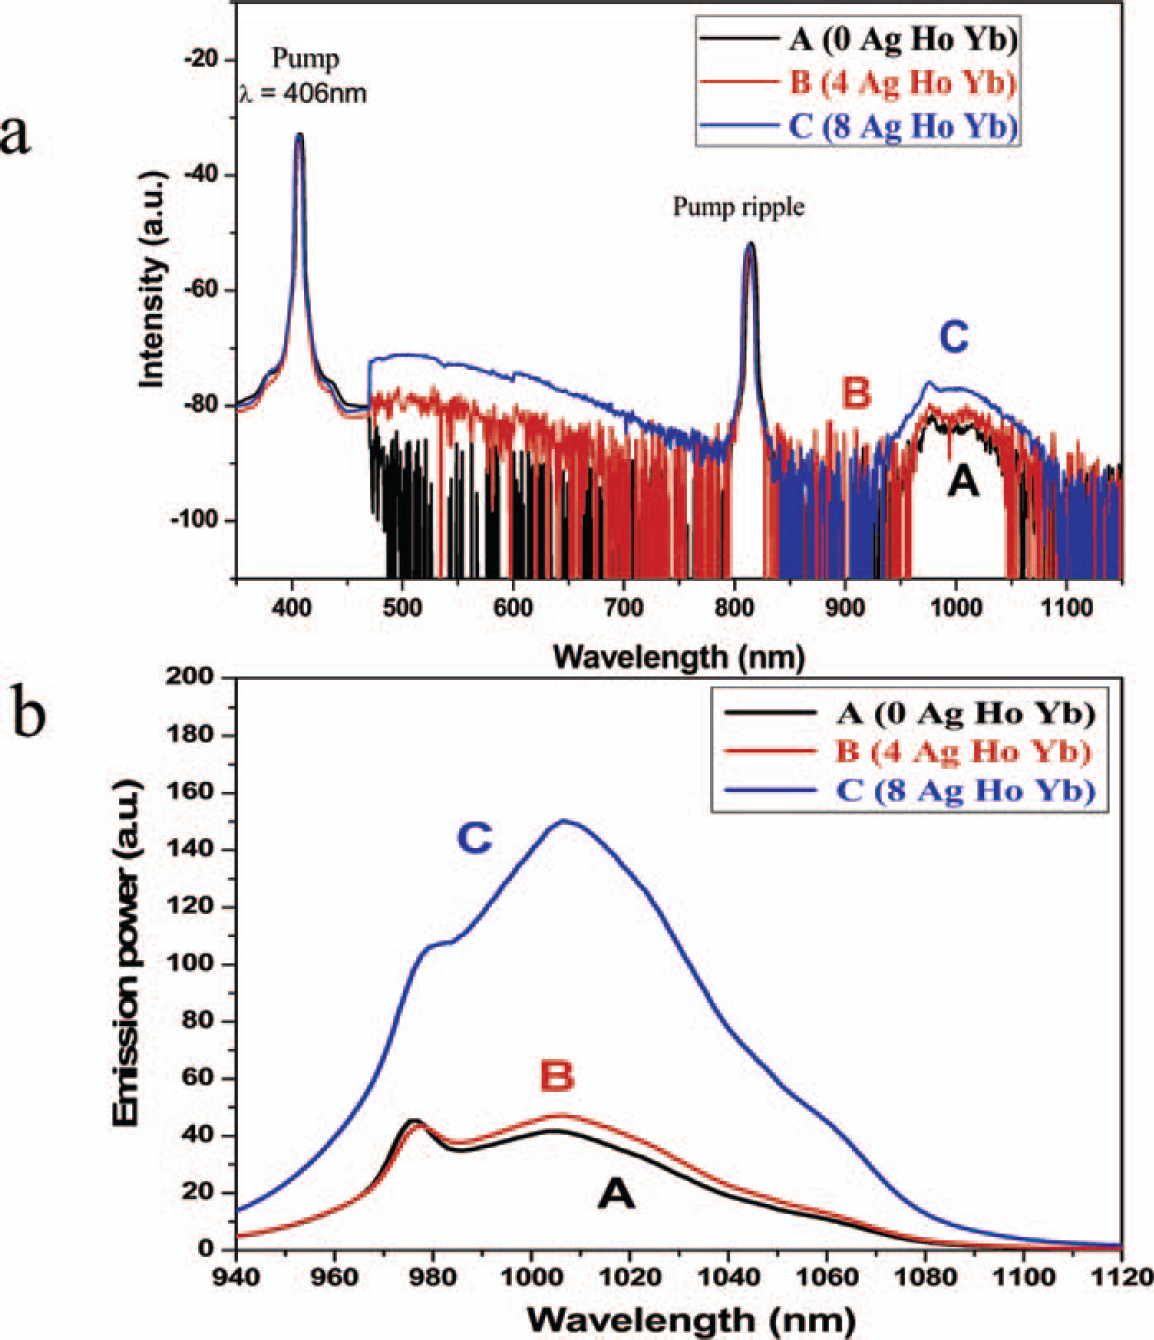
The emission spectra were measured using an AQ-6315A optical spectrum analyzer (Ando). Two different wavelengths were used to characterize the samples: (i) a 200 mW semiconductor laser (JDS Uniphase Photonics) at 916 nm, to excite the samples into the bands of Yb3+ and Ho3+ ions, and (ii) a semiconductor laser (JDS Uniphase Photonics) at 406 nm with output power of 90 mW, to excite the samples into the plasmon band of the SNPs. (Examples of the emission spectra are shown in Figs. 4–7, later in the article.)
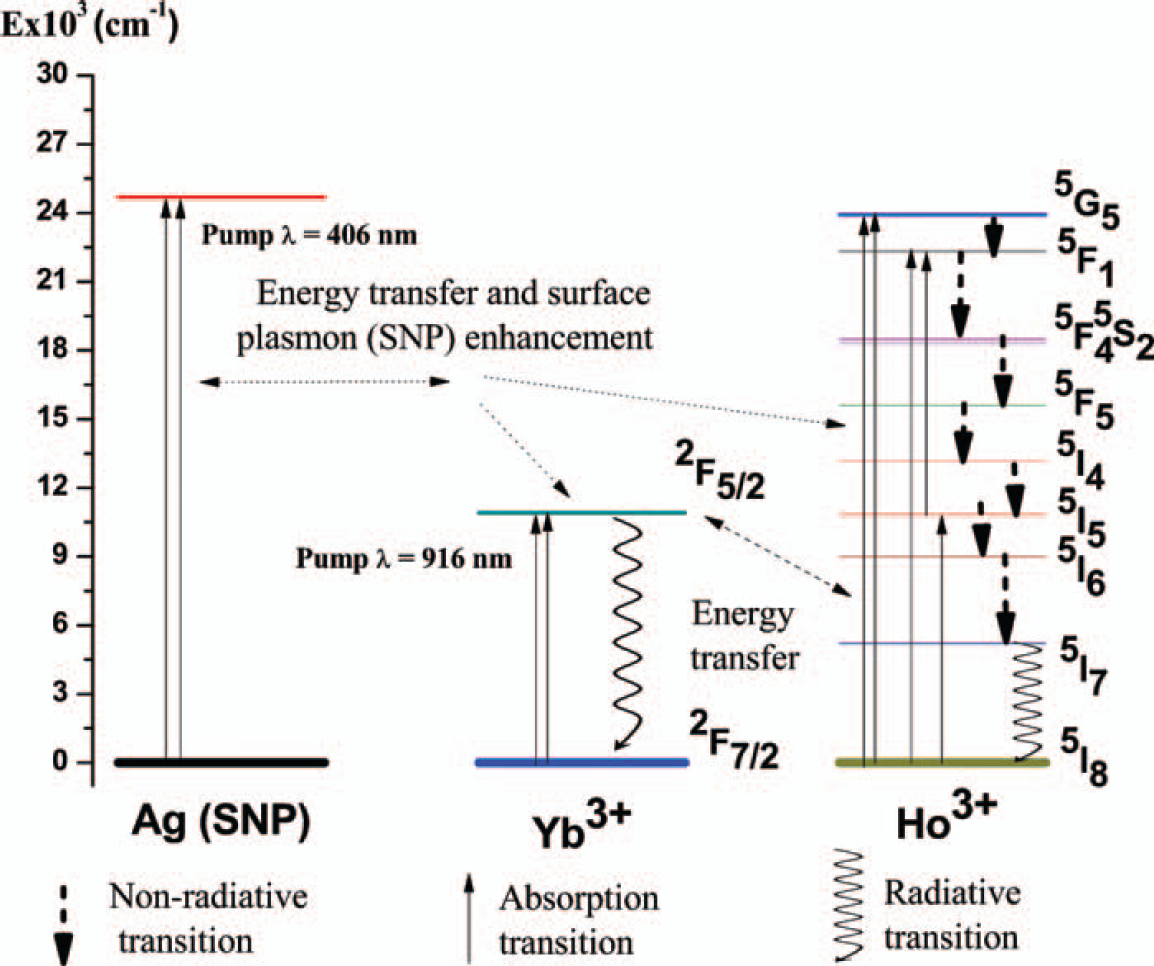
Energy-level diagram showing the Ho3+-Yb3+-SNP transitions and associated processes in co-doped phosphate glasses under excitation at λ = 916 nm and λ = 406 nm.
(
(
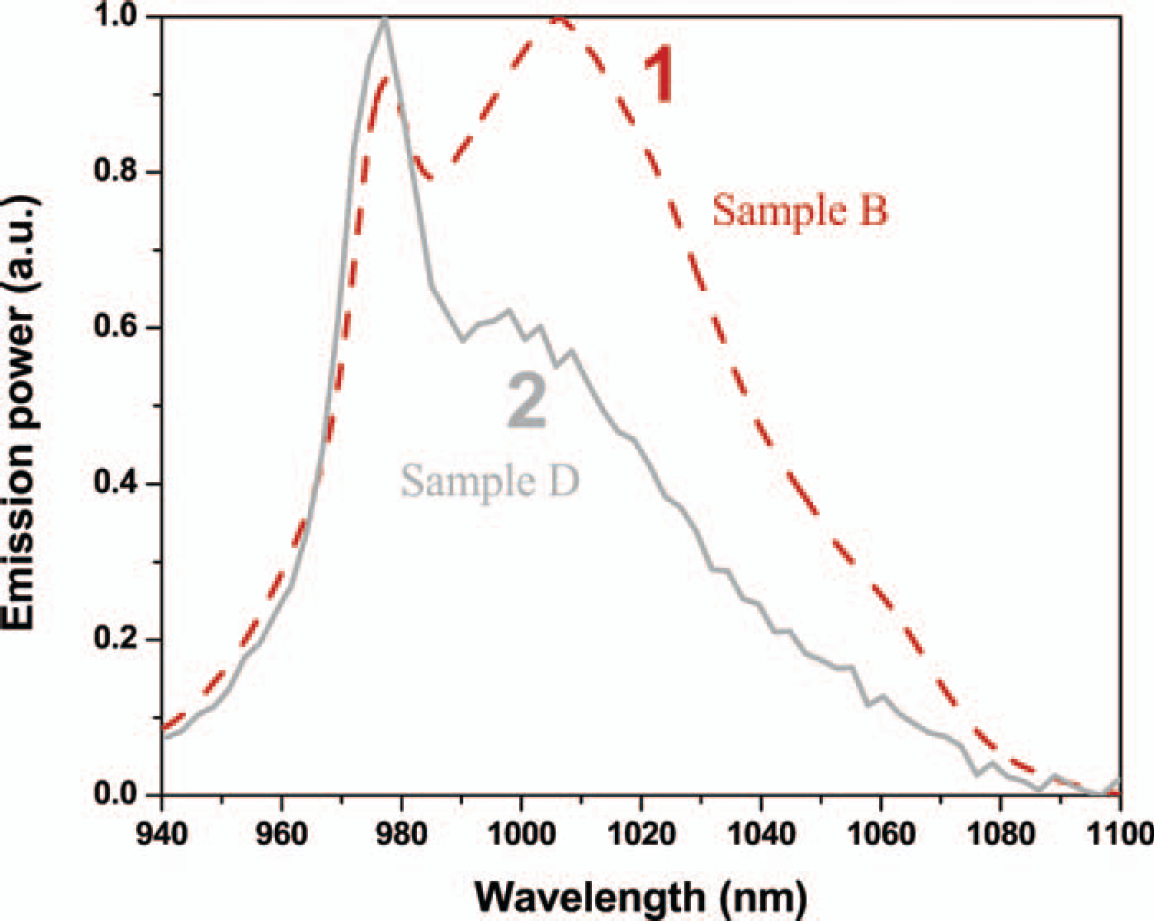
The ∼ 1 μm emission spectra of samples B (dashed line 1) and D (solid line 2), under pumping at λ = 916 nm (200 mW).
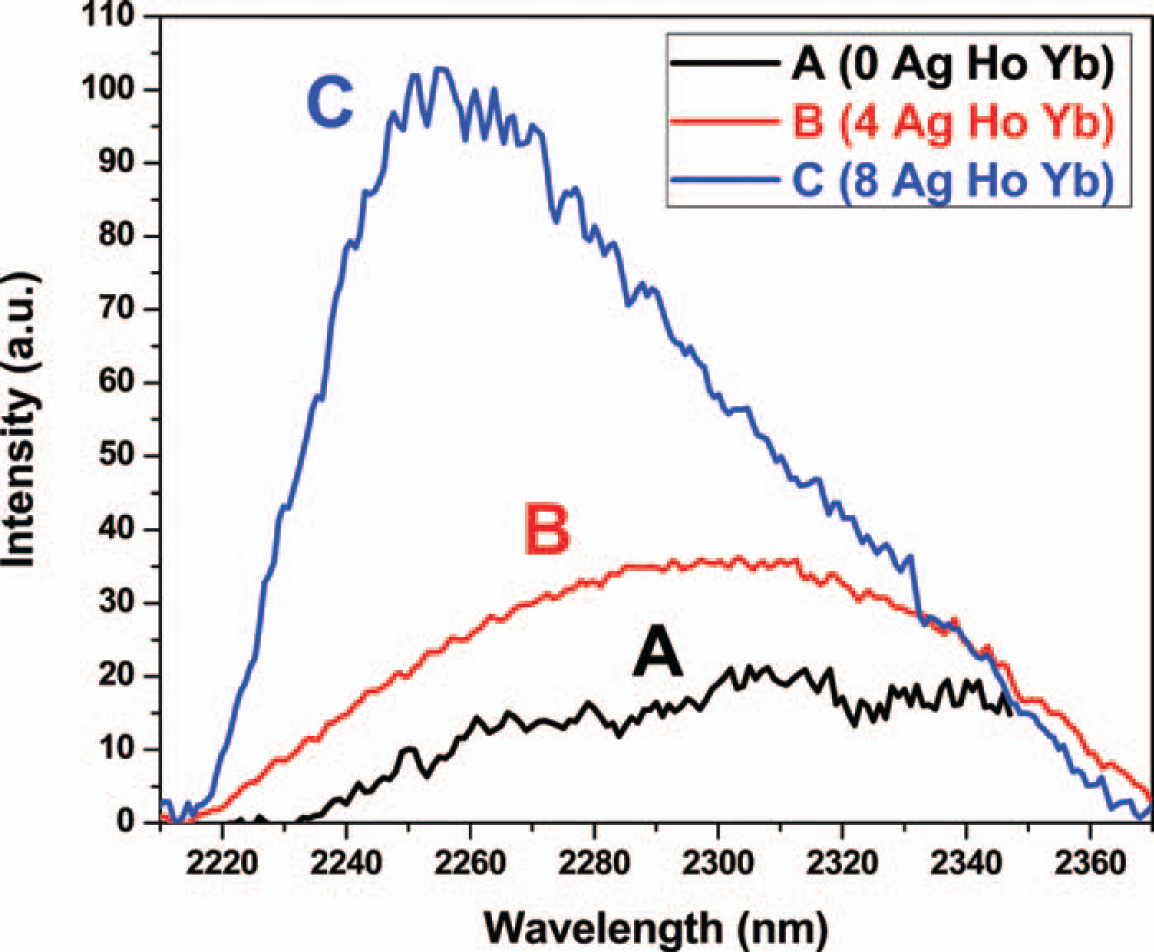
The ∼2 μm emission spectra of samples A, B, and C under pumping at λ = 916 nm (200 mW).
The fluorescence decay time was measured in a 90° geometry. In these experiments, the pump light from the 916 nm semiconductor laser was modulated to produce a square-wave signal (meander). The fluorescence was detected using a filtered photodetector and then processed using a computerized digital oscilloscope (Tektronix). Note that the detector we used is sensitive only to NIR emissions below 1.5 μm; thus, we could test the decay times corresponding to Yb3+ fluorescence (∼1 μm) but not to Ho3+ fluorescence (∼2 μm). All the lifetime measurements were carried out at room temperature.
RESULTS AND DISCUSSION
In this section we consider (i) the interpretation of the TEM results for the Yb/Ho ratio; (ii) the absorption spectra; (iii) the emission spectra under 406 nm pumping (the effects due to the presence of SNPs and the co-doping effects); (iv) the emission spectra around 1 μm under 916 nm pumping (the co-doping, re-absorption, and SNP effects, as well as the energy transfer effects due to the presence of SNPs); (v) the emission spectra beyond 2 μm, and (vi) the Yb3+ fluorescence decay kinetics.
The first aspect that deserves attention is the results of the TEM analyses. As we can see from the table in Fig. 1, from the elemental analysis of sample C the Yb/Ho ratio is ∼4.0, which is different from the ratio in the raw chemicals that were used (refer to Table I). A similar situation is encountered for sample B, in which the ratio is ∼3.6. For sample A (not containing Ag), the analyses result in an average value of the ratio close to 2, which is in agreement with the ratio of the raw chemicals used. In contrast to this ratio, measurements of the Ag content in samples A, B, and C (0.0, 3.2, and 7.5 wt%), are in reasonable agreement with the quantities used at the fabrication stage (0, 4, and 8 wt%; see Table I). The large deviation between the Yb/Ho ratios measured in samples A and B and the ratio used at the fabrication stage may indicate that an increase in the Ag (SNP) concentration leads to formation of zones where the Yb/Ho ratio deviates from its average volume value with the prevalence of Yb over Ho. This trend could be due to intrinsic properties of the glass or could stem from nonhomogeneities in the glass matrix that arose during the fabrication process. In any case, the TEM results show that the rare earths tend to cluster (agglomerate) in the presence of SNPs. Therefore, we cannot excluded that Ag (in the form of SNPs) is an agent responsible for the phenomenon. We are aware that this could affect the fluorescent properties (enhancement) of the Ho3+-Yb3+-SNP glass, which is an interesting point and deserves further detailed studies.
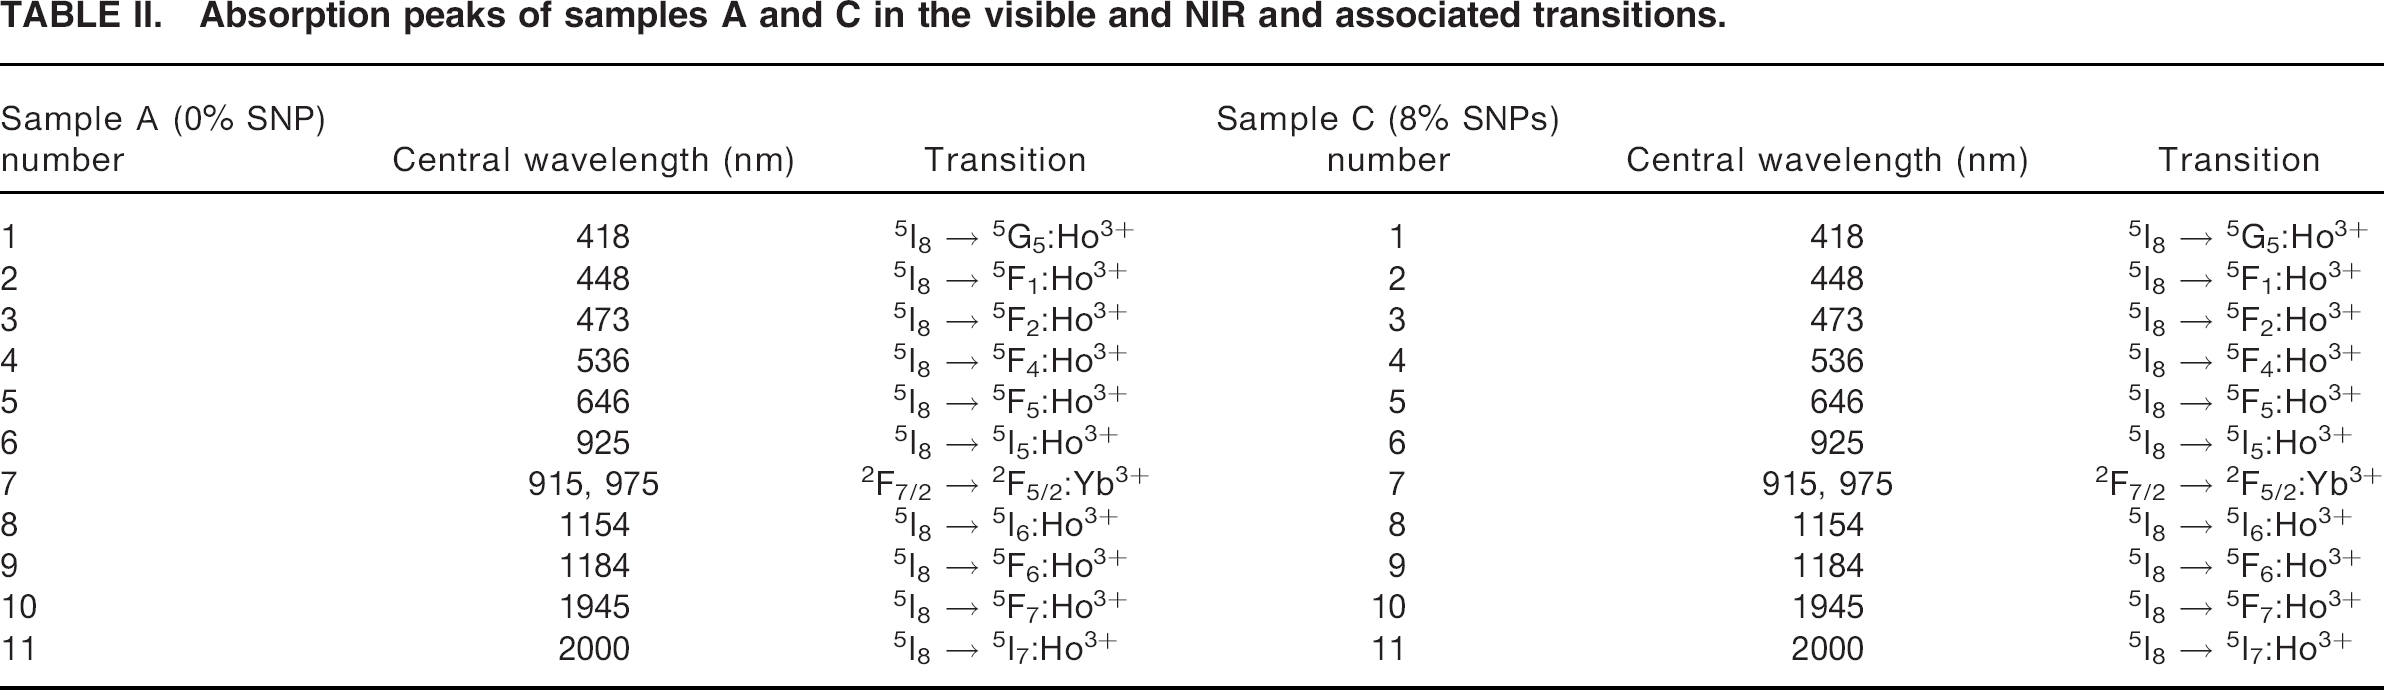
In Fig. 2 we report the absorption spectra of samples A, B, and C in the range 400–2400 nm; the absorption peaks of samples A and C (numbered from 1 to 11) are listed in Table II, including the Ho3+ and Yb3+ transitions we associate with them. (To facilitate the remaining discussion, we also include Fig. 3, in which the different transitions in the Ho3+-Yb3+-SNP phosphate glass system are schematically shown.) Curve A in Fig. 2 shows the absorption spectrum of the sample containing Ho3+ and Yb3+ but not the SNPs, whereas curves B and C show the absorption spectra of the samples containing Ho3+, Yb3+, and the SNPs (4 and 8 wt%, respectively). The prominent Ho3+ and Yb3+ peaks (see Table II) appearing over the broad plasmon band reveals strong absorption, with an increasing effect for larger values of the SNP concentration.
Absorption peaks of samples A and C in the visible and NIR and associated transitions.
In Fig. 4a, we report the fluorescence spectra of samples A, B, and C under 406 nm pumping. The difference in the results for samples A, B, and C in the 500–700 nm range is associated to the presence of SNPs, while the differences in the 950–1100 nm range can be attributed to the presence of Ho3+ and Yb3+ ions even though the spectra also reveal the central role of metallic SNPs in enhancing the 950–1100 nm fluorescence. Although a detailed description of the plasmon phenomenon involved in this effect is beyond the scope of this study, we note that the physics behind the mechanism is the collective oscillation of noble-metal valence electrons, which are resonantly excited by light, causing an enhancement of the electromagnetic field in the vicinity of the SNPs. 16 This means that Yb3+ and Ho3+ions “adsorbed” to the SNPs, or located in their vicinity, couple to a more intense field 17 than the direct excitation in a plasmon-free environment.
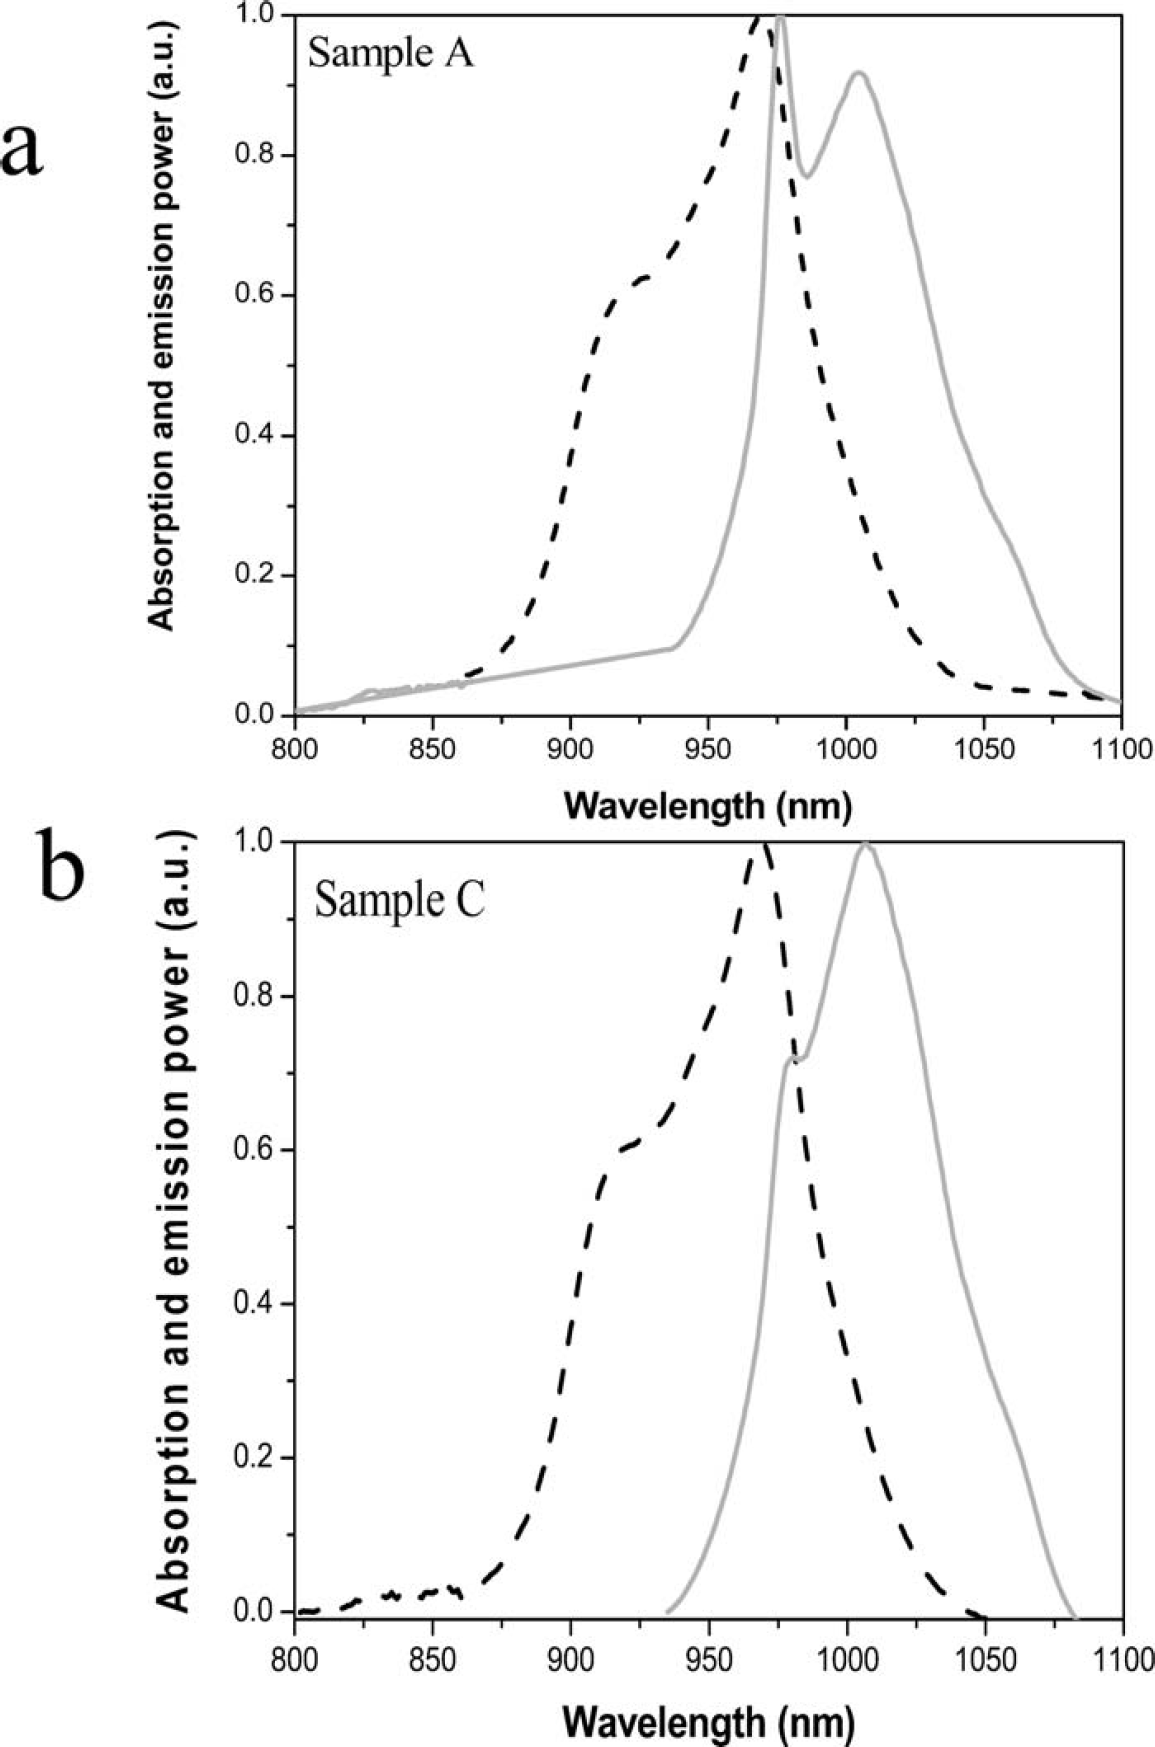
The remainder of this section contains the results obtained under pumping at 916 nm. In Fig. 4b, an intense emission band in the 940–1120 nm range is observed. The peaks appearing are associated with the 2 F5/2 → 2 F7/2 (Yb3+) transition and probably with the 5 F4 → 5 I6 (Ho3+) transition. Note the relative power magnitude of the peaks at 975 and around 1015 nm; for sample A, these peaks have a similar power, but for sample C, the peak at around 1015 is significantly enhanced. Given the strong absorption at 975 nm reported in Fig. 2, the aforementioned enhancement is interpreted in terms of re-absorption at 975 nm. This interpretation can be formulated as follows. Figures 5a and 5b show the normalized absorption and emission spectra for samples A and C correspondingly. Due to the normalization, the absorption peaks look similar, although according to Fig. 2 the absorption is larger for sample C (the sample with higher concentration of SNPs). As far as the emission is concerned, the peak at 975 nm is more prominent than the peak at ∼1015 nm for sample A, whereas the opposite is the case for sample C. These facts can be understood by ascribing them to a prominent re-absorption of 975 nm fluorescence in the samples.
Now we consider the role played by co-doping the phosphate glasses with rare earths. Curve 1 in Fig. 6 (see also Table II) shows the emission spectrum of sample B (doped with Ho3+-Yb3+-SNP), and curve 2 shows the emission spectrum of sample D (doped with only SNPs and Yb 3 +). The experimental data show that, for sample D, the emission power of the peak at 975 nm is higher than the peak at 1015 and that by adding Ho3+ (sample B) the peak at ∼1015 nm is enhanced so that it is larger than the emission peak at 975 nm.
To provide an interpretation of these experimental facts, it is convenient to recall the following observations regarding the emissive properties of Ho3+. Under pumping at 916 nm, the 5 I5 is populated, which produces the 2 μm fluorescence. The 5 I5 state can also undergo fast non-relativistic transition to the 5 I6, which decays to the 5 I8 ground state to produce the 1200 nm emission. In contrast, in our results no pronounceable emission of Ho3+ was detected in the 1.1–1.2 μm spectral range. Moreover, from Fig. 4b it is clear that an increase in the SNP concentration produces an increment in the power emission in the 990–1060 nm range. A similar trend is observed in Fig. 6, in which an increase in the emission power in the 990–1060 nm range is observed when Ho3+ is added to the sample. These experimental facts can be understood by invoking an energy transfer from Ho3+ to Yb3+, which is assisted by the SNPs.
So far, we have discussed the emission spectra around 1 μm; now let us consider the emission spectra in the 2.25–2.36 μm range (under pumping at 916 nm), which we assign to the 5 I7 → 5 I8 (Ho3+) transition. In Fig. 7, we report the data from the three samples in which an intensive emission beyond 2 μm is observed, indicating a high-efficiency energy transfer from Yb3+ to Ho3+. Moreover if we compare the emission intensity of samples A, B, and C, it points to an enhancement of the energy transfer process in the presence of SNPs. The maximum of NIR emission beyond 2 μm exhibits Stokes shift, most probably related to the re-absorption effect near by 2 to 2.2 μm.
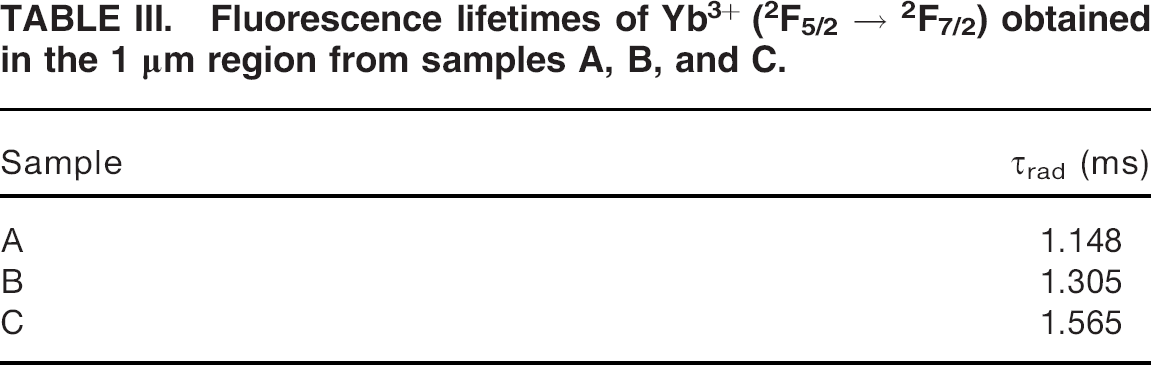
The fluorescence decay lifetime provides a further piece of information about the spectroscopic properties of the glasses. The fluorescence decay lifetime was measured at around 1 μm, and therefore, it is solely attributable to the 2 F5/2 → 2 F7/2 (Yb3+) transition. The experimental information available is the time dependence of the emission intensity (TDEI); in fact, the oscilloscope provides the average of 16 measurements of the TDEI. We found that a fit to the data using an exponential decay, where the fit quality is made in terms of the residual sum R 2 , is not good enough. In fact, for the three samples, a high-quality fit (R 2 > 0.996) is attainable using two-exponent deconvolution of the decay kinetics. One of the times obtained from the fit (order of magnitude of 1.14–1.50 ms) is attributed to the radiative lifetime (τrad) of the Yb3+ ions, whereas the other (τet), whose order of magnitude is ∼100 μs, is most likely to be related to the nonradiative process of energy transfer from Yb3+ to Ho3+, whose relevance for the system under study has been already remarked.
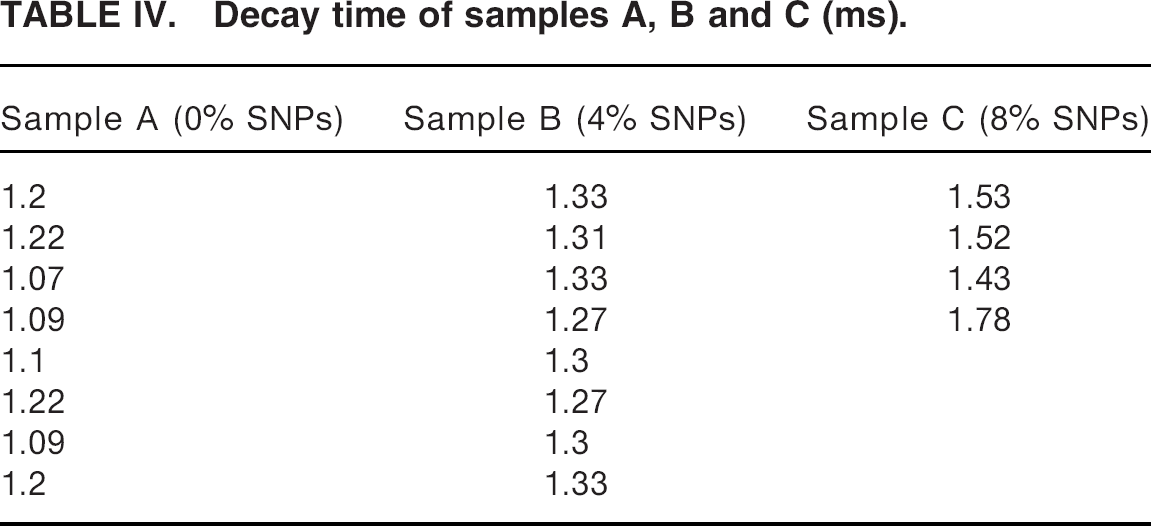
The results of the fit to the data are reported in Table III. The Yb3+ radiative lifetime τrad obtained from the three samples are different. In fact, the results seem to indicate that τrad grows as the SNP concentration increases. To provide further support for this statement, we performed an analysis of variance (ANOVA)18–20 to investigate the SNP-concentration effects on the decay time. The result of the analysis is that the lifetimes of samples A, B, and C are different at the 99% confidence level. Details of the ANOVA are reported in the Appendix and in Tables IV and V.
Decay time of samples A, B and C (ms).
Details of the ANOVA calculations. a
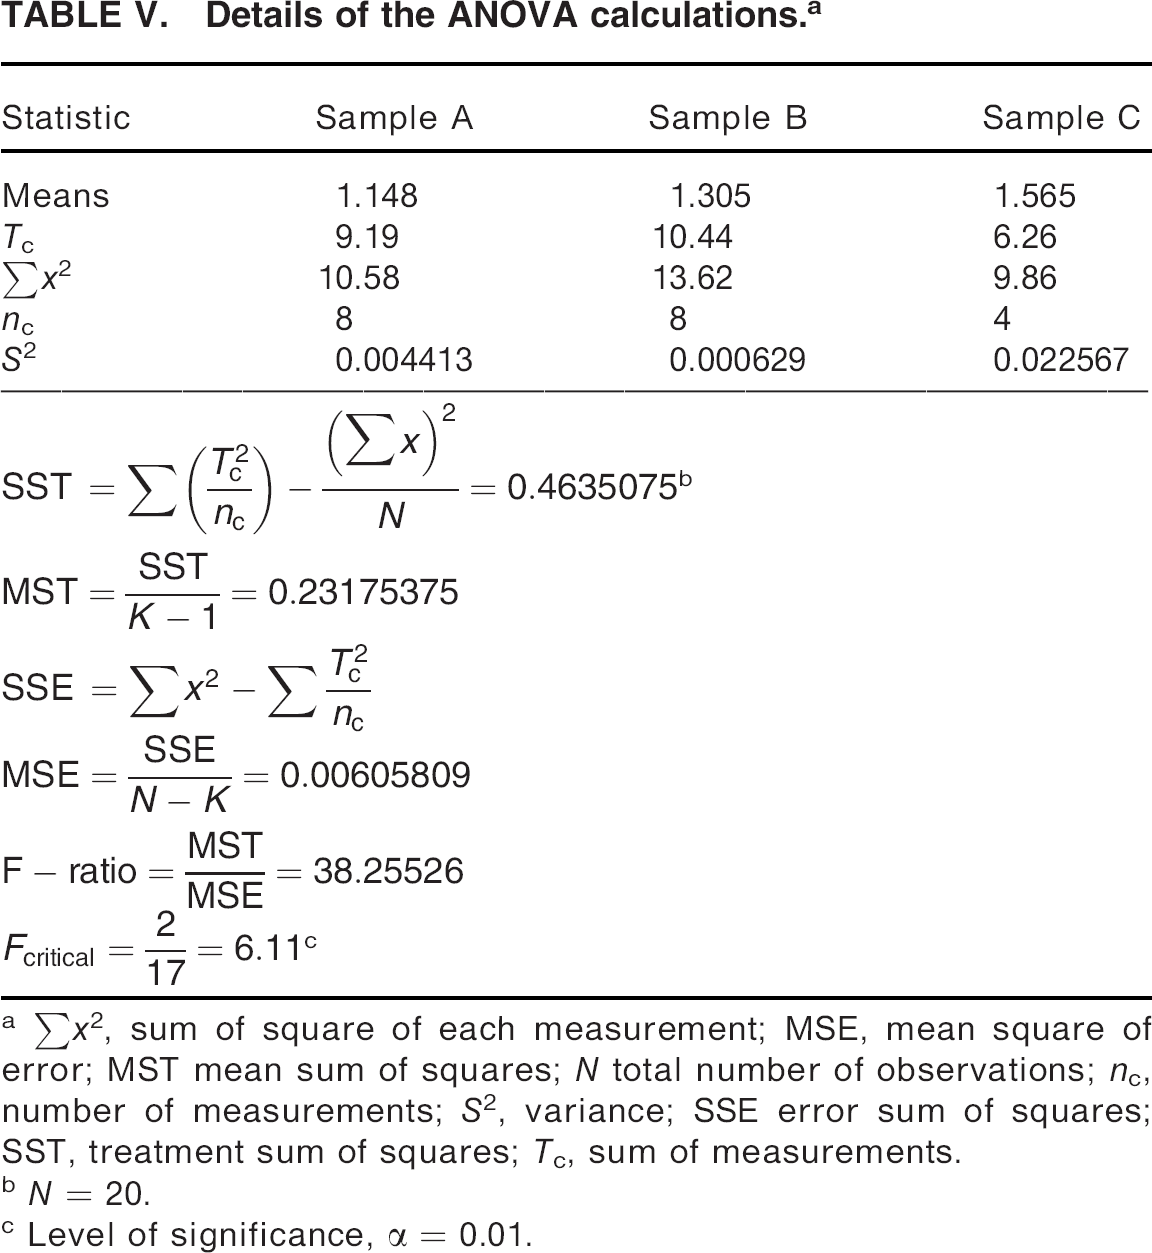
Σx 2 , sum of square of each measurement; MSE, mean square of error; MST mean sum of squares; N total number of observations; nc, number of measurements; S 2 , variance; SSE error sum of squares; SST, treatment sum of squares; Tc, sum of measurements.
N = 20.
Level of significance, α = 0.01.
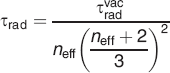
Note that the growth of τrad with increasing the SNP content is consistent with the lifetime dependence on the effective refractive index (neff) of the medium, and τvacrad is the Yb3+ radiative lifetime in a vacuum 21
We measured the refractive index of the three samples using a Model 2010/M Prism Coupler (Metricon), 22 and our results indicate that neff diminishes as the SNP concentration increases, which is in agreement with the results reported in Table III. Unfortunately, we did not have at our disposal a detector sensitive to 2 μm to enable the measurement of the Ho3+ fluorescence lifetime.
SUMMARY AND CONCLUSION
We have manufactured phosphate glasses co-doped with Yb3+ and Ho3+ ions, as well as those containing silver nanoparticles (SNPs) located in the bulk. The characterization of these samples led us to the following experimental results: (i) The absorption spectra show the band is centered at 410 nm, (ii) the increase in the SNP concentration produces an enhancement of the fluorescence around the 1 and 2 μm bands, (iii) neither the green UC emission nor the typical emission of the Ho3+ ions at ∼1.2 μm is observed, and (iv) a trend of the lifetime of the metastable 2 F5/2 manifold (Yb3+) grows when the SNP concentration is increased is observed.
Different experimental conditions were used to provide evidence for the interpretation of the data. Thus, in addition to using samples with Yb3+ and Ho3+ and different SNP concentrations, we used a sample with Yb3+ and SNPs but without Ho3+; moreover, we examined the same glass under pumping at λ = 916 nm (within the rare-earth resonant band) and at λ = 406 nm (within the plasmon band). We conclude that the experimental facts can be understood in terms of (i) the SNP plasmon resonance (the enhancement of the electromagnetic field in the vicinity of SNPs 16 and the fact that Yb3+ and Ho3+ ions couple to form a more intense field than the excitation in a plasmon-free environment 17 ), and (ii) co-doping and the two related effects, the re-absorption at 975 nm, and the energy-transfer process between the rare earths, assisted by the SNPs.
Footnotes
†
ACKNOWLEDGMENTS
The authors acknowledge CIMAV (Laboratorio Nacional de Nanotecnologia, Chihuahua, Chih., Mexico) for providing TEM analyses of the samples. One of co-authors, JLLM, acknowledges financial support from CONACyT under Contract #136186.
APPENDIX
In Tables IV and V, we provide the results of the lifetime measurements for the three samples inspected. From the set of data, we calculated the mean square of treatments (MST) and the mean square of error (MSE); details of the calculations are reported in Table V. The number of groups or treatments is K = 3, and the total number of observations is N = 20. For the analysis, we considered α = 0.01 and found that the probability that the F ratio (= MST/MSE) we obtained occurs by chance is vanishingly small.