
Abstract
This paper describes an instrument capable of studying diffuse reflection of mid-infrared (mid-IR) photons on ultrafast time scales. Femtosecond mid-IR pulses are generated by difference frequency mixing the output of an optical parametric amplifier that is pumped using a regeneratively amplified Ti:Sapphire laser. Time resolution is achieved by up-converting the diffusely reflected photons with pulses from the Ti:Sapphire oscillator. Experiments were performed on a series of powdered KBr samples containing varying amounts of carbon black. The results suggest that diffusely reflected mid-IR photons fall into two distinct categories. A small fraction of the photons travel relatively long effective path lengths (1.3–2.3 mm), while the majority traverse a much shorter distance (0.2–0.05 mm).
INTRODUCTION
Diffuse reflection (DR) occurs when light penetrates a translucent scattering solid (e.g., a powder comprised of a finely ground crystalline material) and is reemitted after undergoing multiple instances of reflection and refraction.1,2 A schematic of this process is shown in Fig. 1. As a result of repeated cycles of transmission/reflection, photons can travel long distances through powdered samples. As they do so, they interact with multiple particles as well as the same particles multiple times. As a consequence of these multiple interactions, the net absorption of a weakly absorbing analyte, or one that is present at low concentration in a transparent matrix, can be increased many-fold. Indeed, DR spectrometry is a well-known sampling technique in mid-infrared (mid-IR) and near-IR spectroscopy.1,2 Despite its significance, little is known about the underlying mechanism—particularly mid-infrared DR.
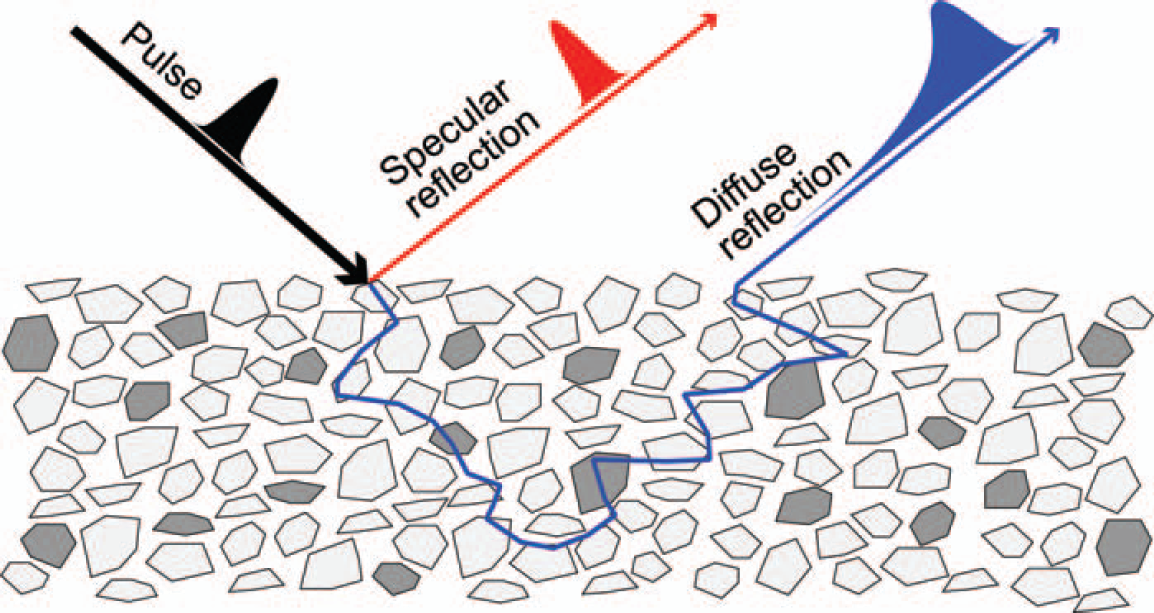
An illustration of diffuse reflection. A short laser pulse (shown in black) is incident on a sample comprised of a translucent powder (light gray shapes), which could have trace amounts of an absorbing species present (dark gray shapes). Specular reflection (shown in red) occurs when the light simply reflects off of the initial surface. In this case, the pulse is left relatively unchanged. However, some of the light enters the sample and undergoes multiple instances of reflection and refraction before being reemitted from the sample. This is diffuse reflection (shown in blue). The pulse is broadened in time because of the longer path length.
An important parameter in DR is the effective path length that the photons travel; the longer the path length, the greater the sensitivity to trace analytes. The first study to determine the effective path length of diffusely reflected IR photons was done by Averett and Griffiths. 3 They studied the concentration-dependent DR spectrum of low concentrations of caffeine dispersed in KBr. Using an extension of Beer's law, they indirectly determined that the average path length in pure KBr was ∼4 mm and that it decreased as the concentration of the caffeine was increased. Since the photons have to travel into and then out of the sample, this seemed to suggest that the average penetration depth was ∼2 mm. However, they showed that the ∼4 mm overall path was actually highly random and that the actual penetration depth was less than 0.5 mm.
A direct determination of the effective path length requires a time-resolved approach.4–9 By measuring the time for photons to traverse the sample, it is straightforward to determine the distance they traveled. However, time-resolved techniques are complicated and can pose unique challenges. This is especially true for mid-IR spectroscopy, where the detectors tend to be quite slow and not as sensitive as their visible and near-IR counterparts. This paper describes an experimental setup designed to mitigate these issues. Time resolution is achieved by “up-converting” the diffusely reflected light with a short laser pulse that acts as a gate. Up-conversion is an optical timing technique that circumvents the otherwise slow electronic circuitry of mid-IR detectors. 10 Moreover, the up-converted signal lies in the visible region of the spectrum where sensitive photomultiplier tubes or charge-coupled devices can be used.
EXPERIMENTAL
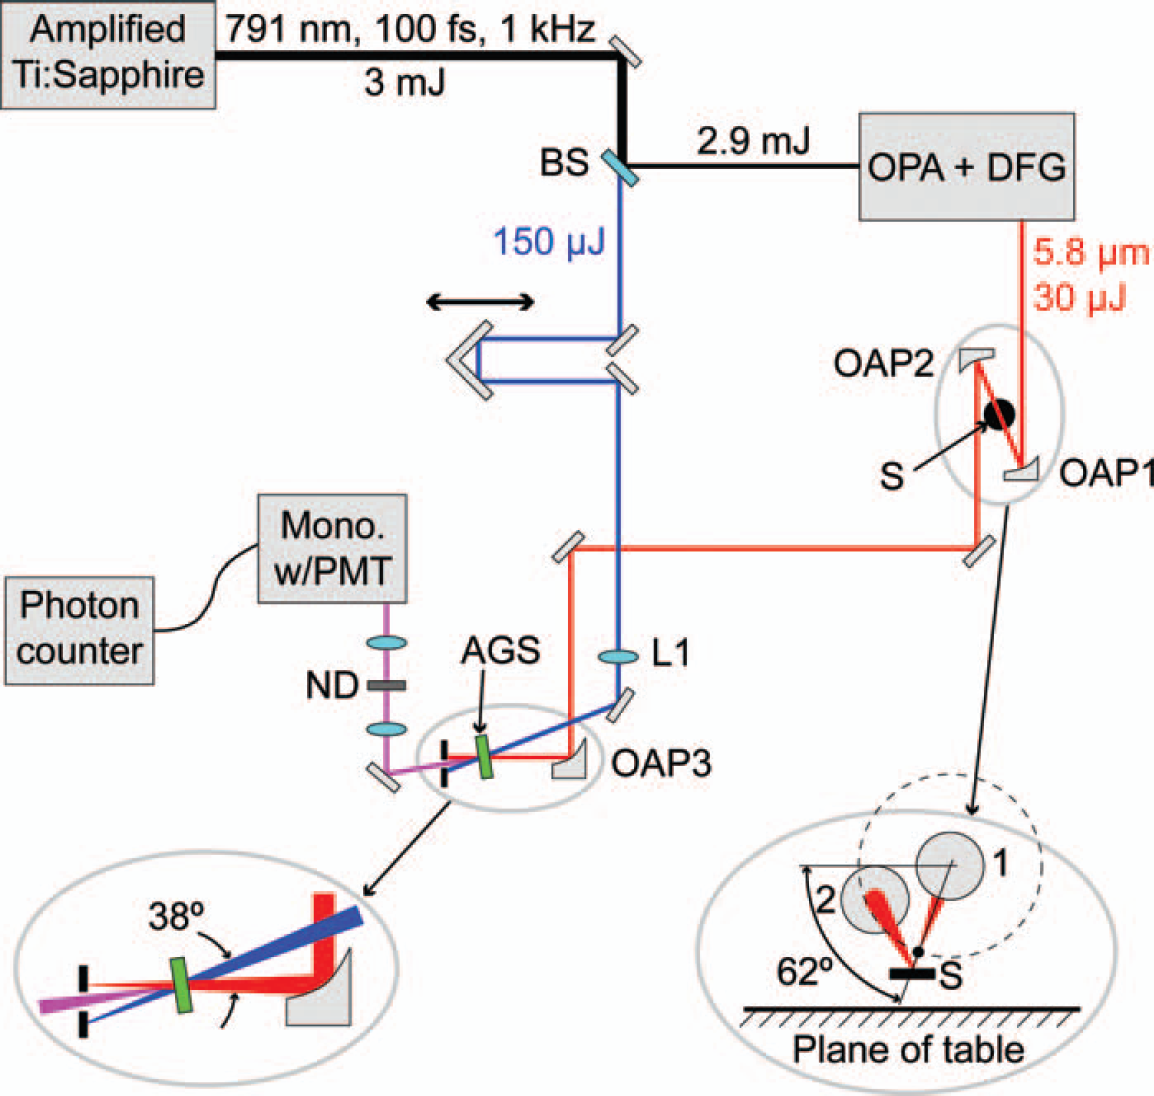
Schematic of the instrument. See text for details.
The sum frequency is collected and focused into a 1/4 m monochromator (Newport) with a 150 lines/mm grating blazed at 4 μm. The monochromator slits were set at ∼1 mm, corresponding to a large bandpass of ∼50 nm. In this capacity, the purpose of the monochromator was to filter out stray and ambient room light rather than to spectrally resolve the signal. The signal is detected using a photon-counting PMT (Hamamatsu, H8259-02) and digitized using a photon counter (Stanford Research Systems, SR400). The entire experimental setup is coordinated and controlled using a LabVIEW program written in-house.
To perform an experiment, a sample is placed in a shallow (∼5 mm depth) saucer-like (∼25 mm diameter) cup. In order to prepare a flat, uniform surface with minimal packing, the cups were slightly under-filled and covered with a small piece of glass (an old 2 in glass optical filter works well). The glass and cup were turned on end and lightly tapped one time. After returning them to the upright position, the glass was removed and the sample was carefully placed in the spectrometer.
Because of the inhomogeneous nature of the powdered samples, there can be considerable variation in signal intensities. Even a single sample, if removed from the spectrometer and then put back, will show very different intensities. Consequently, a quantitative comparison between samples is not possible. However, repeated experiments show that the temporal profiles are reproducible. This suggests that the optical properties of scattering samples could be estimated using a time-resolved approach rather than an intensity-based approach.
An instrument response function was collected by using a mirror in place of the sample. In this context, the mirror is a “sample” that undergoes no diffuse reflection, and the resulting signal is just the cross correlation between the IR and gate pulses. Each scan was fit by convolving the instrument response with a bi-exponential function, y = a1e−t/τ1 + a2e−t/τ2. The best fit was obtained using an iterative re-convolution algorithm. 11 It is important to emphasize that the data are normalized prior to fitting and that a1 and a2 in the bi-exponential equation are relative amplitudes.
The motivation for using a bi-exponential model to fit the data warrants a brief discussion. In the visible and near-IR spectral regions (and on slower time scales), diffuse reflection is typically modeled using the diffusion equation.12–14 All attempts to fit the data in this paper to the diffusion equation failed. This suggests that mid-IR diffuse reflection may not actually be diffusive in nature. In contrast to the diffusion equation, the agreement between the bi-exponential model and the data was excellent. While the bi-exponential model may not provide the same level of physical insight as the diffusion equation, it does provide a quantitative means to describe the data and identify characteristic features.
There is an inherent ambiguity in defining the speed of light for these experiments since the photons travel through air (n = 1) as well as the KBr matrix (n = 1.5). For this reason, we have opted to use the average of the two speeds, cavg = 0.25 mm/ps, in all calculations requiring conversion between time and distance.
RESULTS AND DISCUSSION
Figure 3 shows the time-resolved data (circles) along with the best-fit curves (solid red lines). Two conclusions are immediately evident from the raw data: (1) the temporal profiles are clearly bi-exponential and (2) the fast component is dominant. The results of the bi-exponential fits are summarized in Fig. 4. Both time constants decrease linearly with increasing concentration of carbon black. The fast time constant (τ1) ranges from ∼0.7 ps for pure KBr to ∼0.2 ps for KBr with 0.048% carbon black. Similarly, the slow time constant (τ2) ranges from ∼9 ps for pure KBr to ∼5.5 ps for KBr with 0.048% carbon black.
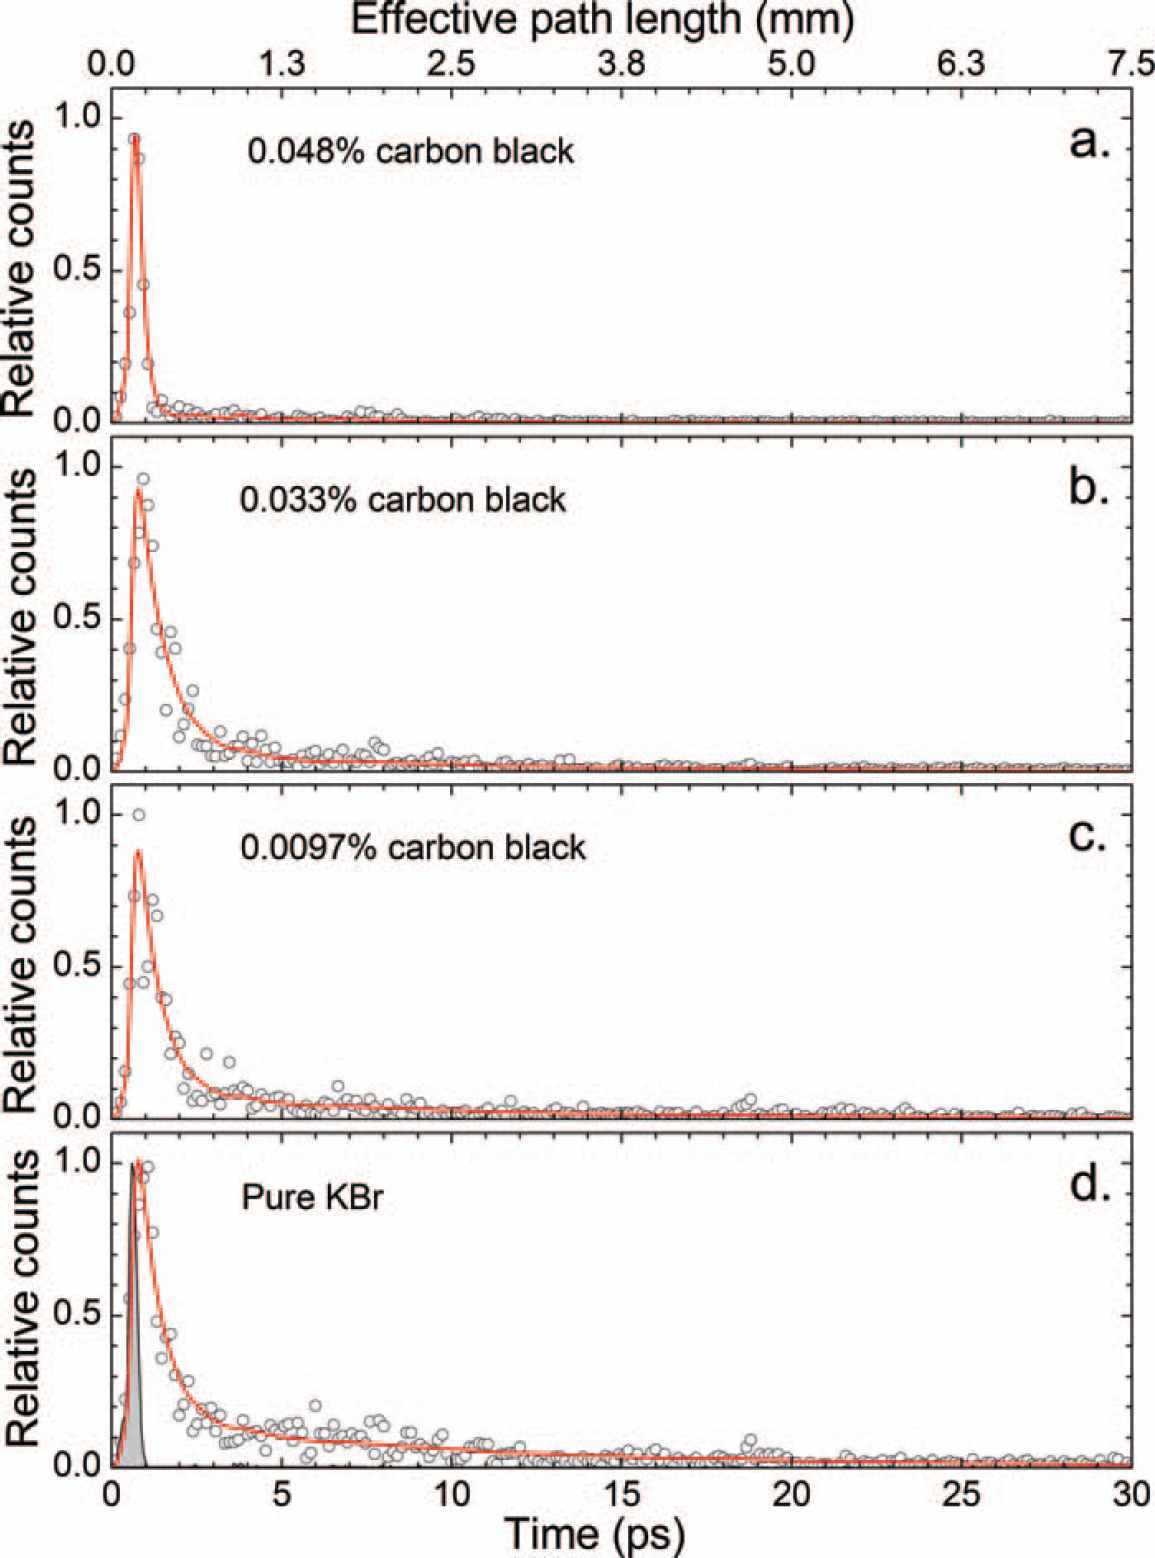
Time-resolved data (circles) with bi-exponential fits (red curves). The gray shaded curve in the lower graph is the instrument response function. Plots (
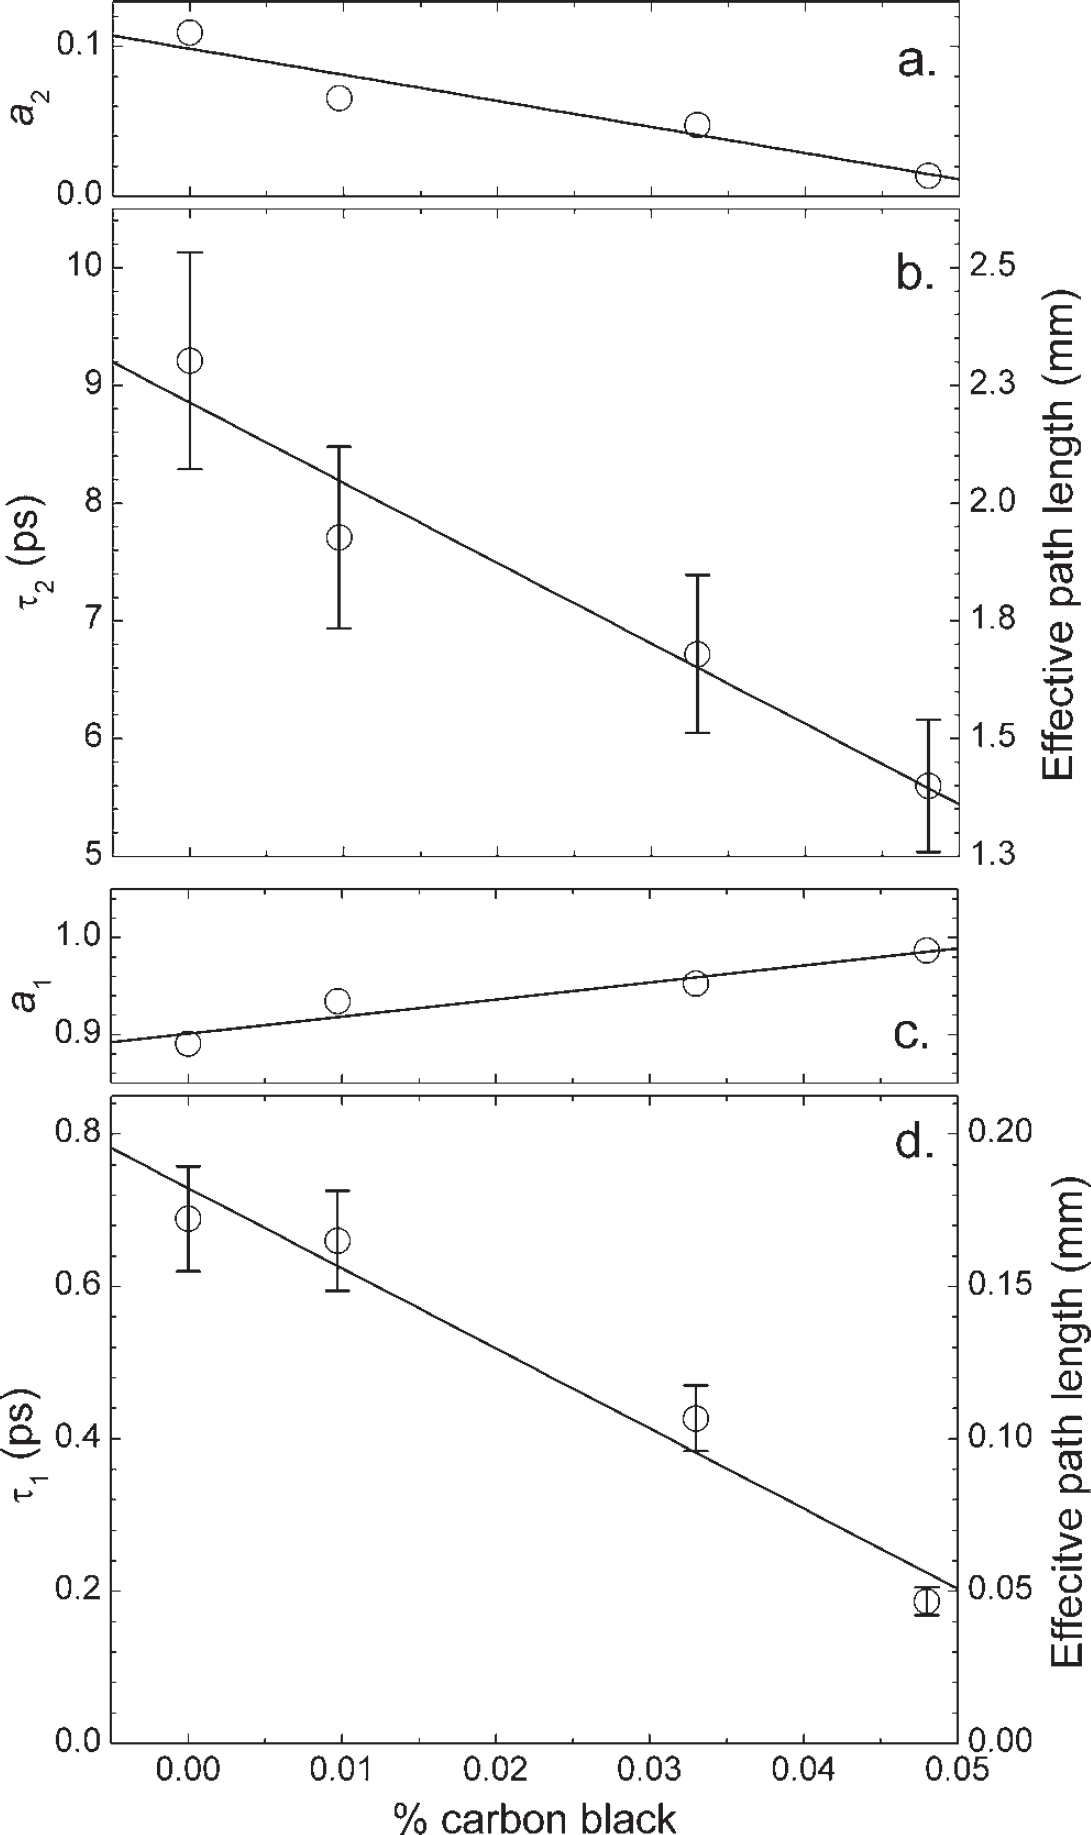
Parameters from the bi-exponential fits. The slow time constant τ2 and its amplitude a2 are shown in plots (
However, the amplitudes behave very differently. While both vary linearly with increasing concentration of carbon black, the amplitude for the fast phase (a1) increases while the amplitude for the slow phase (a2) decreases. Moreover, a1 accounts for ∼90% of the total decay for pure KBr and increases to nearly 100% for KBr with 0.048% carbon black. In contrast, a2 accounts for only ∼10% of the decay for pure KBr but almost disappears entirely for KBr with 0.048% carbon black.
Also shown on Fig. 4 (using the right ordinate axes) are the corresponding effective path lengths for each phase. The slow phase corresponds to longer path lengths ranging from ∼1.3 to 2.3 mm while the effective path lengths of the fast phase are about an order of magnitude shorter (∼0.2–0.05 mm). However, because of the dominance of the fast phase, the overall mean effective path length (calculated using the mean time constant a1τ1 + a2τ2) is skewed toward the shorter range. What these results seem to suggest is that there are two characteristic “classes” of diffusely reflected mid-IR photons. The majority traverse relatively short distances corresponding to shallow penetration and/or less randomized motion. On the other hand, a smaller fraction (<10%) become trapped and travel longer distances, which could mean deeper penetration and/or a more random path. These two classes of photons are analogous to the so-called “ballistic” and “diffusive” photons that are typically observed in visible and near-IR diffuse reflection.15,16 However, given the potentially non-diffusive behavior of mid-IR photons on ultrafast time scales, this language is specifically avoided in this work.
CONCLUSION
This paper describes an instrument capable of studying mid-IR diffuse reflection on ultrafast time scales. Fast time resolution is achieved by up-converting the diffusely reflected mid-IR photons with an ultrafast gate pulse. The up-converted signal lies in the visible region of the spectrum so that a sensitive photomultiplier can be used for detection.
Experiments on powdered KBr samples containing varying amounts of carbon black were performed. In addition to demonstrating the instrument's capability, the results of these experiments provide new insight into the underlying mechanism of mid-IR diffuse reflection. In particular, the results suggest that diffusely reflected mid-IR photons fall into two distinct categories. The majority (>90%) of the diffusely reflected photons follow relatively short paths (∼0.1 mm), while the fraction that remains gets trapped in the matrix and traverses longer distances (∼2 mm). This bimodal character could only have been identified using a time-resolved approach.
Footnotes
ACKNOWLEGMENTS
This work was supported by the National Science Foundation under Grant No. CHE-0923583. The author would also like to thank Professor Peter R. Griffiths for his indispensible insight.