
Abstract
Visible near-infrared (Vis-NIR) reflection spectroscopy and mid-infrared (mid-IR) reflection spectroscopy are cost- and time-effective and environmentally friendly techniques that could be alternatives to conventional soil analysis methods. Successful determination of spectrally active soil components, including soil organic matter (SOM), depends on the selection of suitable pretreatment and multivariate calibration techniques. The objective of the present review is to critically examine the suitability of Vis-NIR (350–2500 nm) and mid-IR (4000–400 cm−1) spectroscopy as a tool for SOM quantity and quality determination. Particular attention is paid to different pretreatment and calibration procedures and methods, and their ability to predict SOM content from Vis-NIR and mid-IR data is discussed. We then review the most recent research using spectroscopy in different calibration scales (local, regional, or global). Finally, accuracy and robustness, as well as uncertainty in Vis-NIR and mid-IR spectroscopy, are considered. We conclude that spectroscopy, especially the mid-IR technique in association with Savitzky–Golay smoothing and derivatization and the least squares support vector machine (LS-SVM) algorithm, can be useful in determining SOM quantity and quality. Future research conducted for the standardization of protocols and soil conditions will allow more accurate and reliable results on a global and international scale.
Keywords
INTRODUCTION
Soil is a major natural resource for the production of food and energy. Soil controls the movement of water in the landscape, working as a natural filter for metals and other contaminants that may leach into ecologically sensitive spheres of the environment. 1 Soil is also known as a potential sink for carbon to mitigate climate change. The ability of soil to manage any of these functions depends on its structure; composition; and chemical, biological and physical characteristics— all of which are spatially and temporally variable.2,3
Soil quality is the capacity of a specific kind of soil to function, within natural or managed ecosystem boundaries, to sustain plant and animal productivity, maintain or enhance water and air quality, and support human health and habitation. 3 Soil organic matter (SOM) is a useful indicator of soil fertility as well as soil quality and is an essential factor in controlling the soil dynamics of various agrochemicals; SOM is, therefore, one of the most important parameters of agricultural soil.4–6 It includes residual components of original organic tissues, their degradation products, and products synthesized by soil fauna. Two major types of compounds are distinguished: (i) nonhumic substances, belonging to identifiable chemical classes such as carbohydrates, and (ii) humic substances, a series of brown to dark-brown, high-molecular weight biopolymers distinctive to soil environments. It influences soil properties such as nutrient sorption, hazardous-substance binding, water retention, biological activity, and structure formation and stability. SOM also plays a significant role in ecosystem management with respect to biosphere–atmosphere carbon circulation and climate change. Thus, knowing the variation of the concentration of SOM across space may help the understanding of carbon fluxes and exchange, carbon storage, and soil nutrients management.7,8 On the other hand, SOM tends to decrease particularly in agricultural soils by climate, texture, soil hydrology (drainage), land use (tillage), and vegetation. 9 Its decline is listed among the threats to soils in the “Thematic Strategy for Soil Protection” of the Commission of the European Communities (COM/2006/231) and the “Proposal for a Directive of the European Parliament and of the Council Establishing a Framework for the Protection of Soil and Amending Directive 2004/35/EC,” a document prepared by the Commission of the European Communities (COM/2006/0232). Given the importance of SOM, there is a need for regular monitoring to detect changes in content and quality, or its ability to maintain its purpose over time. The visual effect of organic matter (OM) content on soil color can be seen in Fig. 1.
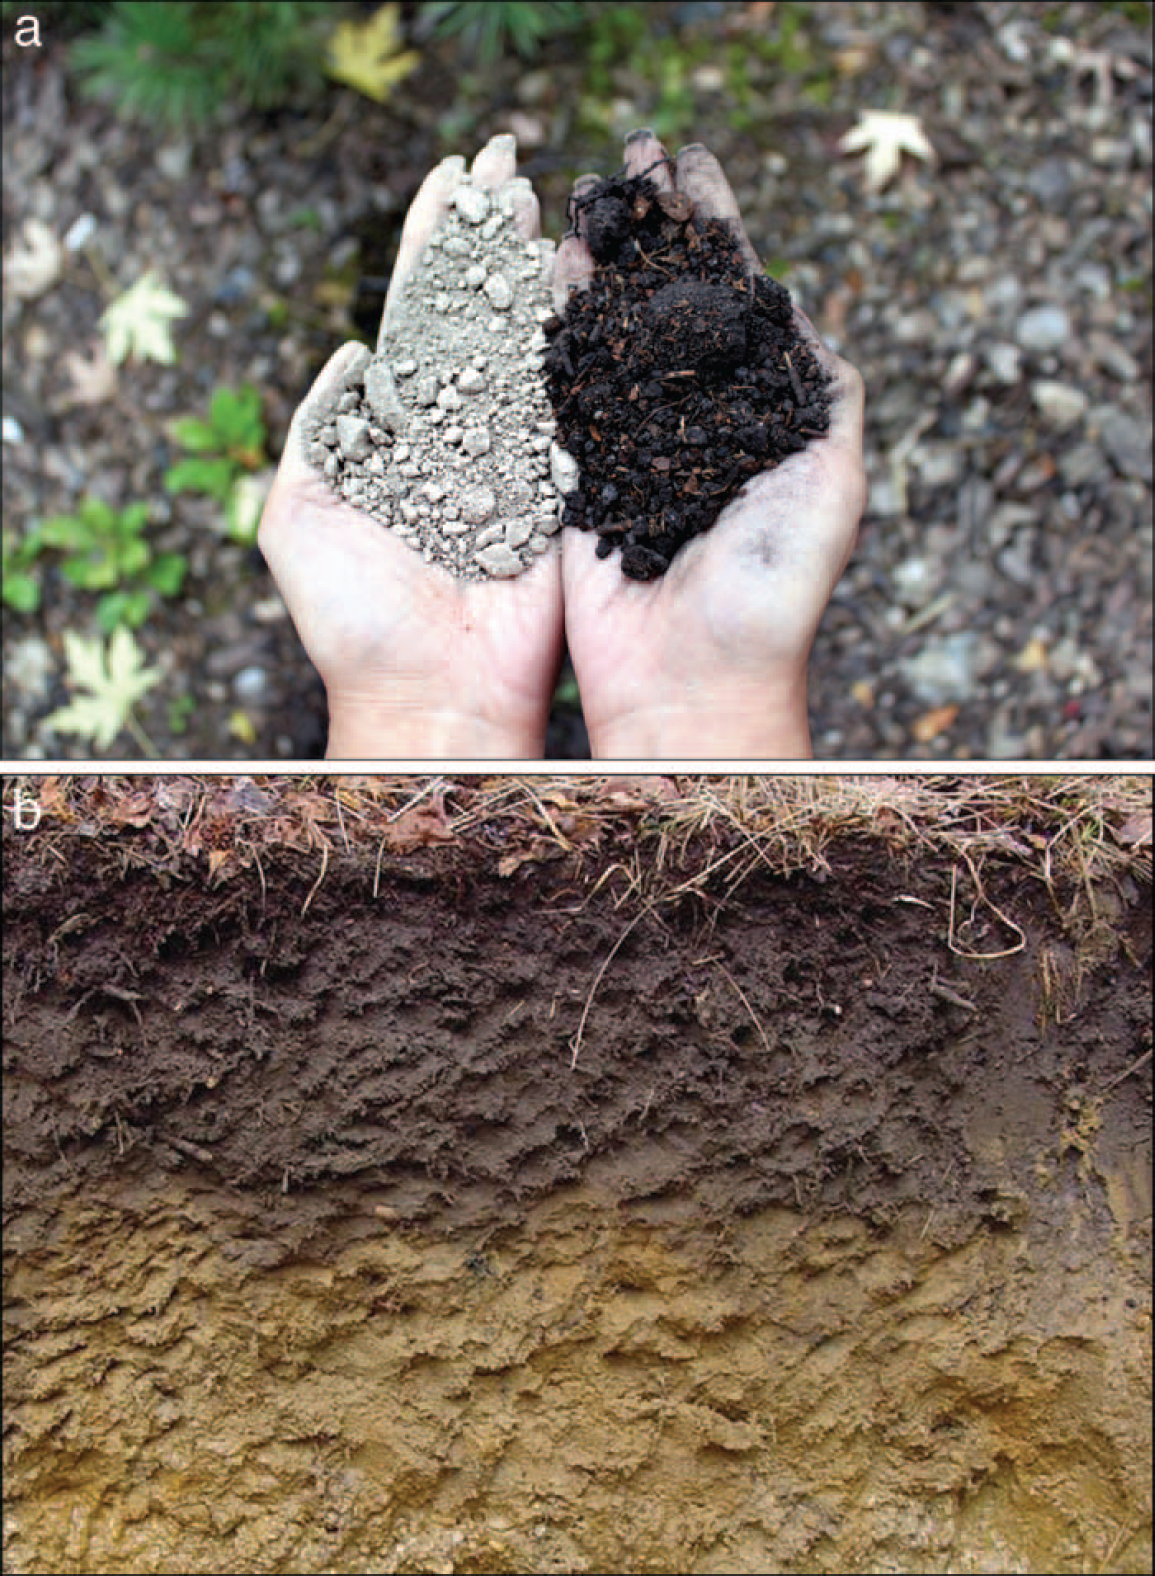
The soil with dark color is high in OM content, while the soil with pale surface is low in OM.
Traditional procedures for determining SOM or soil organic carbon (SOC) content are based on its oxidation, either using gaseous oxygen in loss-on-ignition or elementary analysis methods or using strong oxidants in liquid forms, for example, potassium dichromate in the Tyurin or Walkley–Black methods. 10 The practical assessment of SOM quality also remains a challenging task. It is most often assessed using one of two methods: the humic acid to fulvic acid ratio (HA/FA) and by the ratio of absorbances of alkaline soil extract at the wavelengths of 400 nm and 600 nm (E4/E6 or A400/A600). 11 Fractionation of humic substances is based on the principle of their varying solubility at different pH values. 12 Most of these methods are time and labor intensive. Thus, soil monitoring using alternative methods is essential for the early detection of changes in SOM content and quality and to provide intensive information about SOM content at low cost, with an acceptable level of reliability and in a timely manner.
Visible near-infrared (Vis-NIR) diffuse reflection spectroscopy and midinfrared (mid-IR) diffuse reflection spectroscopy are rapid, nondestructive, reproducible, and cost-effective analytical methods. 13 The mid-IR spectrum has often been used for the qualitative analyses of organic substances. Due to relatively simple sample preparation procedures as well as the possibility of using dry soils directly, mid-IR approaches have been especially popular. However, Niemeyer et al. 14 concluded that mid-IR spectrometry is not suitable for estimating absolute concentrations due to the extreme sensitivity of the equipment to the homogeneity of the soil-matrix material mixture used in the analysis. The main difference between the two ranges is that absorption in mid-IR spectroscopy corresponds to fundamental bands of molecular vibrations, whereas absorption in Vis-NIR spectroscopy corresponds to overtones and combinations of these fundamental bands. 15
Various studies of Vis-NIR and mid-IR spectroscopy have been carried out to determine different soil parameters in different configurations (in the laboratory, in the field using sampling, or on the go using sensors embedded on a tractor). However, up to now, there have been few bibliographical studies or reviews on this subject because the rapid growth of NIR and mid-IR studies dedicated to soil is recent. 16 Viscarra Rossel et al. 17 compiled a very complete series of the various soil attributes measured by NIR and mid-IR. Cécillon et al. 18 extensively reviewed all the available NIR technologies (proximal sensing, laboratory analysis, and remote sensing) for assessing soil quality and concluded that the most urgent need was for international databases. Reeves 13 wrote a review highlighting laboratory versus on-site NIR and mid-IR analysis of carbon and pointed out the various advances in these techniques.
The quantity of SOM has also been related to reflection data collected from agricultural fields in several studies. Henderson et al. 19 and Cozzolino and Moron 20 found that visible wavelengths had a strong correlation with SOM for soils with the same parent material. Christy 21 and Cécillon et al. 18 reported a very good assessments of SOM using NIR spectroscopy in the laboratory and even under field conditions using on-the-go sensors. Whereas the quantitative assessment of SOM is one of the most frequent applications of spectroscopy, studies dealing with qualitative assessment of SOM are rather rare. Cohen et al. 22 suggested that Vis-NIR spectra are effectively associated with SOM quantity and quality. Moreover, there are a number of studies on using mid-IR spectroscopy for characterizing SOM decomposition.23,24 These mentioned that mid-IR spectroscopy is better suited for SOM research because the absoption features associated with various organic functional groups, such as lipids, proteins, and charcoals, can be identified and because mid-IR spectroscopy may provide more stable calibrations across soil types.
Based on Ge et al., 25 spectroscopy calibration includes the following four main steps: (i) measurement, in which concentrations of targeted soil constituents are determined and soil spectroscopic reflectance is obtained; (ii) pretreatment, in which spectroscopic reflectance spectra are preprocessed; (iii) calibration, in which a subset of samples is used to develop regression models; and (iv) validation, in which the remaining samples are used to evaluate the validity of the regression models for estimating constituent concentrations. The main challenge limiting the application of spectroscopy for the evaluation of soil properties is finding suitable data pretreatment and calibration strategies. So far, various pretreatment and calibration methods have been suggested to relate spectra to the measured properties of materials. Some frequently used pretreatment methods for multivariate calibration techniques for spectroscopy, such as multiplicative scatter correction (MSC), standard normal variate (SNV), smoothing, continuum removal, and conversion to the first or second derivative spectrum, can be carried out to determine the combination that gives the best performance. Figure 2 demonstrates Vis-NIR reflectance of soil samples having low and high SOM contents using different pretreatments.
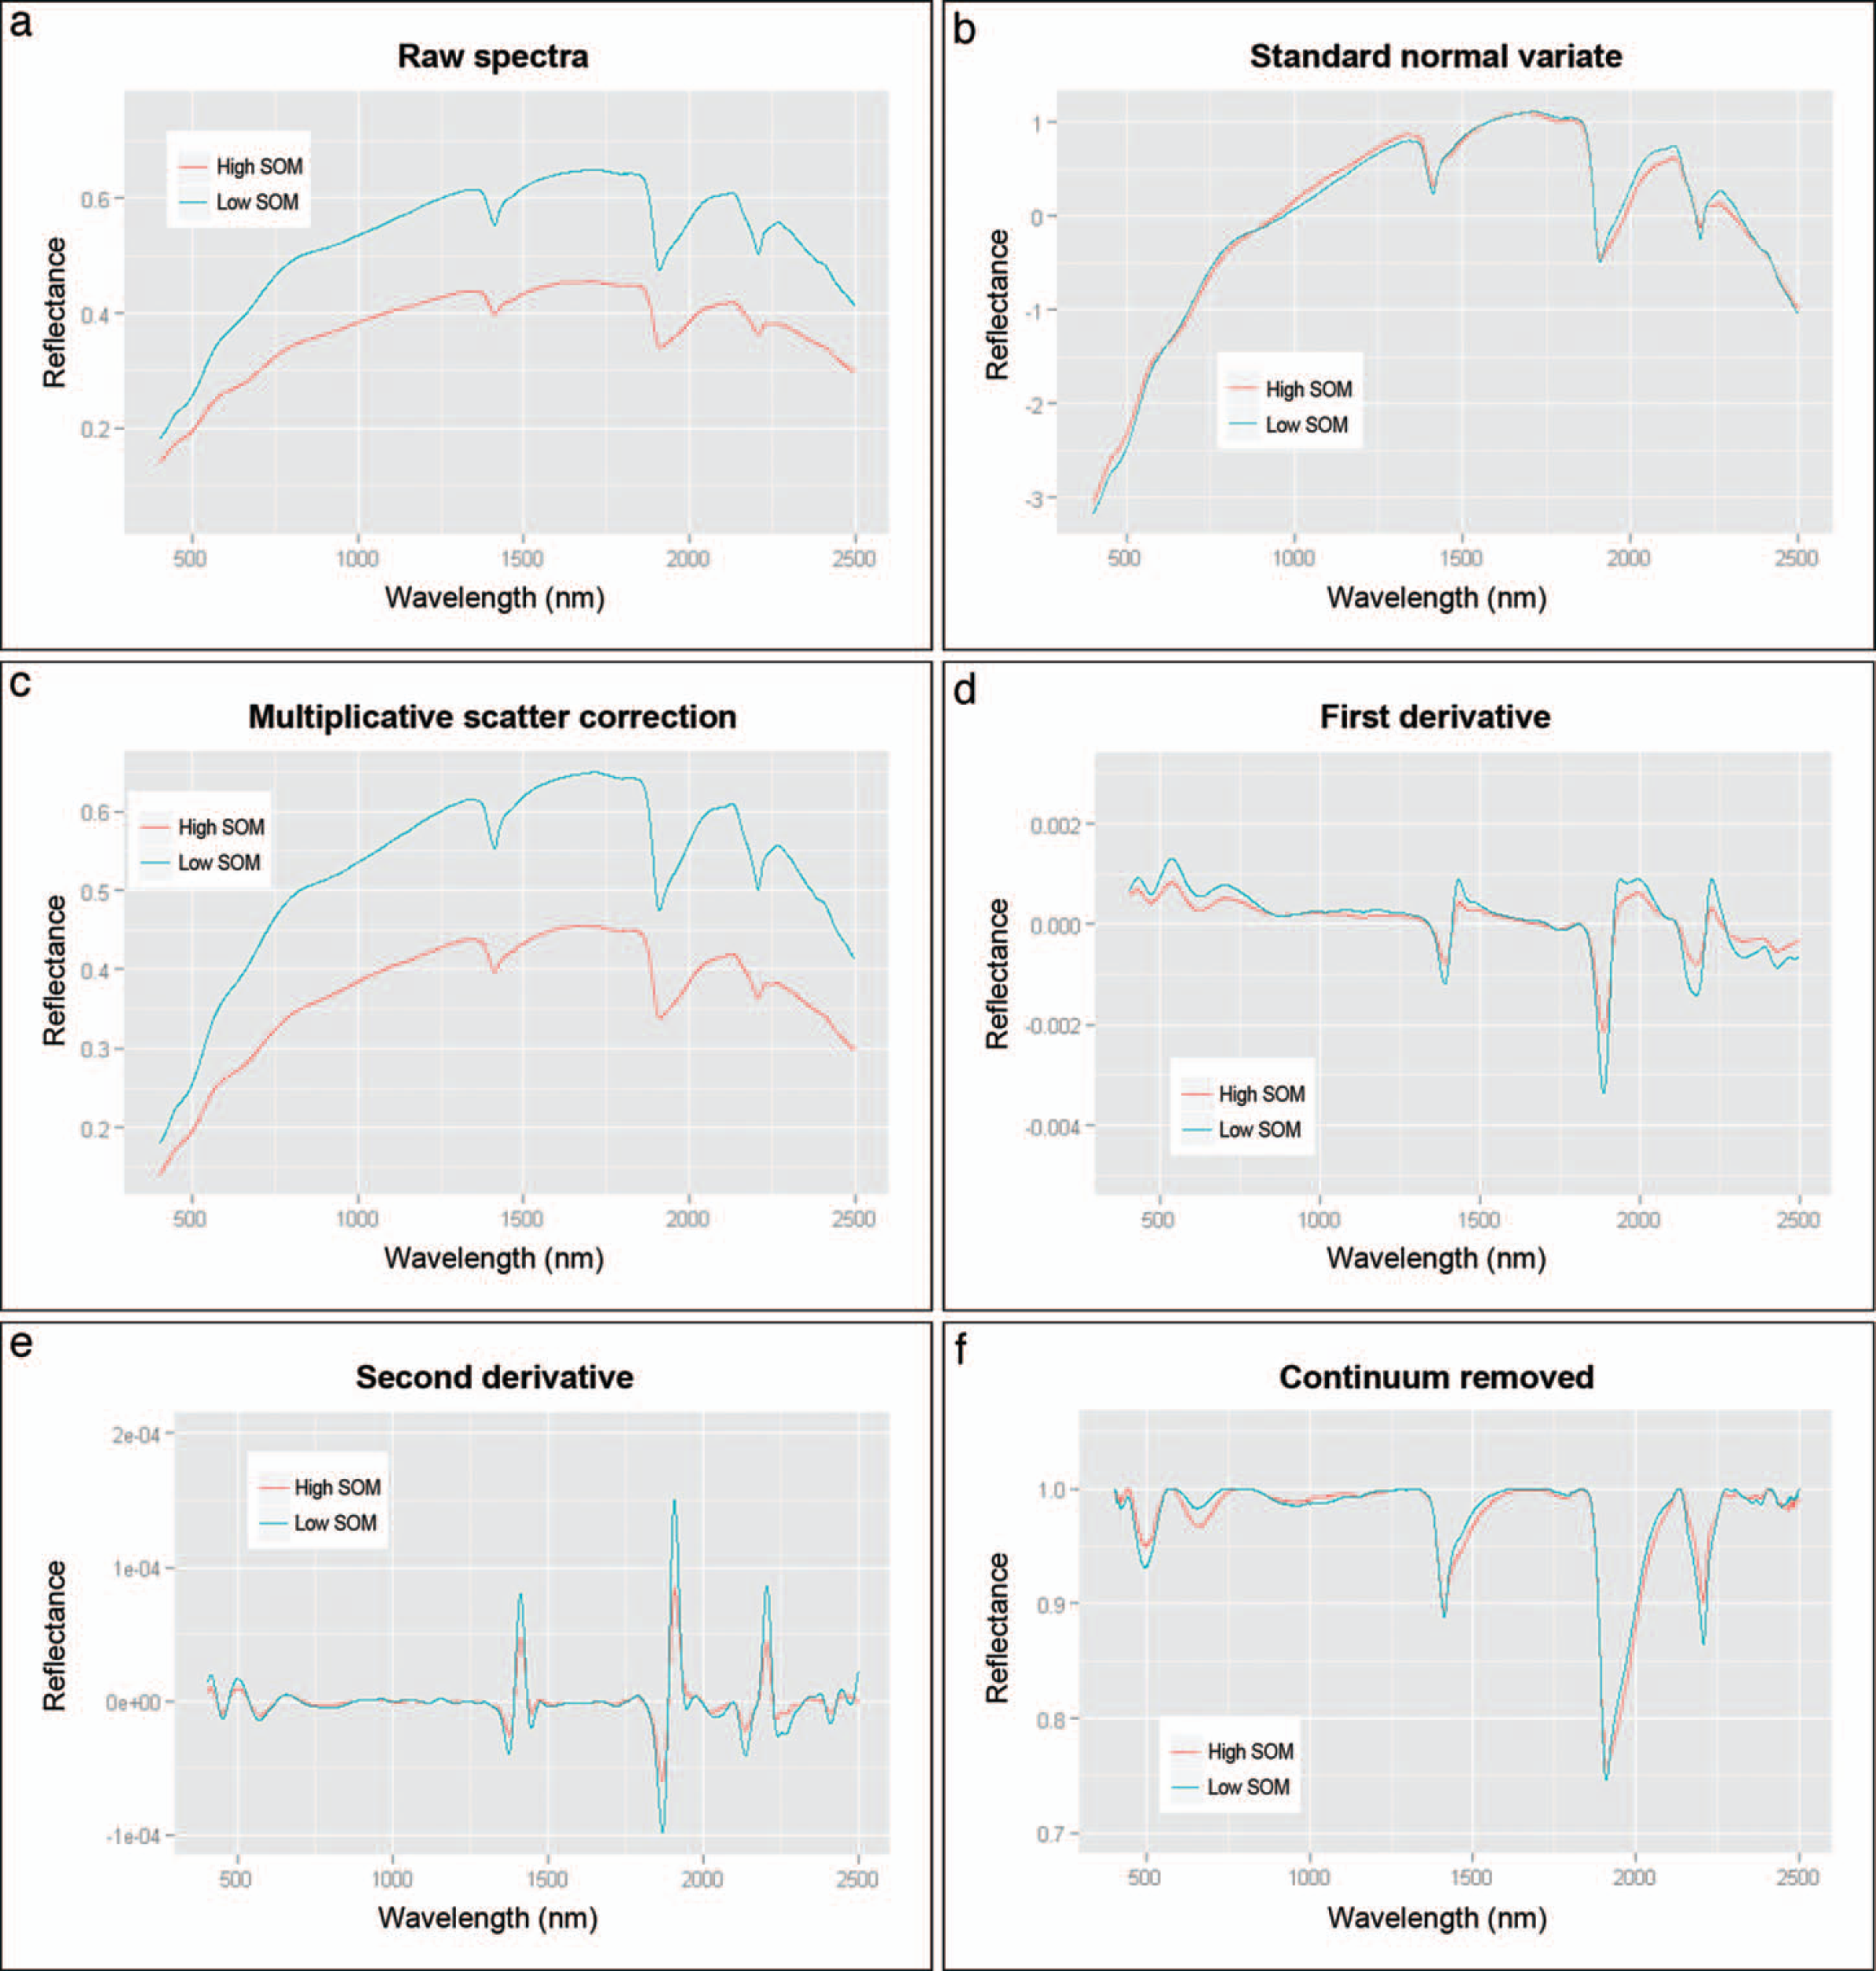
The Vis-NIR spectra of soil samples with low and high SOM contents after different pretreatments.
Most spectroscopy studies have used means of regression analysis based on the assumption of a linear relationship between dependent and independent variables. Also, several common methods including stepwise multiple linear regression (SMLR), 26 principal component regression (PCR), 27 partial least squares regression (PLSR), 28 random forests (RF),29,30 artificial neural networks (ANN), 31 and support vector machine regression (SVMR)28,32 have been adopted so that multivariate calibration methods can be used to extract the relevant part of the information for a very large data set in soil applications. To the best of our knowledge, the SVMR technique has not yet been commonly used to analyze SOM quantity and, especially, quality in the spectral domain. Furthermore, validation is used to confirm that the values being entered into data objects conform to the constraints within the schema of the data set as well as the rules established for the application. As a general rule, two-thirds of the data set are chosen by random stratified sampling and used in the calibration set. The rest is used for validation purposes. 28 Moreover, most of the time, the leave-one-out cross-validation method plus independent validation data set gives the best result. 16
Because Vis-NIR and mid-IR spectroscopy are to be used for future reference measurement, the measurement process must be well suited and provide a precise expression of the performance and uncertainty of the measurement. The geographical scale for the calibrations affects their total precision. 33 Some reports have mentioned that it is better to develop models for smaller areas, on the scale of a field, rather than ones for larger geographical areas. However, one of the gaps in the monitoring of soil parameters with Vis-NIR and mid-IR spectroscopy is the lack of a global calibration model. Moreover, the standardization of determination procedures and methods for different soil parameters is needed to overcome this and other similar limitations and problems.
Our intention is for this review to serve as a source of up-to-date information on the current role of Vis-NIR and mid-IR spectroscopy in SOM quantity and quality assessment. We discuss the performance and generalization capacity of Vis-NIR and mid-IR calibration methods, especially the least squares support vector machine (LS-SVM) algorithm, with attention to data pretreatments. We also review the spatial extent of studies and the calibration scales (field, local, and global) used. Finally, the accuracy and uncertainty of soil measurement using spectroscopy are discussed. We end with a short discussion of issues surrounding the use of spectroscopy for soil analysis for future research.
SPECTRAL REGIONS SUITABLE FOR SOIL ORGANIC MATTER QUANTITY AND QUALITY ASSESSMENTS
Visible near-infrared spectroscopy has been developed as a major tool for the quantitative determination of SOM, whereas mid-IR spectroscopy has been used mainly in research for qualitative analysis. The main reason for the exclusion of mid-IR spectroscopy from quantitative analysis has been the belief that quantitative analysis using the mid-IR region requires dilution with potassium bromide (KBr) because of the strong absorptions present. 34 The power of these absorptions can lead to spectral distortions and nonlinearities, and could make quantitative analysis complicated or impossible in undiluted samples. 35 However, Reeves et al. 36 demonstrated that good quantitative measurements are possible in the mid-IR region. Their reports showed that quantitative mid-IR spectroscopy analysis, as well as Vis-NIR spectroscopy, could be performed on neat samples with good accuracy.
The visible spectrum is known to be a region showing high absolute correlations with SOM. 28 For instance, based on 40 soil samples originating from a number of climatic zones, Bartholomeus et al. 37 found the highest correlation between inverse of reflectance and SOM at wavelengths between 640 and 690 nm. Christy 21 showed that measuring the SOM content using Vis-NIR spectroscopy is possible, even under outdoor conditions and using an independent validation set. Moreover, based on the research of Nocita et al. 27 Vis-NIR spectroscopy has produced reliable results for SOC and SOM content in the laboratory. However, using soil spectra measured directly in the field or using airborne imaging spectrometers remains challenging due to unrestrained variations in surface soil conditions, such as vegetation cover, soil moisture, and roughness.
In contrast, Bowers and Hanks 38 concluded that reflectance in the NIR between 1200 and 2400 nm was not significantly influenced by SOM. This raises the possibility that spectral predictive mechanisms may vary from one population of soil samples to another, caused by the decomposition stage of SOM, the nature of existing compounds, and the influence of other relevant factors such as texture, soil moisture, and iron oxides.29,39 Figure 3 shows the spectral signatures of mineral, decomposed organic, and slightly decomposed organic soil. In general, the mineral soil has the lowest reflectance. The major absorption features (1400 and 1900 nm) are caused by water remaining in the samples. The slightly decomposed horizons show a higher reflectance in the NIR and more pronounced water-absorption features.
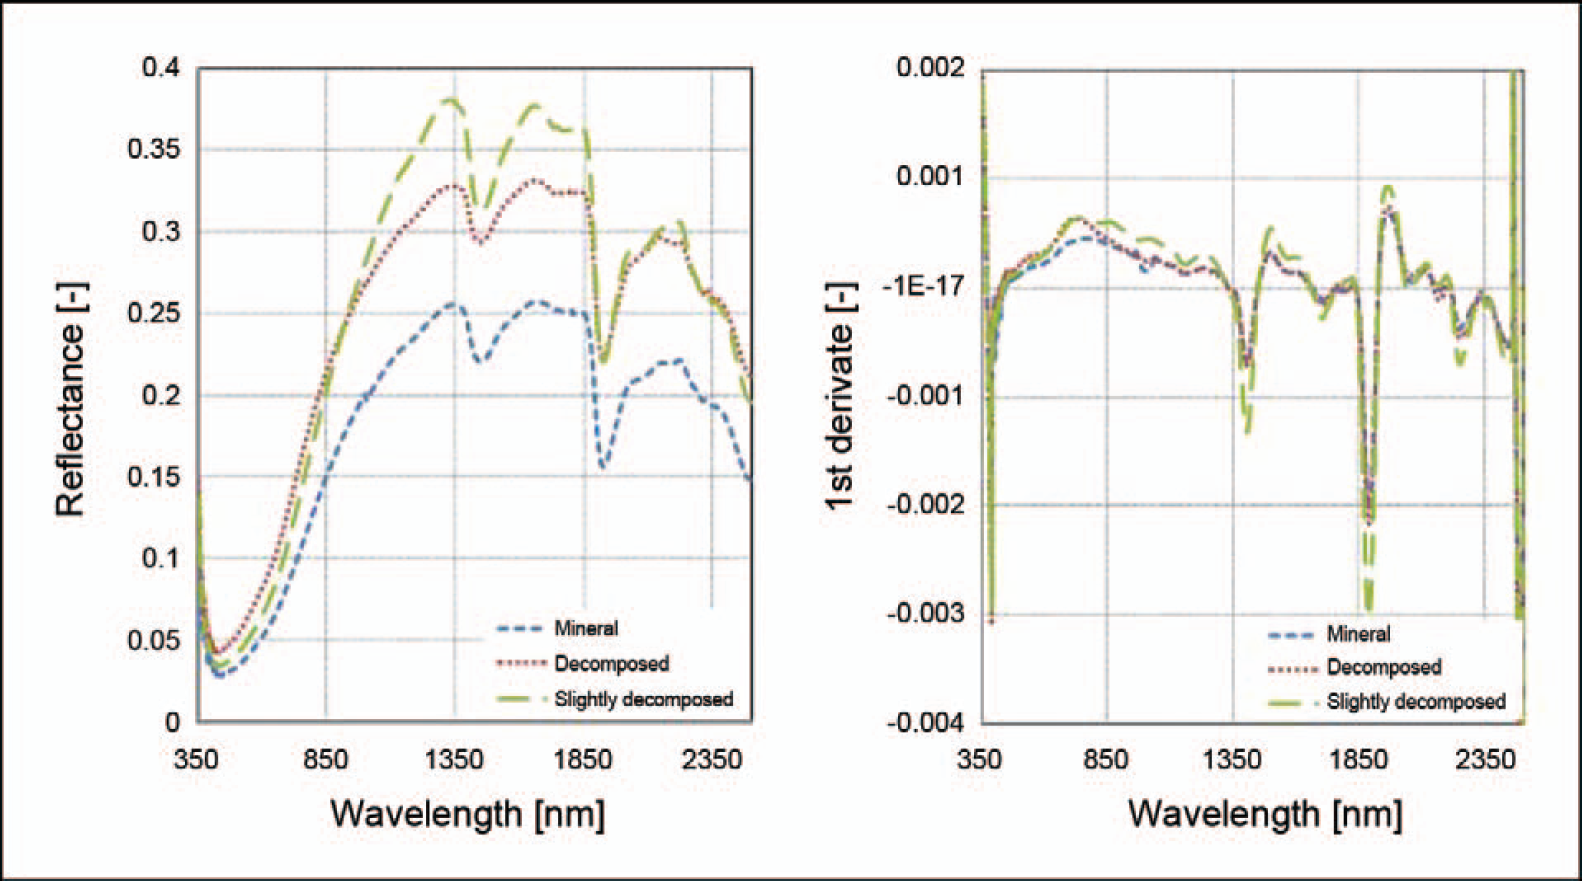
Average spectral signatures of mineral, decomposed organic, and slightly decomposed organic soil samples, and their first derivatives. [Reproduced with permission from Bartholomeus et al. 40 ]
Shepherd and Walsh 41 mentioned that spectral signatures related to various components of SOM generally occur in the mid-IR range but that their overtones can be found in the Vis-NIR ranges. Several studies concluded that on average mid-IR outperforms Vis-NIR because mid-IR spectra consist of more defined bands and thus are often described as performing better in determining the SOC and SOM.13,42,43 Due to its increasing use and wide acceptance, mid-IR spectroscopy may be considered a reference method, even if it is not yet an established laboratory standard. However, mid-IR spectroscopy should be used more often under laboratory conditions because the measurement ranges of the currently commercially available handheld mid-IR spectrometers are not usually suitable for soil measurements, whereas NIR spectroscopy can be more easily applied in the field, using either portable or airborne sensors. 44 Viscarra Rossel et al. 17 also showed that the average R 2 value for predicting SOC and SOM using mid-IR was 0.96, using NIR 0.81, and using the visible spectrum 0.78. Thus, predictions using visible spectra were generally less accurate and had lower R 2 values than predictions using NIR or mid-IR.
As Bellon-Maurel and McBratney 16 stated in a review of Vis-NIR and mid-IR spectroscopy and soil carbon, research using Vis-NIR and mid-IR spectroscopy for soil analysis has been experiencing a boom over the last ten years; most publications are related more to SOM quantity, and those related to qualitative data are rare. The application of laboratory spectrometry to the specific assessment of soil quality started at the turn of the 21st century. Cohen et al. 45 presented the first application to the rough assessment of a specific soil threat. They showed that Vis-NIR spectroscopy obviously surpassed a frequently used empirical model for classifying sites according to soil erosion status. Cohen et al. 46 used another NIR-based approach to measuring global soil quality, including SOM. They joined ordinal logistic regression and classification trees of soil NIR spectra to differentiate among ecological condition categories. Using classification trees, they identified important spectral regions for ecological condition classification: 2200–2300, 1100–1200, and 500–600 nm. They concluded that using soil reflectance data for site classification, mainly for the discrimination of strictly degraded sites, was more suitable than using biogeochemical data. Thus, soil NIR spectra provide an effective tool for the rapid diagnosis of the condition of soils and ecosystems. Reeves et al. 47 also suggested that Vis-NIR could be used for predictions of SOM quality as well as quantity. Although the absorptions by SOM in the Vis-NIR are often not strong or readily apparent to the naked eye, the overall absorption due to SOM in the visible region is broad but clear. 48 For this reason, a number of studies have used soil color to estimate SOM. 49 Thus, there are various reports suggesting that Vis-NIR relates better to SOM than does NIR alone. 17 Cécillon et al. 18 stated that the spectra of soil samples enclose much information related to soil quality and that multivariate regressions of Vis-NIR spectra from the laboratory and imaging spectrometry can accurately predict several parameters of soil, such as SOM. However, SOM quality does not always need to be precisely quantified; many industrial or agricultural applications need only a classification of soil condition with respect to a critical test value for the more important properties. They recently suggested a tentative approach based on the direct prediction of specific soil-quality parameters related to soil ecosystem services using laboratory Vis-NIR spectroscopy. These results are the first effort to predict specific soil-quality indices using laboratory Vis-NIR spectroscopy. They open a new pathway for soil-quality research because a simple scan of a soil sample using a Vis-NIR spectrometer can provide quantitative information about the provision of a given soil ecosystem service.
An assessment of some NIR and mid-IR spectra of soils easily reveals the differences between the two spectral regions, the advantages of using the mid-IR for spectral interpretation, and the difficulties with NIR interpretation. This is due to the nature of the two regions, with the NIR containing many overlapping combination and overtone peaks from the mid-IR spectral region, which results in a multitude of bands for even simple compounds. Thus, spectral interpretation is easier in the mid-IR spectral range. 13 Reeves 50 also claimed that mid-IR calibrations using nondiluted samples can outperform those obtained using diluted samples and that for soils mid-IR calibrations can outperform NIR calibrations on the same sample sets.17,51 As stated by Merry and Janik, 52 mid-IR spectroscopy has advantages over NIR spectroscopy from a data-quality standpoint. Malley et al. 53 presented research using mid-IR for soil analysis and SOM determination that was firmly qualitative and dealt with band assignments. Du and Zhou 54 reviewed approximately 30 references on the use of mid-IR spectroscopy for SOM analysis; they concluded that mid-IR spectroscopy was normally used for qualitative analysis and could be practical also for the quantitative analysis of soils.
Generally, based on the findings of Viscarra Rossel et al., 17 diffuse reflectance spectroscopy in each of the visible, NIR, and mid-IR regions can be used for the immediate assessment of various soil properties. The choice of which spectral region to use will depend on (i) the accuracy of the predictions, (ii) the cost of the technology, and (iii) the amount of sample preparation required. The mid-IR region is more appropriate than the visible or NIR for this type of analysis due to the higher incidence spectral bands in this region as well as the higher intensity and specificity of the absorption features.
SPECTROSCOPIC PRETREATMENT, MULTIVARIATE CALIBRATION, AND VALIDATION
The most restrictive factor in Vis-NIR and mid-IR spectroscopy calibration is actually the quality of the spectra. 55 Even the most powerful software for NIR calibration cannot make reliable predictions from poor spectra. Spectrum pretreatment may improve the quality of Vis-NIR and mid-IR spectroscopy calibrations when powerful software is used, but the accuracy of the reference data and the quality of the spectra are the main elements of consistent calibration models. Coûteaux et al. 55 mentioned that the pretreatment of soil spectra using the techniques listed below, before spectroscopy model calibration, is needed to reduce interference, such as that caused by variation in particle-size distribution. Several studies report an improved accuracy of Vis-NIR and mid-IR spectroscopy predictions after different pretreatment methods to minimize particle-size and noise effects.56,57 Spectral pretreatment methods are employed to remove any inappropriate information that cannot be handled correctly by the modeling techniques.
The pretreatment techniques include averaging, centering, smoothing, standardization, normalization, and transformations, among others. Some of the most frequent pretreatment techniques are (i) MSC, (ii) SNV, (iii) smoothing and/or conversion to the first or second derivative, (iv) continuum removal, and (v) derivatives. In MSC, one of the most commonly used normalization techniques, the light scattering is estimated for each sample relative to an ideal sample obtained by averaging the complete wavelength range of the data set. Each spectrum is then corrected such that all samples appear to have the same scatter level as the reference spectrum.58,59 In SNV, the slope variation from spectra caused by scatter and variation of particle size is removed.60,61 The transformation is applied to each spectrum individually by subtracting the spectrum mean and scaling with the spectrum standard deviation. Smoothing and/or conversion to the first or second derivative, often using the Savitzky–Golay algorithm, is a simplified least squares fit convolution in which successive subsets of adjacent data points are fitted to a low-degree polynomial using the method of linear least squares. The convolution can be understood as a weighted moving average filter, with weighting given as a polynomial of a certain degree.62,63 Continuum removal is a method commonly used in laboratory infrared spectroscopy and a numerical method used to estimate the absorptions not due to the band of interest and remove their effects. 64 The continuum is a convex hull fitted over the top of a spectrum using straight-line segments that connect local spectra maxima. It is then removed by dividing the reflectance value for each wavelength by the value of the convex hull at the corresponding wavelength.29,65 Derivatives are often used to remove baseline shifts and to increase the resolution of superposed peaks; they are usually calculated according to the Savitzky–Golay algorithm. 66 The parameters of the algorithm (interval width and polynomial order) should be carefully selected to avoid amplification of spectral noise. 67 The aim of these transformations is to decrease noise and enhance possible spectral features connected to the property studied.
Calibration refers to relating a set of spectral parameters that are derived from the spectral information (after the aforementioned pretreatment techniques) to the materials in question. Using a set of well-known calibration methods makes this process feasible. Choosing the most robust calibration technique can help to achieve a more reliable prediction model. Robustness means that the modeling performance does not critically change when new calibration samples are employed. 68 The performance of a model refers to its predictive accuracy and robustness, and a good model has a higher coefficient of multiple determinations (R 2 ) and the lowest value of the standard error of prediction (SEP) in the prediction set.32,69 Some of the most suggested calibration techniques are SMLR, PCR, PLSR, and ANN.
In SMLR, a linear combination of the spectral values at each selected wavelength is created to correlate as closely as possible to the dependent reference values. The regression coefficients are estimated by reducing the error between predicted and observed response values in a least squares sense. 59 The SMLR approach often causes severe problems because of multicollinearity among the reflectance measurements of the selected wavelengths. In particular, the estimated regression coefficients vary markedly when the outlying observations are changed or deleted. Furthermore, the variability of the estimated regression coefficients becomes inflated. 67
Principal component regression is a combination of principal component analysis (PCA) and multiple linear regression (MLR). The independent data matrix (spectral data) is transformed by PCA, and the first few principal components (PCs), which show most of the independent data variance, are used as inputs for the MLR model instead of the original spectral data. 59 Schwartz et al. 59 stated that the advantages of this method over SMLR are that the PCs are uncorrelated and the noise is filtered. The first few PCs are usually enough for a robust model, and over-fitting issues can be removed. The major drawback is that the PCs selected for the SMLR input are not necessarily the best predictors for the reference data. There is no guarantee that the first PCs will include the spectral data related to the specific dependent variable that needs to be modeled.67,70
Partial least squares regression is a popular modeling technique used in chemometrics and is commonly used for quantitative spectral analysis. It is applied to construct predictive models when there are many predictor variables that are highly collinear. The technique is closely related to PCR. However, unlike PCR, the PLSR algorithm selects successive orthogonal factors that increase the covariance between predictor (X spectra) and response variables (Y laboratory data). By fitting a PLSR model, the researcher hopes to find a few PLSR factors that explain most of the variation in both predictors and responses. 17 The required number of PCs in the PLSR method is normally smaller than that in a PCR calibration model for a similar model presentation. 67 According to Goetz et al., 71 because PLSR models are linear and use PCs to make the data simpler, it is important to use a suitable number of PCs, normally 1 PC for every 10–20 samples that have been used for the model's development; up to a maximum of 20 PCs is usually sufficient for a reliable model. 72 The advantages of PLSR are that it handles multicollinearity, it is robust in terms of data noise and missing values, and (unlike PCR) it balances the two objectives of explanation response and predictor variation (thus calibrations and predictions are more robust) and presents the decomposition and regression in a single step. 17 However, PLSR is not appropriate when a nonlinear model is needed. 73 It is very obvious that factors such as experimental conditions, instrument variation, and analyzed characteristics encourage nonlinearities in the spectra. 74
Artificial neural networks is based on the ability of the algorithm to learn during a training procedure in which it is presented with inputs and a set of expected outputs. The sum of the weighted inputs is transformed using linear or nonlinear transfer functions, a popular nonlinear transformation function being the sigmoid function. Learning is a repeating process in which the resulting output is compared to the given expected output and the algorithm adjusts the weights accordingly. 59 In a recent large-scale study that included over 1100 soil samples, ANN was proven to provide better results than PLSR in modeling soil constituents. 29 Although this method is often used to deal with nonlinear models, it is not popular with researchers due to some problems, such as the selection of hidden layer size, learning rate, and momentum. 74 In addition, the ANN model requires a large number of training data, which always influences the training speed. Its tendency to over-fit the data is another difficulty to conquer to create a good result. 75
Thus, all the calibration methods mentioned so far require the creation of robust and generalized models due to their tendency to over-fit the data. Therefore, using a method such as SVMR, which can overcome the aforementioned problems, seems essential. SVMR is a supervised, nonparametric, statistical learning technique; thus, it represents a different model class than the previous techniques. 76 It has been known to strike the right balance between the accuracy attained from a given finite amount of training patterns and the ability to generalize to unseen data. The LS-SVM algorithm is a reformulation of the standard SVMR algorithm and is based on regression models. It has the capability for linear and nonlinear multivariate calibration and solves the multivariate calibration problems relatively quickly. The LS-SVM algorithm adopts a least squares linear system as the loss function and is applied in the pattern recognition and nonlinear evaluation; it is the same as ANN in terms of accuracy, simplicity, and robustness. 32 This method has recently gained widespread acceptance in data-driven nonlinear modeling applications 28 because it possesses several popular characteristics, including its good generalization ability and robustness of the regression function and the ability to deal with sparse data. 77 The most valuable properties of SVMs are their ability to handle large input spaces efficiently, ability to deal with noisy patterns and multi-modal class distributions, and restriction to using only a subset of training data to fit a nonlinear function.
For most studies of Vis-NIR and mid-IR spectra, PLSR appears to be the most widely used algorithm, followed by the PCR.17,26 The PLSR method mainly extends variability in the spectral features and reference data, whereas PCR spans variations in the spectrum features whether or not they correlate with the reference data. Bornemann et al. 78 offered satisfactory results for SOC prediction using mid-IR spectroscopy and PLSR. Nocita et al. 27 and Kuang and Mouazen 79 also used Savitzky–Golay smoothing and first derivative conversion with a second order polynomial and claimed that, through the use of PLSR, they could predict SOC content precisely. However, Mouazen et al. 80 compared ANN to PCR and PLS for the prediction of selected soil properties, and they found that combined PLSR-ANN models led to improved predictions compared to PLSR and PCR. Fidêncio et al. 81 and Daniel et al. 82 also implemented the Savitzky–Golay algorithm with a nine-point moving average filter, third-degree polynomial, and second derivative before applying a regression model. The models based on ANN showed superior performance for the determination of SOM in soils using Vis-NIR spectroscopy. This study also provided evidence that ANN is the best approach for Vis-NIR spectra of soils, showing significant decreases in the validation errors compared to PLSR and being faster and more reliable. This process may be used as a tool for the determination of SOM because the level of errors obtained are acceptable in routine soil laboratories.
Viscarra Rossel and Behrens 29 used PLSR and SVMR for the prediction of SOC from Vis-NIR spectra. They provided the most successful prediction models, with similar R 2 and SEP values. Vohland and Emmerling 83 proposed that, for PLSR, rising spectral noise resulted in concomitantly reduced values. In contrast, SVMR maintained high R 2 values even at high levels of noise; however, escalating noise caused severely biased estimates, so that other regression models were less accurate than PLSR. Stevens et al. 28 compared PLSR and SVMR for their capability to estimate SOC and SOM content from Vis-NIR spectroscopic data covering a region with different agro-geological subregions. They found local calibrations based on soil types and agro-geological regions to be generally more reliable than global calibrations. SVMR outperformed PLSR for the global data, whereas PLSR performed better for soil-and region-related submodels. 28
Validation is a quality control process that is used to determine whether a product or system complies with the regulations, specifications, or conditions imposed at the start of a development phase. Calibrations of Vis-NIR and mid-IR spectroscopy without validation using independent samples (samples that were not used in the calibration process) appear less reliable. Moreover, Nduwamungu et al. 84 suggested that an adequate balance between calibration and validation sets is necessary for stable calibration models. If a calibration set is too small, the calibration may be sample-sensitive and the analysis of new batches of samples may show significant differences in accuracy. Generally, one-third of the data set is chosen randomly for the calibration set. 28 Most studies that used independent samples rather than cross-validations to validate prediction models generally indicate that cross-validation is over-optimistic.57,71,85 Leave-one-out cross-validation often gives the best results for small sample sets. This is fairly normal because, in most but not all cases of soil databases, validation samples have a source similar to the ones in the calibration set and, moreover, they could have been scanned in the same batch. Therefore, they are not independent. 16
It is possible to compare several pretreatment and calibration approaches by examining the R 2 of the relationship between the model-predicted and actually measured values. In general, a higher R 2 value is an indicator of a better modeling approach. Unfortunately, R 2 does not provide any indication of whether the model has over-fit the data. The other parameter, SEP, provides this information. 71 Table I shows a summary of the assessment of SOM content (range 0.4–12.06%) using Vis-NIR, NIR, and mid-IR spectroscopy under different data-processing and validation techniques. 16
SOM content quantification by NIR, Vis-NIR and mid-IR spectrometry. a
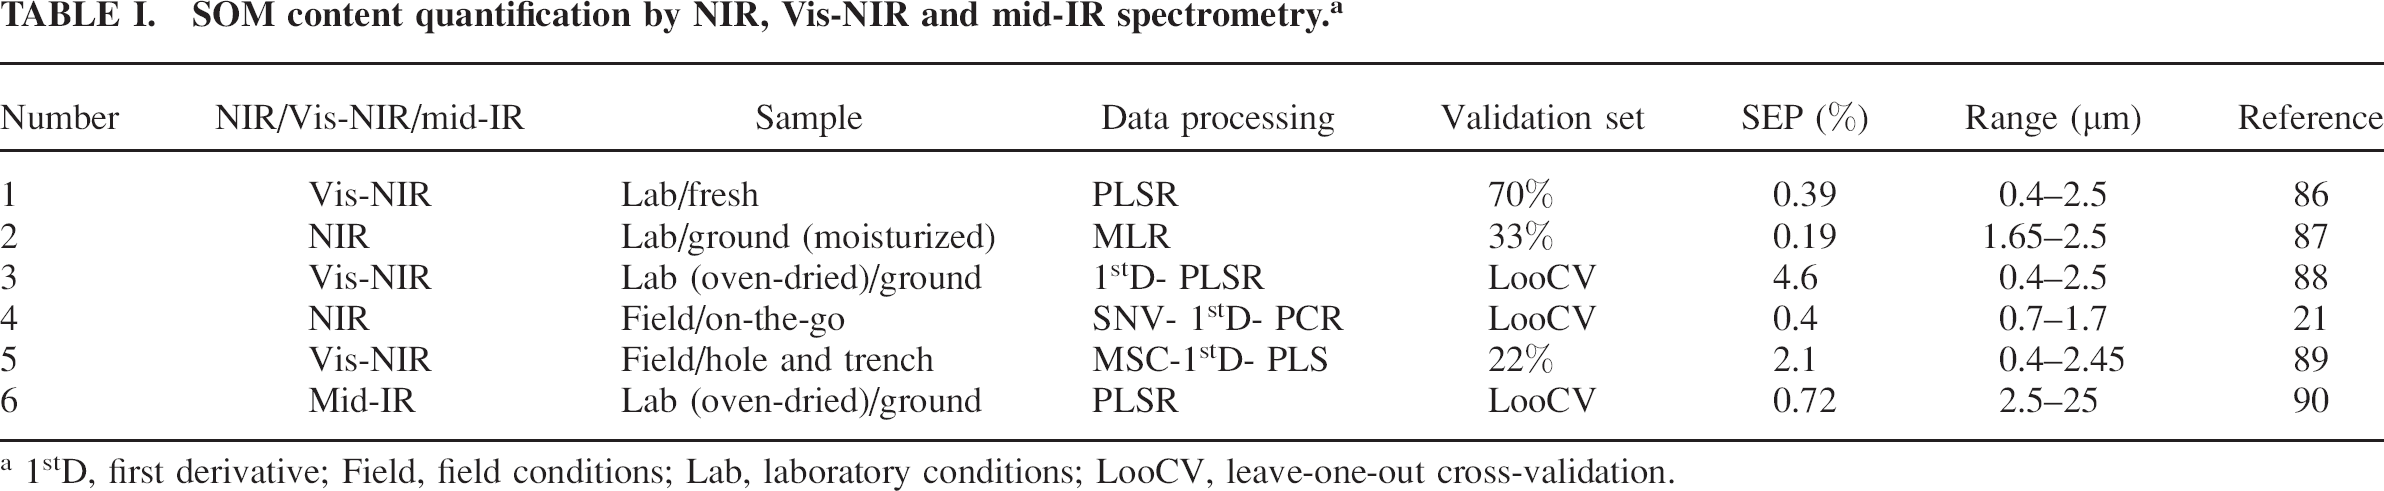
1stD, first derivative; Field, field conditions; Lab, laboratory conditions; LooCV, leave-one-out cross-validation.
CALIBRATION SCALE: FIELD, REGIONAL, OR GLOBAL
The question of whether field-level calibrations can be useful in a bigger region or as a global calibration model directly relates to the analysis level, texture soil type, and so on. However, this topic really needs a great deal of further research. Visible near-infrared spectroscopy and mid-IR spectroscopy have mainly been applied to soils on the scale of the field or the landscape, and no global model can be inferred from regression models acquired with such local studies. One of the main gaps in the efficient monitoring of soil and SOM quality using Vis-NIR and mid-IR spectroscopy is the lack of regression models capable of evaluating soil conditions on the global scale across various soil types. Cécillon et al. 18 reported that global assessment of soil conditions using Vis-NIR and mid-IR spectroscopy enabled the rapid tracking of states of soil quality or of its changes after a disturbance such as soil erosion, soil contamination and loss of organic matter. In addition, successful classifications of sites have been built regarding land-use types or global soil condition classes. Employing this cost-effective strategy could have wide implications for the spatial coverage and the sampling frequency of soil-monitoring networks. Accessible soil-monitoring sites and data could be used for local and regional calibration.
Nduwamungu et al. 84 stated that the calibration set should imitate all sources of variation observed in the entire soil sample set. Hence, regional models of prediction (site-specific models, field-level models, or models for geologically homogeneous areas) should not be applied to all types of soil without recalibration to take into account new samples added to the spectral library.
According to Schwartz et al., 59 a global soil spectral library, not only for minerals but also for chemical information, has to be maintained because all these factors can influence soil reflectance spectra. In the laboratory, using different spectrometers, or even repeating measurements of a specific sample using the same spectrometer, may result in variations in spectra. Such variations might consist of subtle or strong alterations in wavelength location, peak absorption shape, or radiometric intensity. Brodský et al. 91 described spectral libraries as data archives of spectral signatures measured on natural and/or manufactured materials that allow the exploitation of rapid and more accurate soil quantitative spectroscopy for digital soil mapping and monitoring activities. Pimstein et al. 92 also mentioned that using the same standards in spectroscopy could help to make global calibration models easier.
However, local calibrations based on soil types and agro-geological regions appear to be more efficient than global calibrations, due to the correlation of the strata with important chromophores such as soil moisture or ferric oxide content. 28 All of these reasons underline the urgent need to build a global and standardized soil spectral library; when such a library has been created, it should be possible to compute and monitor some of the specific soil parameters such as SOM.
Building Vis-NIR and mid-IR spectral libraries for soils raises several problems. The first problem relates to the fact that Vis-NIR and mid-IR spectra show slight variations even when obtained on supposedly identical instruments. The systematic differences between spectra obtained using different instruments can make combining spectra useless for developing calibrations. The second and related problem is the question of whether the measures of soil attributes included in the spectral libraries, obtained at different laboratories, will be the same or not. In addition, the current lack of data for many variables of soil properties could compromise the rapid creation of a global soil spectral library. Viscarra Rossel 93 initiated a spectral archive containing more than 10 000 spectra taken worldwide and is in the process of integrating them into this library for some major soil attributes. The soil spectral library approach for the quantification of soil properties such as SOM might thus not be successful until the calibration of all the minimum data set variables of the soil reflectance spectra has been achieved, which will be difficult.
ACCURACY AND UNCERTAINTY IN SOIL REFLECTANCE SPECTROSCOPY
Decisions about the management of environmental data require information about different related variables for which an understanding of data uncertainties is important. In this situation, environmental variables include natural indicators, such as soil variables. According to Heuvelink et al., 94 in practice, our knowledge of environmental variables is always limited because instruments cannot measure with ideal accuracy, samples are not exhaustive, and simplifications of the real world are essential when resources are restricted. Environmental data are rarely certain, and these errors may be difficult to quantify in practice. In the absence of such knowledge, we are uncertain about the true state of the environment. Uncertainty is an expression of confidence about our knowledge and is, therefore, subjective. 94 Uncertainty assessment is essential for establishing the value of data as inputs to decision making 95 and for judging the reliability of decisions that are informed by the data. 96 It is also important for determining the causes of uncertainty in environmental research and for directing resources toward improving data quality. 97
Because the steps involved in Vis-NIR and mid-IR reflectance spectroscopy are frequently expanded, there is a need to quantify and evaluate the associated uncertainties in the context of the application examples. 98 Some factors negatively influencing the accuracy of the soil spectroscopy predictions were identified by Stenberg et al. 1 as varying soil texture, soil structure, moisture, and mineralogy. The predictive ability of spectroscopy is limited due to a number of factors negatively influencing the estimated prediction, and these require more attention. In their review, Nduwamungu et al. 84 stated that clashing results for given soil properties have been reported and can be attributed to a lack of standardized methodology in relation to (i) sample preparation, (ii) spectrum acquisition, (iii) spectrum pretreatment, (iv) soil texture, (v) geological heterogeneity, (vi) reference method, and (vii) calibration method. Standardization of the rules for assessing the accuracy or precision of Vis-NIR and mid-IR spectroscopy predictions is a prerequisite for the comparison of the Vis-NIR and mid-IR spectroscopy presentations across different studies.
The preparation of soil samples is expected to affect the accuracy of Vis-NIR and mid-IR spectroscopy predictions, given the heterogeneous nature of the material. 53 Changes in the moisture content 99 or particle size of soil samples 100 are also known to influence the Vis-NIR and mid-IR spectra quality. Soil-particle size affects the quality of Vis-NIR and mid-IR spectra and, accordingly, the performance of the calibration. 101 The use of a different particle size may result in variable accuracy of NIR spectroscopy predictions for similar soil properties.
Detector noise and other internal sources of electronic and mechanical noise can affect the measurements. 59 In soil samples, where very weak spectral features are monitored for chemometric reasons, these noise factors can alter the use of a selected spectral model for a wide range of spectrometers and users. To solve this problem Pimstein et al. 92 examined the variation stemming from these sources using three ASD (now PANalytical, Boulder, CO) Fieldspec spectrometers that operate over the range of 300 to 2500 nm and developed a standard protocol for laboratory spectral process. They also recommended using the same internal standard worldwide to correct the spectra of any spectrometer to a selected master spectrometer. They showed that, under standard condition, chemometric analytical results are more precise than the former methods.
Krischenko et al. 102 believed that, when a large Vis-NIR or mid-IR spectral library is available, various calibration models may be developed based on soil type, soil texture, geologically homogeneous area, and also land-use practices. One of the major causes of inaccurate spectroscopy predictions is the application of developed spectroscopy models to soil samples that are not sufficiently represented by the group of samples used for calibration. 57
In a field measurement, there are more uncertainties than in the laboratory, such as atmospheric attenuation; sun angle; aspect and slope of the sample area; large pixel sample; and, most of all, soil crusting, which can occur on any soil surface.59,103 Then, laboratory spectroscopy and in situ non-mobile spectroscopy provide better accuracy than the field and airborne spectroscopy methods. 104 Schwartz et al. 59 indicated that the sun's angle, slope, and aspect might not be factors in the field if artificial illumination is used in a standard process. A contact probe equipped with tungstenhalogen illumination could be used, with caution. This is because the soil surface measured by such an instrument may consist of a very narrow field of view, which might not represent the soil in question but, rather, debris, stones, or even soil aggregation. In aircraft or satellite spectroscopy, even more problems arise while making such measurements to extract the correct reflectance, such as small integration time (fewer photons), strong atmosphere effects, large pixel size, and varying quality of the sensor's stability and sensitivity. 105 Another limitation of using airborne spectroscopy for soil analysis is its high cost, its limited availability, and the complexity involved in processing the raw data into a final reflectance product. These factors deter ordinary users from using this technology, which classifies it as a limited method. Vegetation coverage also creates difficulty for deriving correct soil reflectance from afar when it is in the sensor's field of view. 59
Another important concern about uncertainty in spectroscopy is its geographical scale (local, regional, or global). Sudduth and Hummel 33 and Stenberg et al. 1 mentioned that the geographical scale or the overall variation for which calibrations are representative evidently affects their accuracy. Guerrero et al. 106 also proved that small-size models could integrate the spectral characteristics of local samples more easily than large models and, as a result, should produce more accurate predictions. On the other hand, the predictive accuracy of a model can be inadequate when the same model is used on a regional or global scale; therefore, it is essential to be able to quantify the accuracy of the model. A clear implication of this is that a calibration of high generality on the regional or global scale may lack accuracy when used to predict variation on a local scale. 107 One general issue is the uncertainty of the measurements; another is how this uncertainty propagates through the model to the final product. 98
To overcome these and similar limitations, a number of strategies have been recommended. Some studies suggested that spiking local samples into general calibration models could improve predictive accuracy under laboratory or in situ measurement conditions (the complementation and recalibration of a calibration set using known samples representative of the studied area).108,109 The spiking of general or global calibrations has been proposed and has produced positive results for moving a calibration from one geographical region to another on the country level 110 and field level, 111 and has improved the performance for a small catchment using a global calibration 107 and at three landscape sites. 112
CONCLUSION
There are several soil attributes that often are well estimated with Vis-NIR and mid-IR spectroscopy. The most obvious ones are clay content, SOC and SOM content, and soil water. Extensive research has demonstrated that Vis-NIR and mid-IR reflectance spectra contain remarkable information related to soil attribute quantity and quality. Research showed that, for the determination of SOM, mid-IR spectroscopy is often more accurate and produces more robust calibrations than Vis-NIR spectroscopy when ground soils are analyzed under laboratory conditions and even in the field using sampling. Finding suitable data pretreatment and calibration strategies for the application of Vis-NIR or mid-IR spectroscopy is dramatically significant. This paper reviewed developments in pretreatment and calibration methods and concludes that smoothing (mostly Savitzky–Golay) and LS-SVM algorithms lead to over-optimistic performance in the assessment of SOM. The development of global soil spectral libraries is urgent to improve the predictive ability of spectroscopy for soil attribute quantity and quality, whatever the soil type. However, for this to be achieved, it is necessary that the data used be of high quality, with stated levels of accuracy and uncertainty, and that common protocols be developed to ensure the long-term value of the spectroscopic data. Inaccuracy and uncertainties occur at the different steps in the prediction procedure: soil sampling, spectral collection, predictive model building (choosing the number of training samples and model parameters), and final spatial prediction. The accuracy of the resulting models can be insufficient for the planned purpose; therefore, it is important to be able to assess the accuracy of the process. This will be a significant step toward helping users of soil data and models address and manage uncertainty instead of ignoring it. There are many questions that still remain to be answered before we can move this technology from local research to global use and from samples in a single study to broad, practical calibrations. Internal standards, a standard protocol, and controlled conditions are a few of the factors that can assist in researchers' sharing and comparing soil spectra worldwide. The standardization of Vis-NIR and mid-IR spectroscopy calibrations would allow the identification of soil properties, including SOM quantity and quality, that are possible to predict using spectroscopy and those that are not, and it would lead to an enhanced acceptance of Vis-NIR and mid-IR spectroscopy in soil analyses. This information, when properly and logically linked, will constitute knowledge. Knowledge guides policy and decision making.
Footnotes
ACKNOWLEDGMENTS
The authors acknowledge the financial support of the EC Operational Program (Project No. ESF/MEYS CZ.1.07/2.3.00/30.0040) and the Czech University of Life Sciences Prague. We also express our gratitude to Karel Němeček and Christopher Ash for their valuable assistance.