
Abstract
We report temperature inferences from time-resolved emission spectra of a micro-sized plasma following laser ablation of an aluminum sample. The laser-induced breakdown event is created with the use of nanosecond pulsed laser radiation. Plasma temperatures are inferred from the aluminum monoxide spectroscopic emissions of the aluminum sample by fitting experimental to theoretically calculated spectra with a nonlinear fitting algorithm. The synthetic spectra used as a comparison for the experimental spectra are generated from accurate line strengths of aluminum monoxide bands. The inferred plasma temperatures are found to be 5315 ± 100 K at 20 μs following breakdown. At later time delays of 45 and 70 μs following breakdown, the plasma temperatures are found to be 4875 ± 95 and 4390 ± 80 K, respectively. Error analysis of the inferred temperatures is performed with the fitting algorithm.
INTRODUCTION
In laser-induced breakdown spectroscopy (LIBS) experiments, laser radiation is tightly focused onto a sample with sufficient irradiance to induce breakdown and subsequently produce a micro-sized plasma. Light emitted by the laser-induced plasma is dispersed, and the unique spectroscopic signals of the sample may be observed. Over the past few decades, the LIBS experimental technique has garnered interest in a wide variety of fields for its relative experimental ease, low operating cost, and portability. Common LIBS efforts focus on using a sample's LIBS signal as a means of identification. Such efforts have used broadband spectroscopic emissions from laser-induced plasmas to identify a sample by the light emission of species present in the plasma. Other analyses of LIBS spectra have proven to be far more quantitative when using the LIBS experimental approach. In particular, analysis of aluminum LIBS is popular in many fields of study.
Quantitative analysis of spectral emissions from LIBS experiments has been performed in a multitude of studies. Such studies involve investigations of both atomic and molecular spectral emissions from laser-induced plasmas. Studies of atomic line emission spectra commonly use observed line broadening effects to infer electron number density and line intensity ratios to determine excitation temperature, while studies of molecular spectra may be used to infer plasma temperature. 1 A common industrial application of LIBS with aluminum samples is to quantitatively study the purity of aluminum alloys and determine the difference between molten and solid aluminum alloys by way of studying line broadening in aluminum atomic emission lines.2,3 Studies of the temporal evolution of aluminum laser-induced plasmas have also been performed. One such study considered laser ablation of an aluminum rod in the presence of different bath gasses. 4 The intensity ratios of aluminum atomic lines were used with Boltzmann plotting methods to determine plasma temperature as a function of time delay. Temperatures were found to be on the order of 4000 K for air breakdown at time delays on the order of tens of microseconds following laser-induced breakdown.
In addition to using atomic lines to infer plasma temperature, diatomic molecular emissions may also be considered for this application. Aluminum monoxide (AlO) is a diatomic molecule commonly used to probe aluminum laser-induced plasmas as AlO is an early, intermediate product in the oxidation of aluminum. AlO was utilized to determine plasma temperatures in the laser ablation of an aluminum sheet in a spatial and temporal study of aluminum micro-plasmas. 5 Temperatures were reported to be 4250 K for all investigated time delays. In a study to investigate the use of aluminum LIBS as a diagnostic for micromachining, the use of AlO as a temperature probe was also investigated.6,7 Plasma temperatures were found to be on the order of 4000 K at a time delay of 50 μs following breakdown.
In the present study, aluminum monoxide emissions are recorded from an aluminum laser-induced plasma for various time delays and gate widths. AlO emissions are used to infer plasma temperature to investigate for the potential of AlO emissions as a probe to characterize the temporal evolution of the laser-induced plasma's temperature.
EXPERIMENTAL DETAILS
Time-resolved aluminum monoxide emission spectra were collected following a laser-induced optical breakdown event on the surface of an aluminum sample. The aluminum sample was ablated with 1064 nm pulsed laser radiation from a neodymium-doped yttrium aluminum garnet (Nd:YAG; Quanta Ray) laser operating in its fundamental mode with an energy of 190 mJ per pulse. The pulse width of the laser is 12 ns and has a focused spot size of approximately 50 μm. Following the breakdown event, light from the laser-induced plasma is focused onto the slit of a spectrometer (Jobin Yvon HR 640) with a Czerny–Turner type spectrograph installed with an 1800 grooves per millimeter grating. The dispersed light is collected with an intensified, linear diode array (Princeton Instruments 1460) coupled to an optical multichannel analyzer (OMA). The OMA is also coupled with a delay and waveform generator to achieve time-resolved measurements with the intensified, linear diode array. Figure 1 shows a schematic of the experimental apparatus used to collect the spectral data. Reference 8 provides a more detailed description of the experimental apparatus used in this work and also for previous measurements of atomic and molecular spectra. 8 Of interest is the aluminum monoxide B 2 Σ+ → X 2 Σ+ diatomic transition. Of specific interest is the Δν = 0 region of the transition with a band head near 484 nm. In this wavelength region, with the specified spectrometer-detector arrangement, the spectral resolution is 0.1 nm. This parameter is determined from the physical limitations of the apparatus that result from contributions of the size of the entrance slit on the spectrometer, the groove density of the grating, and pixel size of the detector and is determined with standard calibration lamps. Each spectra is the representation of 100 breakdown events on the aluminum target. This is done to reduce the effects of single shot variations on the experimental spectra and maximize the reproducibility of each collected spectra. Prior to analysis, the collected spectra are calibrated for both background and detector sensitivity through comparison to standard calibration lamps.
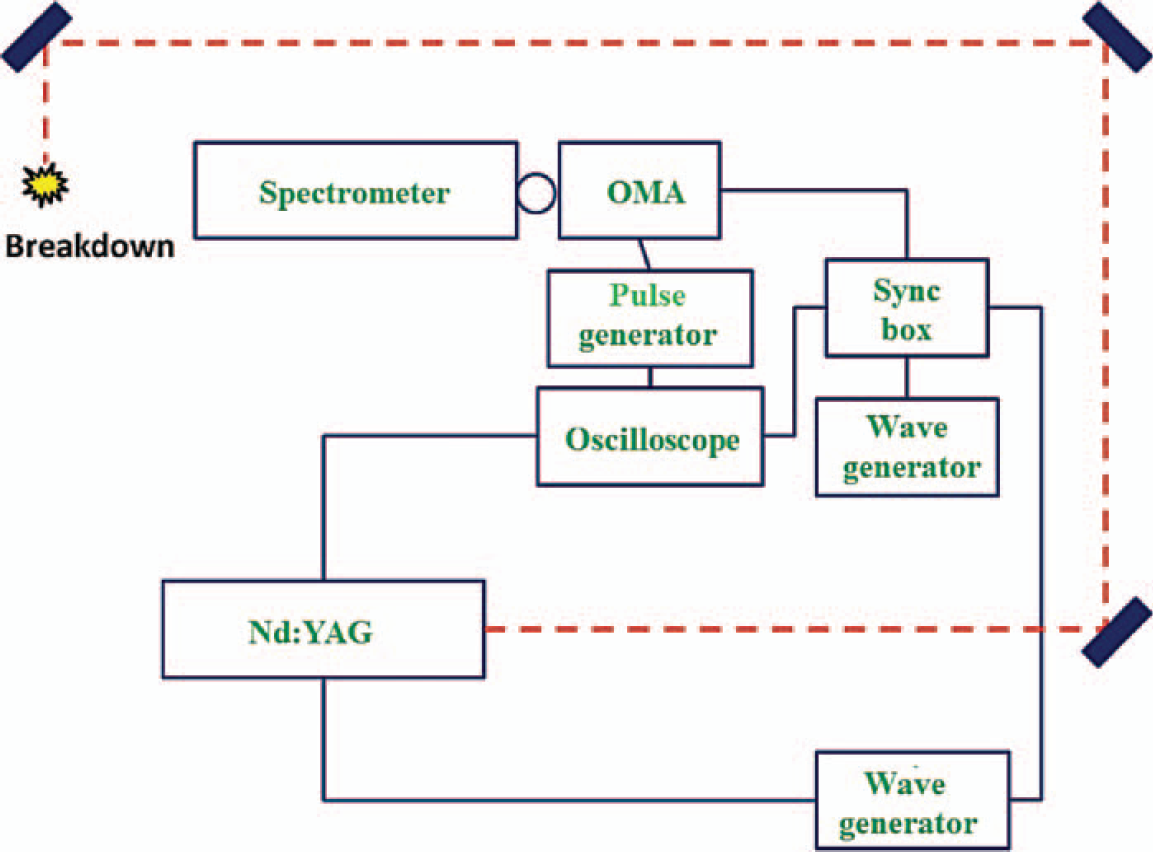
Schematic of the experimental apparatus.
RESULTS
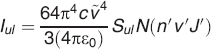
Following the laser-induced breakdown event on the surface of an aluminum sample, the aluminum monoxide B 2 Σ+ → X 2 Σ+ diatomic molecular transition is investigated as a means of inferring plasma temperature. The intensity of diatomic molecular spectra are known to be temperature dependent, and thus, fitting experimental spectra to theoretically calculated spectra from accurate line strengths may be performed to infer the plasma temperature from the diatomic emissions.9,10 The line strength Sul of a transition from upper state u to lower state l is the sum of all degenerate diatomic states that produce the same spectral line and is related to the line intensity by
where N(n′v′J′) is the number of excited molecules, which is temperature dependent, and ν˜ is the transition wavenumber in vacuum. The diatomic state is defined by the quantum numbers n, v, J, and M for upper and lower states, where J and M represent their typical angular momentum quantum states, v represents the vibrational state, and n is an index used to represent all other relevant quantum numbers. The formal definition of the line strength is given as
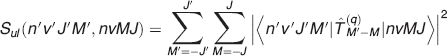
where the primed values represent the upper transition state and the unprimed values represent the lower transition state. The operator
Diatomic spectra are calculated by determining the positions of all possible transitions, invoking selection rules to determine allowed and forbidden transitions, the Hönl–London factors S(J′,J) are calculated, potential energy curves for allowed upper and lower transitions are determined, the Schrödinger equation is solved numerically to determine the Franck–Condon factors q(v′,v), and the Hönl–London, Franck–Condon, and electronic transition strength are combined to form the total line strength. Rather than invoking the tedious process of using numerous selection rules for calculating diatomic spectra, only one selection rule is used in this study. An allowed transition is one for which the line strength is non-vanishing, and a forbidden transition is one for which the line strength vanishes. Numerically, the diatomic line strength is factored as described above and is calculated from

where Selectronic(n′v′,nv) is the electronic transition strength. The Franck–Condon factors are found by numerically solving the Schrödinger equation, and the Hönl–London factors are found from the diagonalized Hamiltonian for rotational and fine structure. Though both the Franck–Condon and Hönl–London factors may become appreciably small, it is the Hönl–London factor that determines if the line strength is analytically zero and thus determines allowed and forbidden transitions. Temperatures are inferred with a nonlinear fitting algorithm by considering the intensity that is incident on a single detector pixel. At high number densities and high temperatures, with the time delays and gate widths employed in a typical LIBS experiment, thermal equilibrium of rotational and vibrational emissions are assumed.
Nonlinear fitting in this work is accomplished with the use of a Nelder–Mead algorithm which employs a downhill simplex fitting method that uses initial guesses for the parameters of interest through the creation of a geometrical simplex.11,12 The number of vertices in the simplex is one more than the number of parameters being minimized. The size of the simplex is reduced iteratively by moving the positions of the vertices of the simplex until a user-defined minimum tolerance level is achieved and corresponds to a minimized value for each of the parameters of interest. This algorithm was chosen because of its ability to incorporate multiple parameters into the fit as well as for its ability to allow for a variable baseline offset of the fit. Constant, linear, and quadratic baseline offsets were considered in this investigation. It was found that the offsets of the spectra were slightly quadratic with the magnitude of the coefficients for the linear and quadratic terms found to be at least an order of magnitude smaller than the constant term. The quadratic offset produced the best fit because it best captured the background of the spectra which includes edge effects from the detector arrangement and the continuum background the AlO spectra is superimposed upon.
For a given spectrometer-detector arrangement, initially, the temperature of the plasma was the only varied parameter while fitting diatomic spectra. The resolution parameter was also considered while fitting the experimental spectra. Initial temperatures were inferred using the determined resolution of 0.1 nm and were fit to the spectral region of 483.3 to 498.5 nm which corresponds to the usable region of the spectrometer-detector arrangement. Errors for a single temperature inference may arise from any of the parameters used for fitting. Of particular interest in this work are variations in the linear and quadratic terms of the baseline offset and the spectral resolution. It was found that order-of-magnitude changes in the linear and quadratic terms of the baseline offset produced variations in the inferred temperature typically between 1–5 K from the initially inferred temperature. Uncertainty from varying the resolution was determined by considering resolutions of 0.08, 0.09, 0.1, 0.11, and 0.12 nm which represent an increase and decrease of the resolution by 1 and 2 pixels. Physically, this error encompasses slit width and detector effects as well as minor inaccuracies present from the wavelength calibration. The effect of varying the resolution was found to be between 75–95 K.
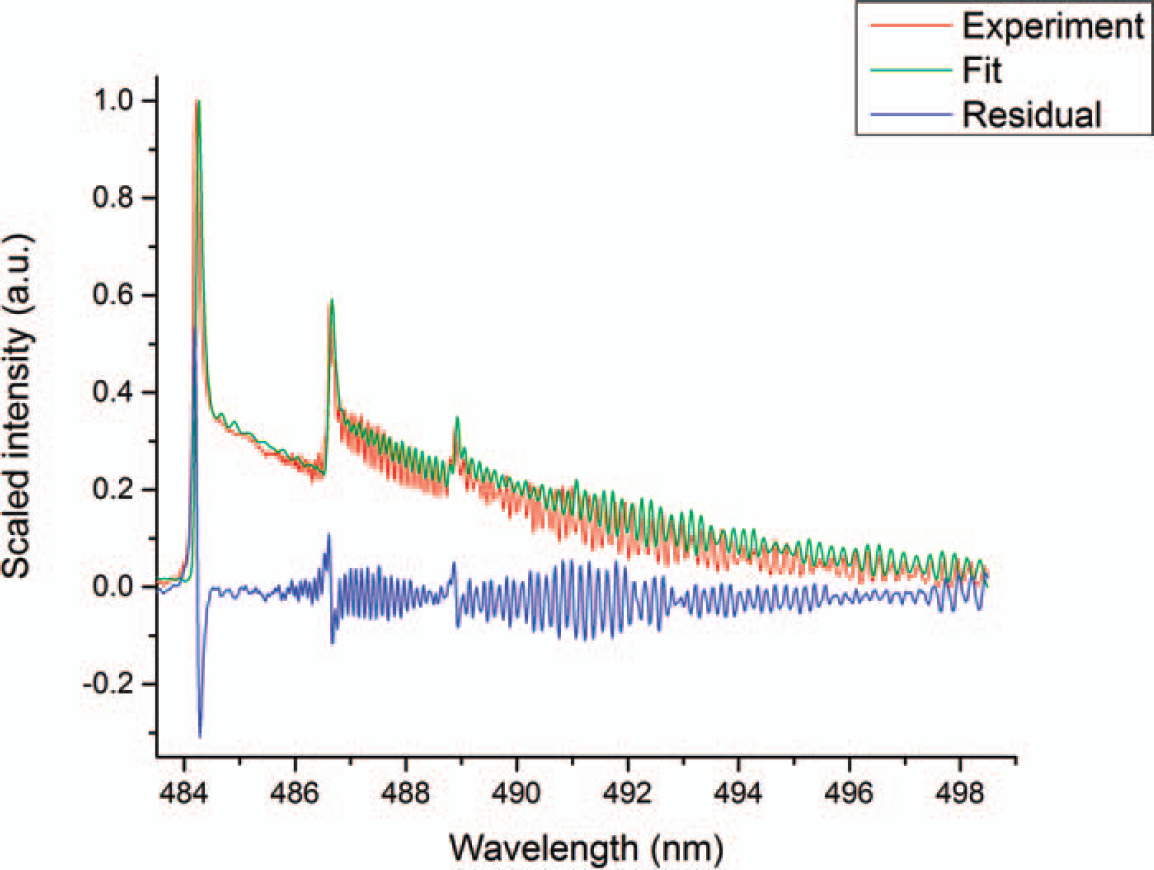
Plasma temperatures are determined for 20, 45, and 70 μs time delays following laser-induced optical breakdown. The earliest time delay that AlO emissions are observed in our plasma emissions are on the order of tens of microseconds following breakdown. Early in the plasma decay, free electron radiation and aluminum atomic emissions dominate the observed emission spectra. Following this period, diatomic molecules are excited, and their spectra are readily observed. Using the described fitting method, the plasma temperatures are found to be 5315 ± 100 K at 20 μs following breakdown. Later in the plasma decay, temperatures are found to be 4875 ± 95 K and 4390 ± 80 K for 45 and 70 μs delays, respectively. Figures 2 and 3 show the AlO temperature fitting results for the investigated time delays of 25 and 70 μs for a resolution of 0.1 nm. Though the two plots appear to be qualitatively similar, the measurement made at 20 μs shows a larger continuum background in the residual than the measurement made at 70 μs. This indicates that the plasma is hotter at the earlier time delay which is particularly noticeable in the wavelength region of 484 to 488 nm in Fig. 2. Also seen in the residual of the two figures is the appearance of rotational and vibrational characteristics. These are present due to minor inaccuracies in the wavelength calibration, and though these errors are well within the tolerable level, they will affect the reportable spectral resolution. The appearance of rotational and vibrational characteristics in the residual also supports varying the resolution as a potential source of uncertainty.
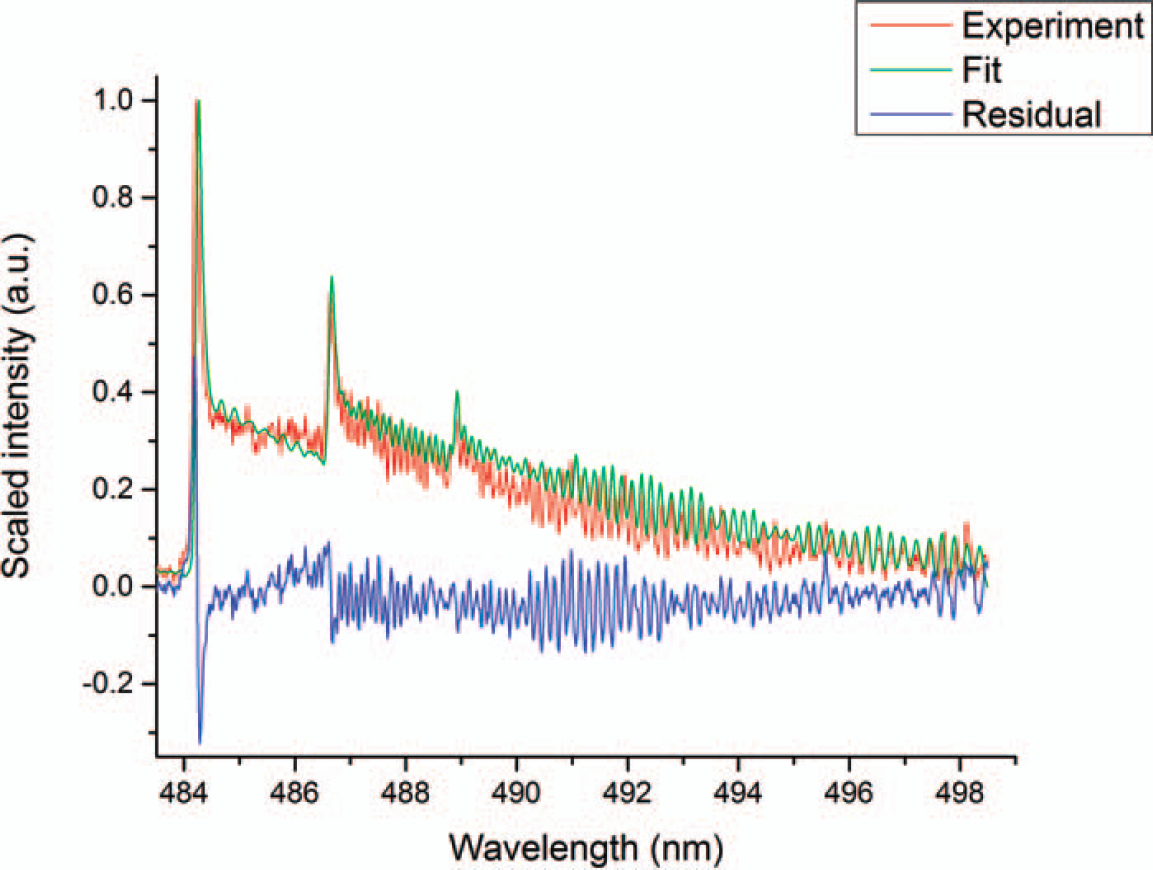
Fitted experimental AlO spectra at a time delay of 20 μs and gate width of 1 μs and a resolution of 0.1 nm.
Fitted experimental AlO spectra at a time delay of 70 μs and gate width of 10 μs and a resolution of 0.1 nm.
The quality of a particular fit is determined through considerations of the quality of the wavelength calibration. As mentioned, the wavelength calibrated spectra do not exactly align with experimental spectra. This is physically possible due to shifts of the frequency from an emitting source within the plasma; however, the best possible match between a fit and the experiment was sought since wavelength shifts are expected to be small for the temperatures of the plasma at the considered time delays. A quality wavelength calibration equally considers proper matching to vibrational and rotational spectra. Though the standard deviation of each fit is calculated during fitting, a minimized deviation did not always correspond with the best wavelength calibration. The best possible wavelength calibration was determined by visually inspecting which calibrations best matched both vibrational and rotational spectral aspects.
DISCUSSION
Fitting of the AlO spectroscopic signal has been used to infer the temperature of laser-induced plasma on the surface of an aluminum sample for various time delays following laser-induced breakdown. The temperature of the plasma is found to decay from 5315 to 4390 K from 20 to 70 μs following optical breakdown. The inferred temperature value of 4875 K at a time delay of 45 μs is significantly higher than the temperature values of 4000 to 4250 K that are found in the literature at similar time delays. In this scope, the three inferred temperatures from this study represent an upper value of the plasma temperature at each of the measured time delays. The determined temperatures do, however, give insight to the temporal decay of the plasma temperature. The temperature of the plasma is expected to decay with increasing time following optical breakdown. Early in the plasma decay, on the order of a few hundred nanoseconds following plasma initiation, the temperature of the plasma is expected to be as large as 50 000 K. 1 As recombination of electrons with ions occurs, the temperature of the plasma will become low enough for molecules to form after tens of microseconds following breakdown. The temperature of the plasma is expected to decay exponentially as a function of time. Early in the plasma, the temperature is expected to decay more rapidly than at later delay times. The temperatures determined in this work show a relatively linear temperature decay, though finer-grained temporal measurements are required to make a supposition of the function that describes the temperature decay.
The errors in the inferred temperatures were found by considering variations introduced by the fitting method and do not account for variations in the temperature that result from multiple temperature inferences. One would expect the error to be in the ±150 K range to account for both the uncertainty introduced from the fitting algorithm and uncertainty from multiple measurements, as it is unlikely that multiple spectra produced from a laser-induced breakdown event will be exactly the same every time a measurement is made. When considering the error introduced from making multiple measurements, the reported temperature inference errors from the current error analysis will likely increase by as much as 50 to 70 K. Additionally, not all of the variable parameters from the fitting algorithm have been considered. A complete error analysis of the fitting algorithm should include variations in the initial temperature used to seed the algorithm, the tolerance, and the wavelength range of the fit. A complete characterization of the error should be the subject of further studies in which both the uncertainty from the fitting algorithm and multiple measurements are considered.
The accuracy of fitting diatomic molecular spectra is also of concern due to temperature differences that may arise when considering rotational versus vibrational structure in diatomic molecules of interest. The vibrational structure of diatomic spectra is more susceptible to external influences than the rotational structure. Though this effect is not quantitatively investigated in this work, it was considered during analysis of diatomic spectra. This effect has been observed in the study of astrophysical sources of aluminum monoxide in which background emissions from asymptotic giant branch stars have affected observations of AlO diatomic spectra in the surrounding circumstellar dust clouds. 13 Fitting of rotational structure in this instance yielded a temperature that was 1500 K lower than fitted vibrational structure. Similarly, background influences due to the plasma may affect the vibrational structure of AlO spectra. Careful attention has been paid to this effect while fitting diatomic spectra. The emphasis of a good fit was placed on properly fitting rotational structure even at slight costs to fitting vibrational structure. The effect that has been observed in the experimental spectra collected in this work was found to be on the order of 200 to 400 K. Future investigations of diatomic AlO fitting will seek to further quantify this effect.
CONCLUSIONS
In this work, laser-induced optical breakdown has been achieved on the surface of an aluminum sample by tightly focusing radiation from an Nd:YAG laser. Following breakdown, the temperature of the plasma is found for various time delays and gate widths by fitting experimental diatomic AlO spectra to theory spectra. In this work, inferred temperatures are found to be 5315 ± 100, 4875 ± 95, and 4390 ± 80 K for 20, 45, and 70 μs time delays, respectively, following laser-induced breakdown on the surface of an aluminum sample. The determined temperatures show that the plasma temperature decays through delay time as expected. Error analysis of the temperature inferences was accomplished with the fitting algorithm in which the variable baseline offsets and the spectral resolution were considered as sources for error. Future experiments and analysis will seek to further quantify the error in reported temperatures by considering more sources of error from the fitting algorithm and errors from multiple temperature inferences. Further analysis and investigation of time-resolved AlO spectra from a laser-ablated aluminum sample will also be performed with more temporal detail to better determine the temporal decay of the plasma temperature.
Footnotes
ACKNOWLEDGMENT
This work is supported in part by the Center for Laser Applications at the University of Tennessee Space Institute.