






Abstract
The detection of manganese (Mn) in industrial wastewater and seawater plays an important role in pollution monitoring and the investigation of geochemical and biological processes in the ocean. An approach has been introduced in this work to improve the detection sensitivity of Mn in liquids by laser-induced breakdown spectroscopy with a filter paper as solid substrate. The calibration curves of Mn in aqueous solutions were obtained with the detection of a Czerny–Turner spectrometer and an echelle spectrometer, respectively. The results showed that the Czerny–Turner spectrometer equipped with an intensified charge-coupled device (ICCD) had a more sensitive detection of Mn in aqueous solution with this approach. The limit of detection (LOD) for Mn was down to 0.11 mg/L with laser pulse energy of 90 mJ. With the same approach, the compact echelle spectrometer equipped with an ICCD was used to verify the feasibility for rapid onsite detection. The calibration curves for Mn in simulated industrial wastewater and seawater were constructed to calculate relevant LODs. The LODs of Mn were 2.78 mg/L in mixed solutions and 2.73 mg/L in seawater by calculation. Both the calibration curves and LODs were affected slightly by the matrix effect in the experiment. In order to assess the accuracy, a mixed solution including Mn, Cr, Cd, and Cu with known concentrations was determined, and good agreement between the measured and real values were achieved. It demonstrated that this approach has significant potential for rapid onsite detection of Mn and other metal elements in industrial wastewater and seawater.
Keywords
INTRODUCTION
Manganese (Mn) as a heavy metal element could be extremely harmful to the aquatic environment when exceedingly dissolved in both industrial wastewater and seawater. 1 The minimum concentration of Mn tolerable in industrial wastewater discharged is usually no higher than 10 mg/L depending on the type of discharge (domestic, industrial). 2 Additionally, the geochemistry of Mn in the ocean attracts the attention of investigators to determine its key role in geochemical and biological processes.1,3 Consequently, the determination of manganese levels in industrial wastewater and seawater is greatly important and necessary. Conventional analytical techniques for Mn in water are accomplished mainly in the laboratory, such as inductively coupled plasma mass spectrometry (ICP-MS) and atomic absorption spectroscopy (AAS). However, due to the presence of a complex matrix, these approaches are time consuming and demanding in sample preparation for precise results.4,5 Therefore, a technique is imperative for onsite element detection of industrial water and seawater with rapid quantitative determination.
Laser-induced breakdown spectroscopy (LIBS) has drawn growing attention in the past tens of years as a rapid, online, sensitive, and multi-elements analysis method with little or no sample preparation.6,7 It has been extensively used for a wide range of scientific and industrial applications with different degrees of success.8–11 However, due to the complex process of the ablation in bulk, the lifetime of plasma is relatively short, which results in poor detection sensitivity compared with that in air.7,12
In order to improve the detection sensitivity of liquid samples, a variety of methods have been developed with different degrees of success. Converting a liquid sample into a solid one has been proved as an efficient way to increase the LIBS sensitivity, and typical conversion methods correspond to freezing of a liquid sample, 13 adding liquid drop-wise or collecting its residual onto a filter paper,14–17 incorporating a liquid in a powder before making a solid pellet, 18 using ion exchange polymer membrane, 19 or obtaining a dried deposition of a liquid on a solid surface.20,21 The last method has been recently revisited as a surface-enhanced LIBS technique, which takes the advantages of plasma induced on a metallic surface. 22 In this work, a filter paper substrate was used to absorb aqueous solution samples. Having compared the paper substrates used in Refs. 15–17, it could be seen that the wet paper substrate did not have to be dried using a hot air blower and then cooled down to room temperature before detection directly. The limit of detection (LOD) of lead in aqueous solution (3.87 mg/L) had been obtained, 23 lower than those obtained with the similar methods above.
In this work, Mn in aqueous solution and seawater are detected using the paper substrate. The calibration curves of Mn in aqueous solutions are obtained with a Czerny–Turner spectrometer and an echelle spectrometer. The LODs obtained with this method will be further compared to those previously reported using other similar methods. In order to verify the feasibility of rapid onsite detection with this approach, the compact detection system (an echelle spectrometer equipped with an intensified charge-coupled device (ICCD)) was used, and the calibration curves and LODs of Mn in simulated industrial wastewater and seawater could be obtained. These investigations are used to achieve a more sensitive detection of Mn and other heavy metals in laboratory and develop a feasible and sensitive method for rapid onsite detection of Mn and other heavy metals in industrial wastewater and seawater by LIBS.
EXPERMENTAL
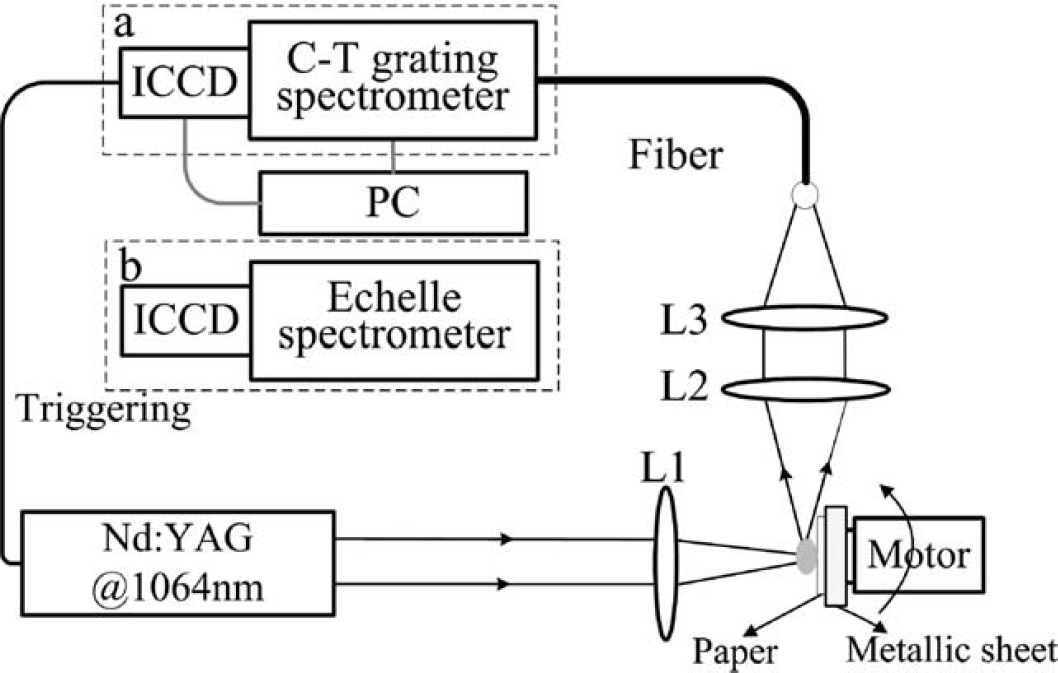
Schematic diagram of the LIBS experimental setup.
For a better performance in quantitative analysis, repeatability of measurement is highly valued. Notice that the metallic sheet contained Al mostly and some traces such as Cu. With only one-layer paper adhered, the metallic sheet is at high risk of ablation from the laser cutting through. The spectral lines of elements from the sample were thus interfered by the emissions evaporated from the metallic sheet. In this work, such repeatability was evaluated by observing the variation of the Cu I 324.75 nm line with a Cu concentration of 200 mg/L in solutions as different measurement replications were performed. The obtained results were presented in Fig. 2. In Fig. 2a, the Cu I 324.75 nm line intensities obtained from one-layer paper were higher than those of two-layer because one-layer paper was broken slightly to ablate the metallic sheet, which enhanced Cu I 324.75 nm line intensities but decreased the data reliability and reproducibility. The line intensities obtained with the two-layer paper were similar with those obtained when one-layer paper was adhered on the glass sheet, shown in Fig. 2b. However, the relative standard deviation was improved from about 10 to 5.1% in comparison with one-layer paper. Therefore, two-layer paper was a better choice for quantitative analysis in this experiment. As can be seen in Fig. 3, two photos were taken showing two-layer paper on the metallic sheet before and after laser ablation. The surface morphology of the filter paper exhibited good uniformity after ablation and made it possible to obtain good data reliability and reproducibility.
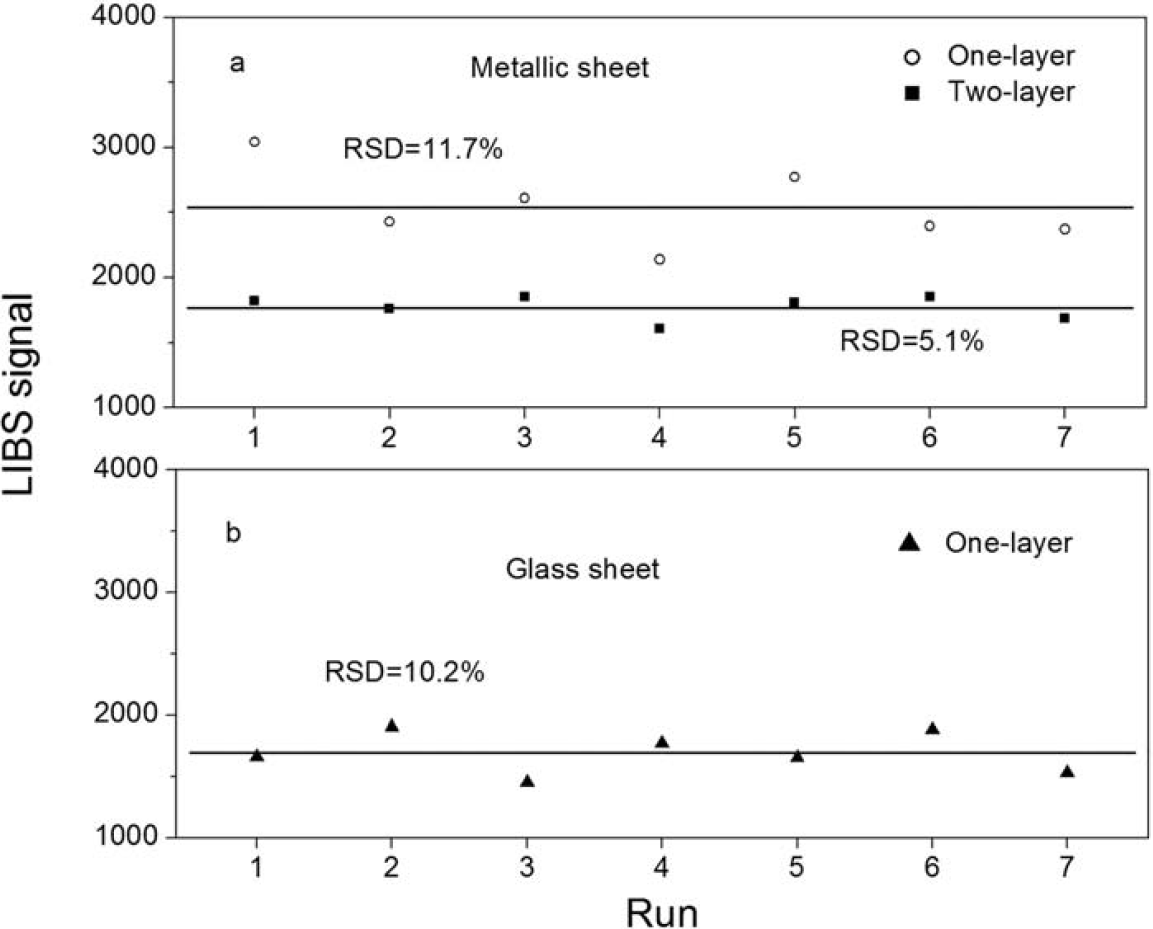
The repeatability assessment carried out under the same experimental conditions: (
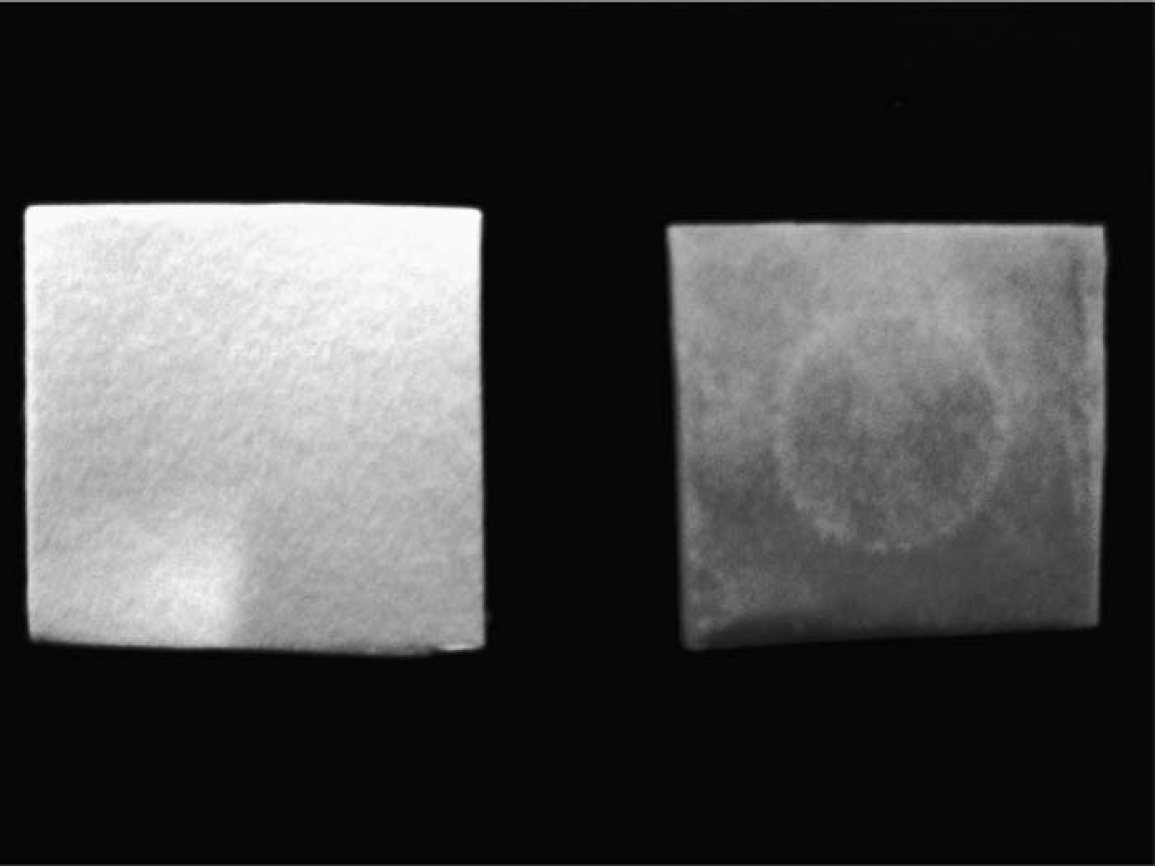
The surface morphology of filter paper before and after laser ablation.
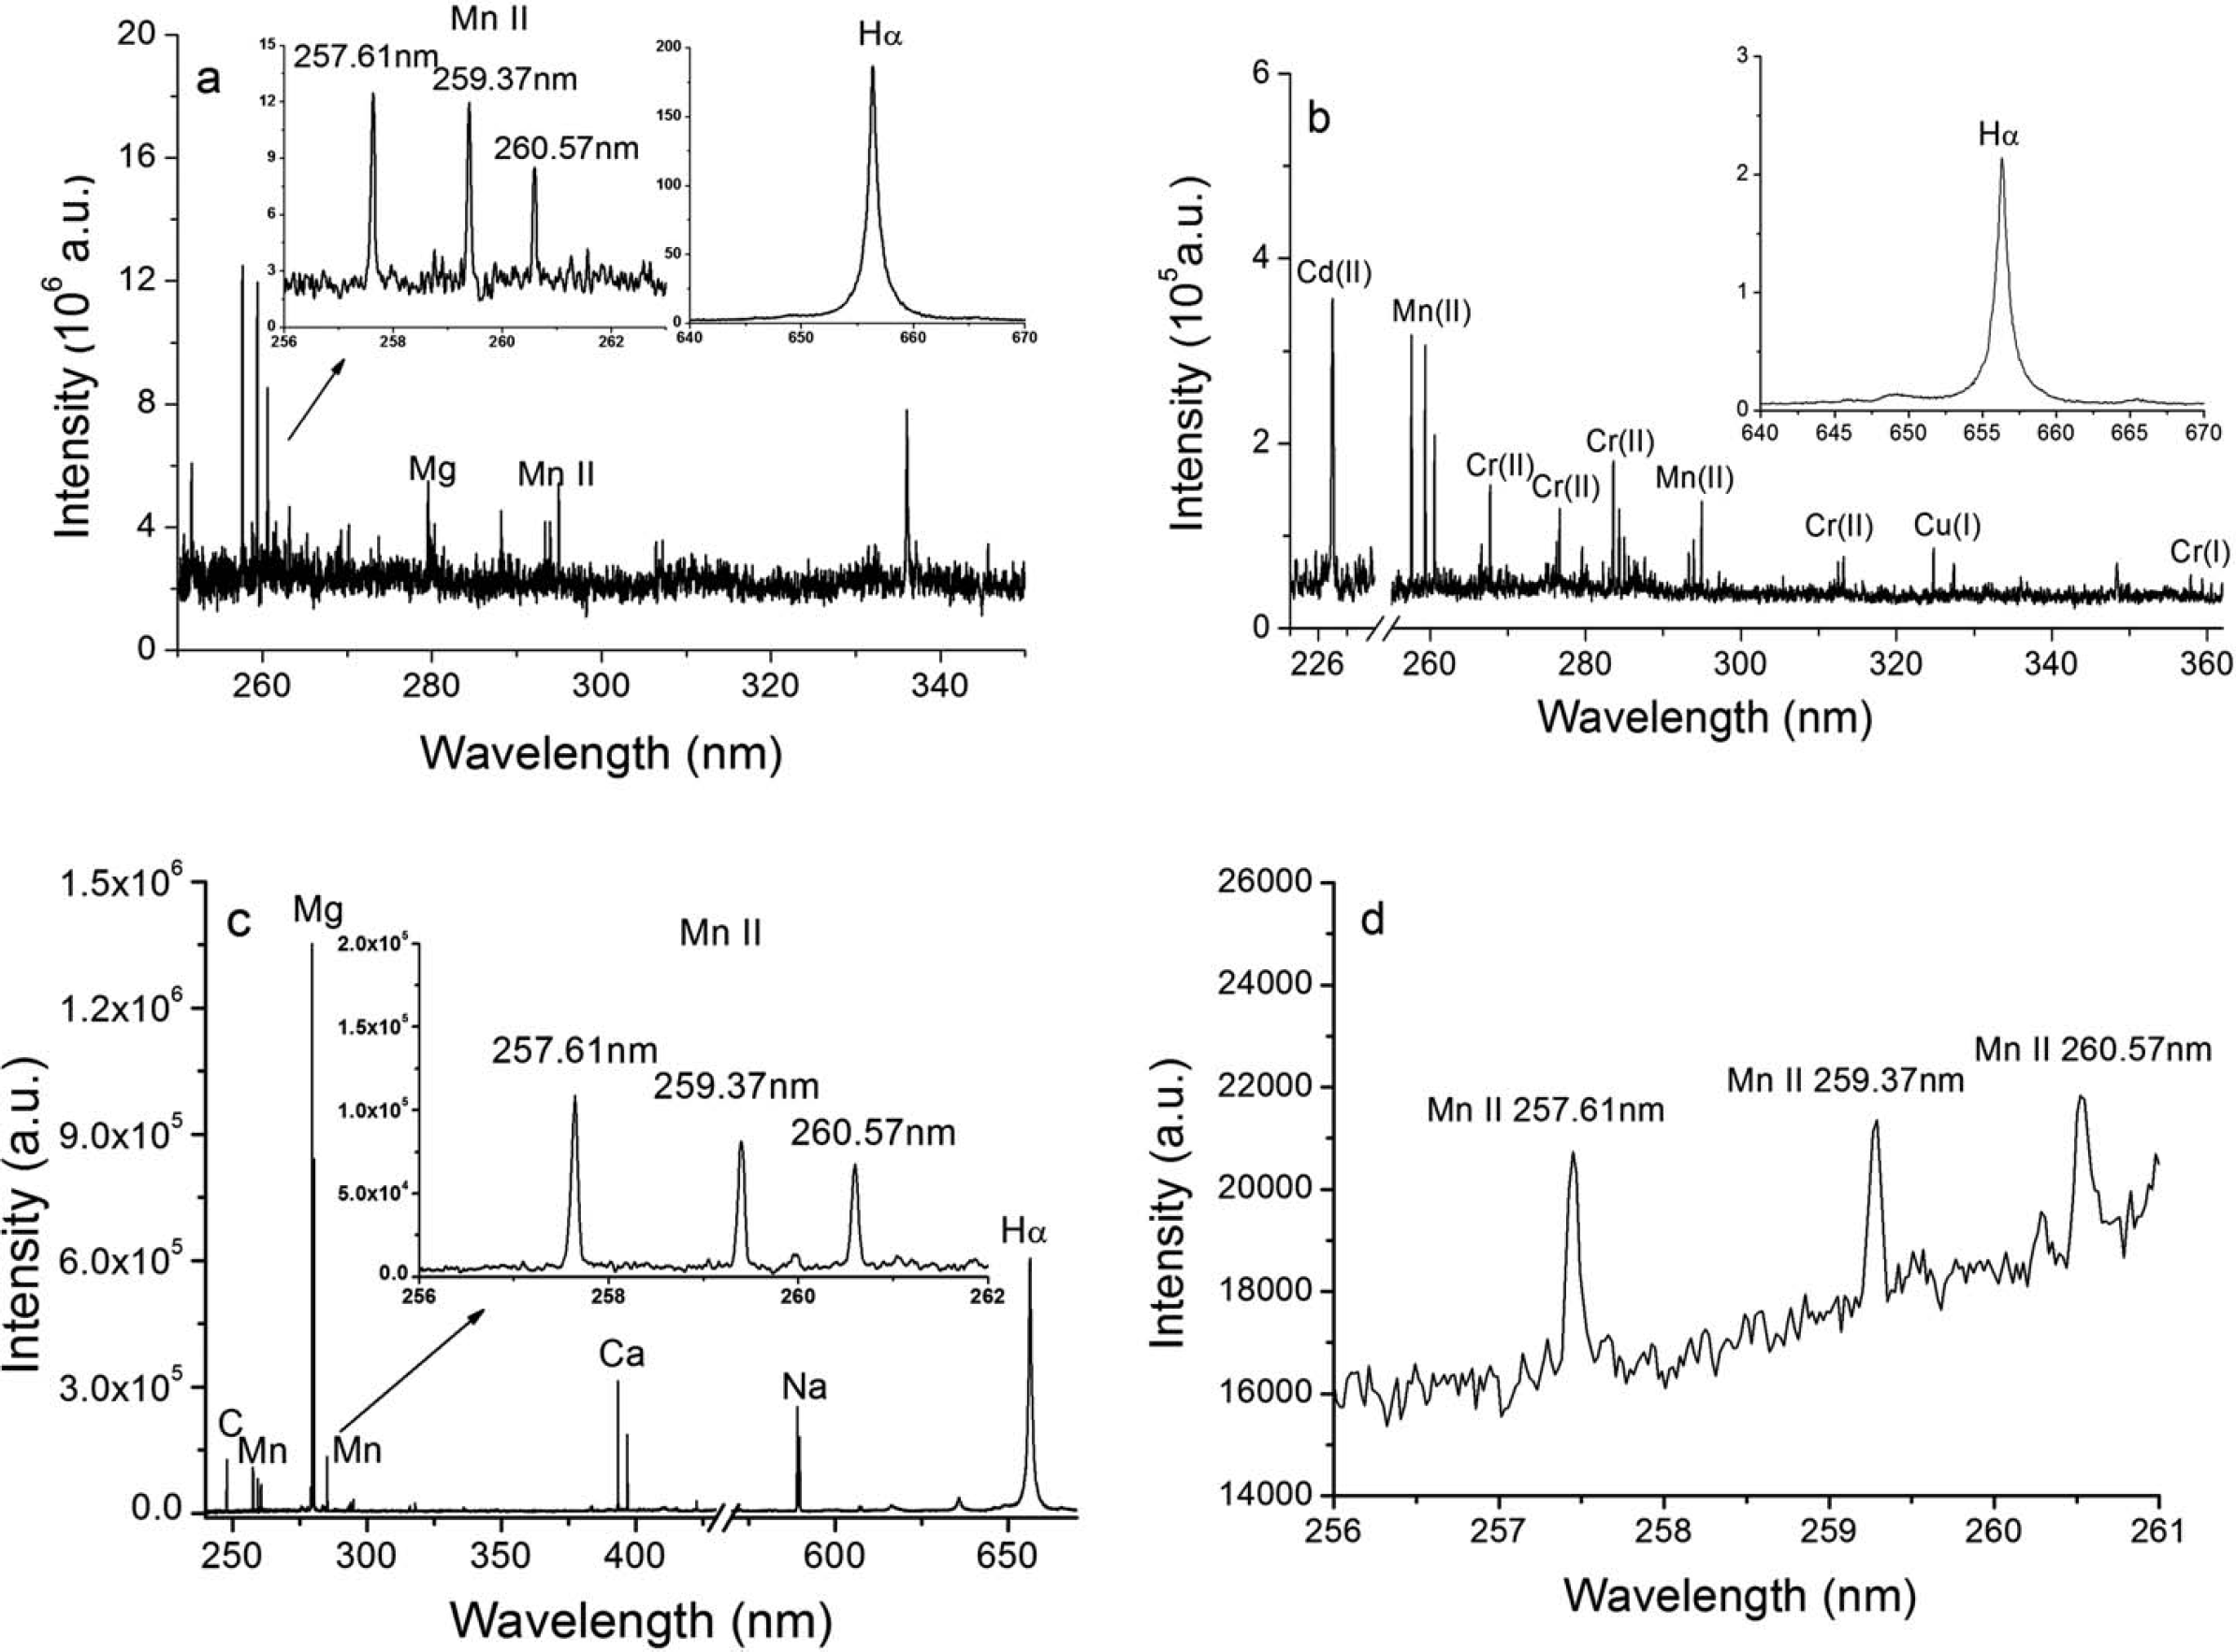
The typical LIBS spectra of Mn in different aqueous solutions detected with the echelle spectrometer: (
RESULTS AND DISCUSSION
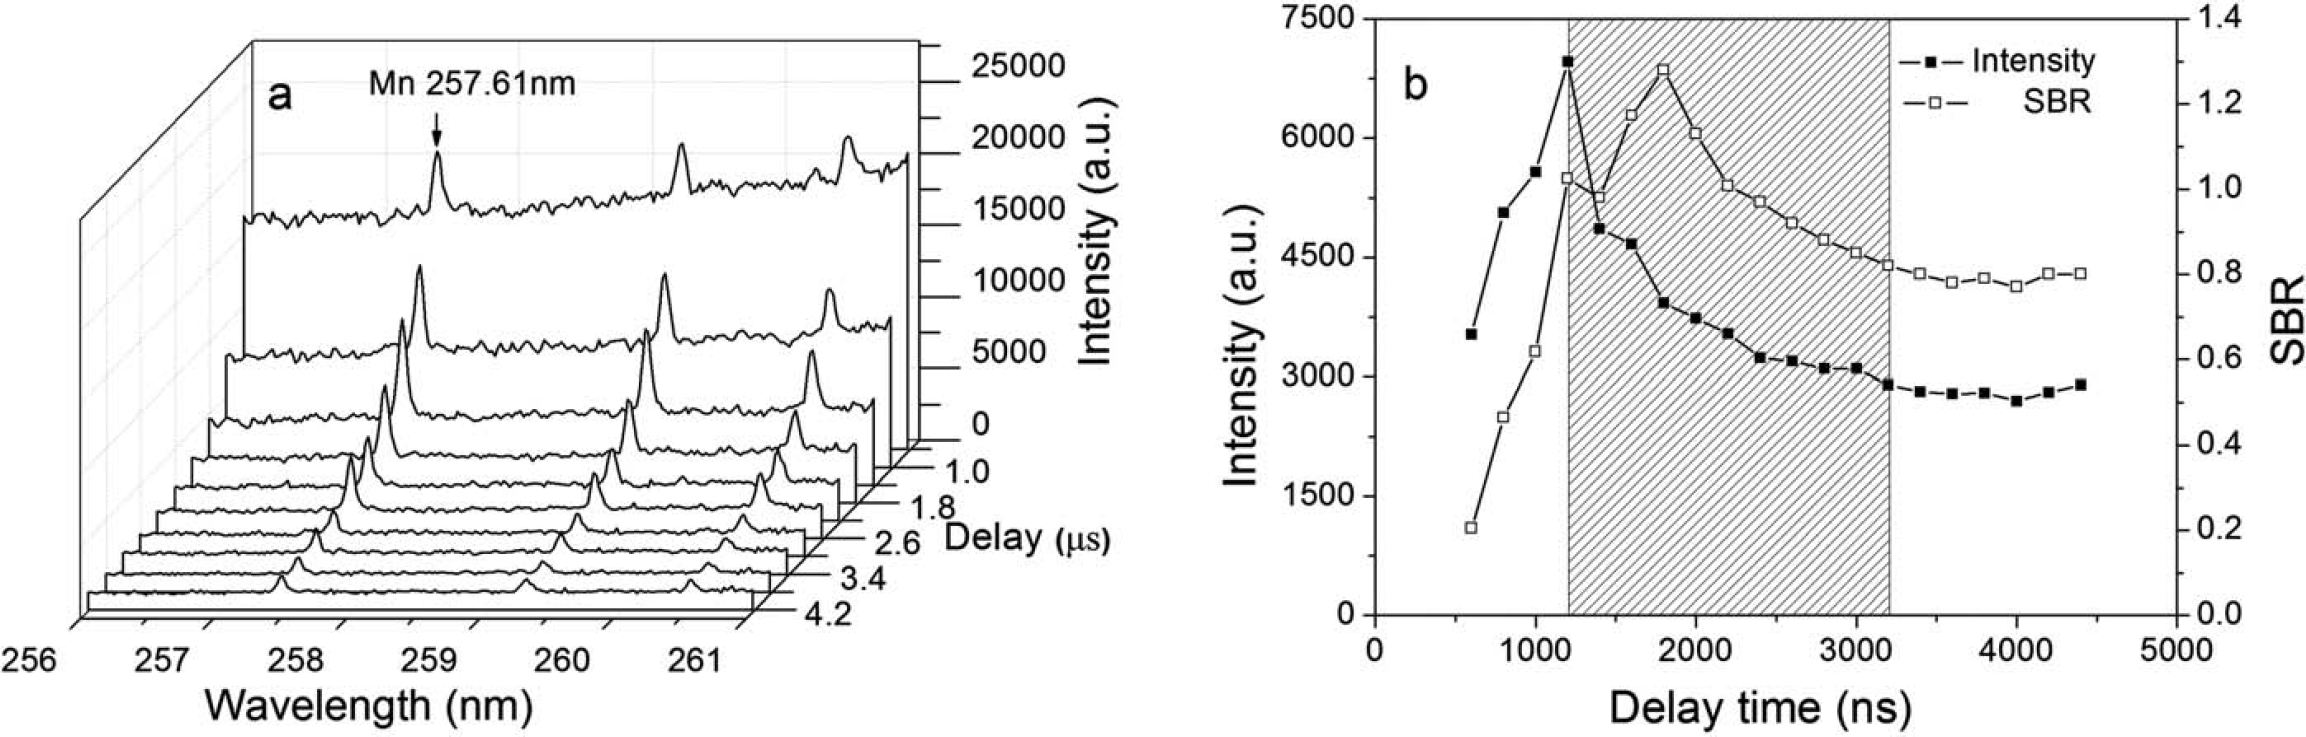
Temporal evolution of LIBS emission of Mn in MnCl2 solution taken with a gate width of 200 ns and the step of 200 ns: (
For quantitative analysis, the calibration curves would be constructed with the optimized experimental parameters. Figure 6 shows the calibration curves of Mn under different concentrations for different laser pulse energies (30, 60, and 90 mJ). The calibration curves are fitted with a linear function
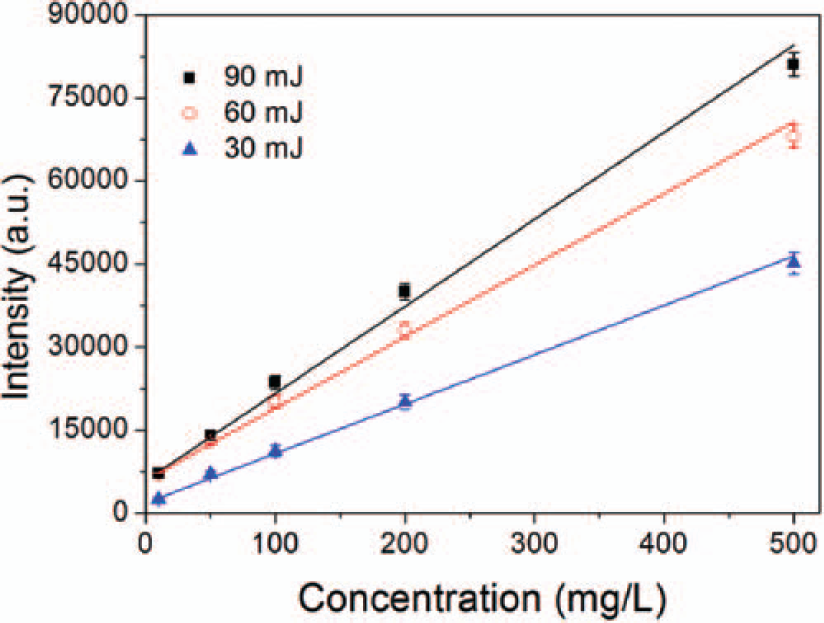
Calibration curves of Mn in aqueous solution for different laser pulse energy (30, 60, and 90 mJ).

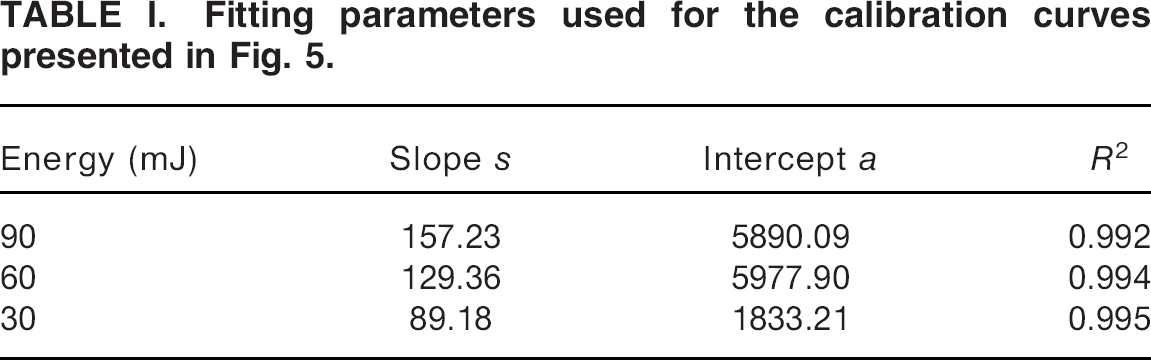
where y is the integrated intensity (or normalized intensity) of the emission line chosen to calculate the concentration of the element, x the concentration of the element, a and s are, respectively, the intercept and the slope of the calibration curve. The fitting parameters are given in Table I. The linear correlation coefficient R 2 of the calibration curve is also presented. In these curves, each data point corresponded to an average of eight measurements under the same experimental conditions, and the error bar was the standard deviation of these eight measurements. The slope of the fitting line increased as laser pulse energy strengthened, while the difference decreased. In this work, the concentrations of samples used ranged from 10 to 500 mg/L to avoid saturation effect on calibration curves with higher concentrations. In general, nonlinear behavior of calibration curves was observed under the concentration of above 500 mg/L. It was why we established the calibration curves for the concentration of below 500 mg/L in order to have a more precise determination of the slope for low concentrations in the ppm range, shown in Fig. 6.
Fitting parameters used for the calibration curves presented in Fig. 5.
The LOD could be determined by the definition

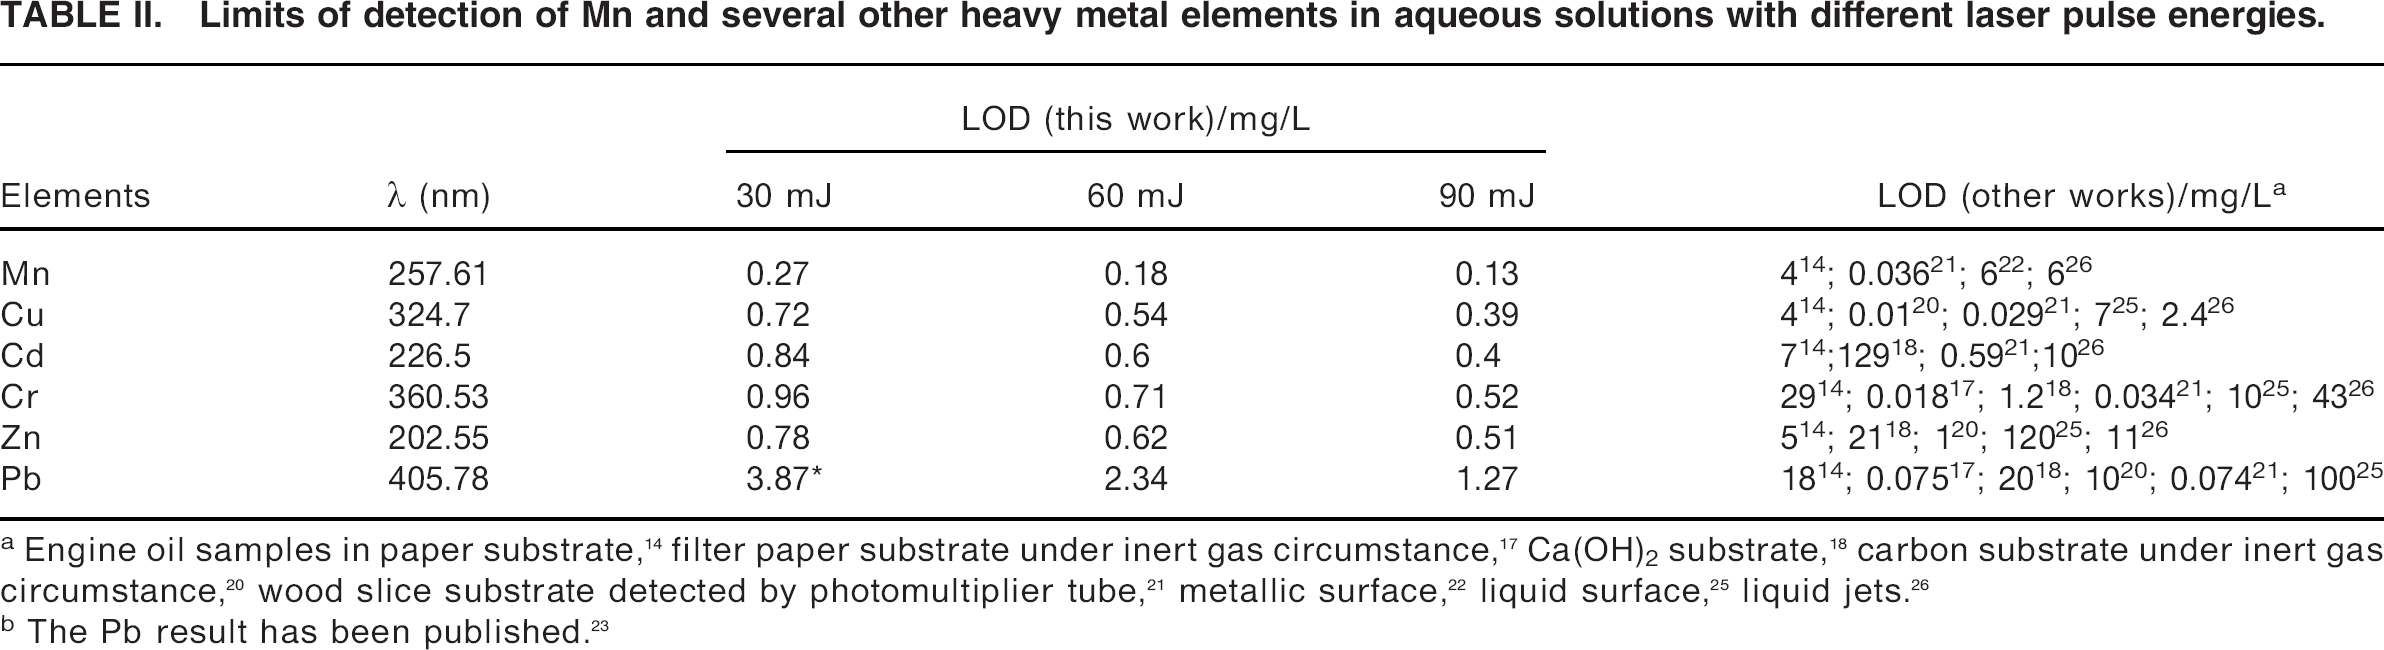
where σ is the standard deviation of background which represents the fluctuation of the detected signal at the wavelengths of the line emissions when elements to be detected are totally absent, and s is the slope of the calibration curve. In this work, σ was determined from ten measurements of background signals under the same experimental conditions in which the paper substrate absorbed pure deionized water. In this work, LODs of other common heavy metal elements in aqueous solution were also calculated with different laser pulse energies and listed in Table II. Limits of detection for Mn, Cu, Cd, Cr, Zn, and Pb obtained by this approach were one to two orders lower than those obtained by direct detection of liquid samples, as when laser was focused on a static liquid surface 25 or liquid jets, 26 generally better than those obtained by similar approaches. However, the LODs of certain elements were higher than those obtained by other approaches due to different experimental conditions, such as the ablation under inert gas circumstance.17,20
Limits of detection of Mn and several other heavy metal elements in aqueous solutions with different laser pulse energies.
Engine oil samples in paper substrate, 14 filter paper substrate under inert gas circumstance, 17 Ca(OH)2 substrate, 18 carbon substrate under inert gas circumstance, 20 wood slice substrate detected by photomultiplier tube, 21 metallic surface, 22 liquid surface, 25 liquid jets. 26
The Pb result has been published. 23
Figure 7 showed the calibration curves of Mn in pure solution detected by echelle spectrometer with and without normalization. The figure illustrated that the improvement was obtained as a result of the normalization procedure on the reliability and reproducibility of the plotted data in this figure. The correlation coefficient R 2 was improved from 0.984 to 0.996, and the relative standard deviation was decreased from about 10 to 5.2%. The detection precision was thus improved greatly with the normalization of the Hα line. The corresponding LOD of Mn was 2.33 mg/L by Eq. 2.
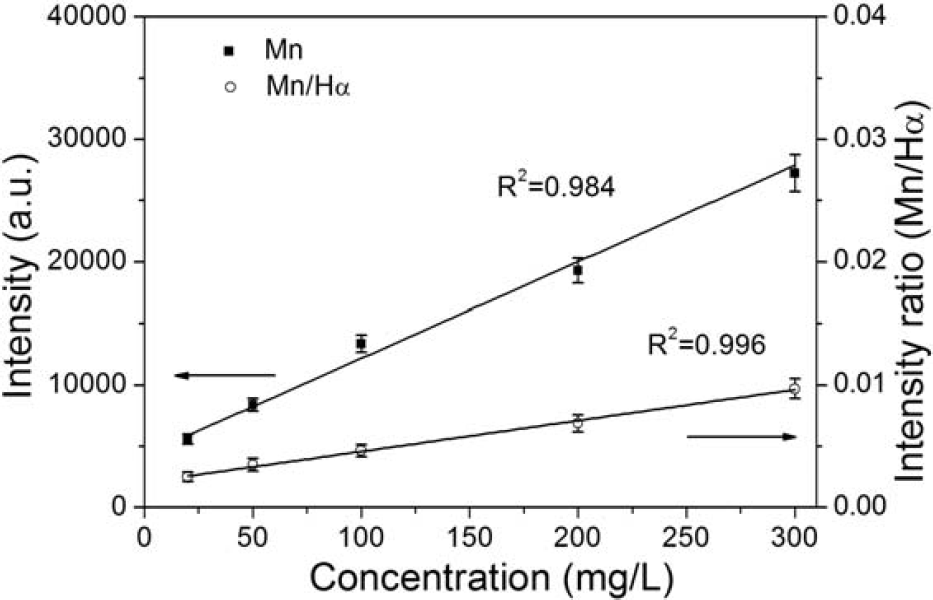
Calibration curves of Mn in pure solutions with and without normalization.
Manganese in pure aqueous solutions was detected with the Czerny–Turner spectrometer and the echelle spectrometer. These results demonstrated that a Czerny–Turner spectrometer detected with higher sensitivity, and its LOD of Mn was down to several hundred ppb level (lg/L). It provided a more sensitive detection of Mn and other heavy metals in laboratory with the help of the Czerny–Turner spectrometer. However, the Czerny–Turner spectrometer usually had a longer focal distance (larger size) so that it was limited to onsite application. By contrast, the echelle spectrometer could be applied onsite due to its compact size and wide spectral detection range that could partly eliminate signal fluctuation to improve precision by normalization, as shown in Fig. 7. For field samples which usually contained many different metal elements, many factors such as the interference of different elements and the instability of LIBS system might affect signal stability, causing imprecise detection. In the following section, Mn in mixed solutions would be investigated to assess the feasibility of onsite detection by this approach.
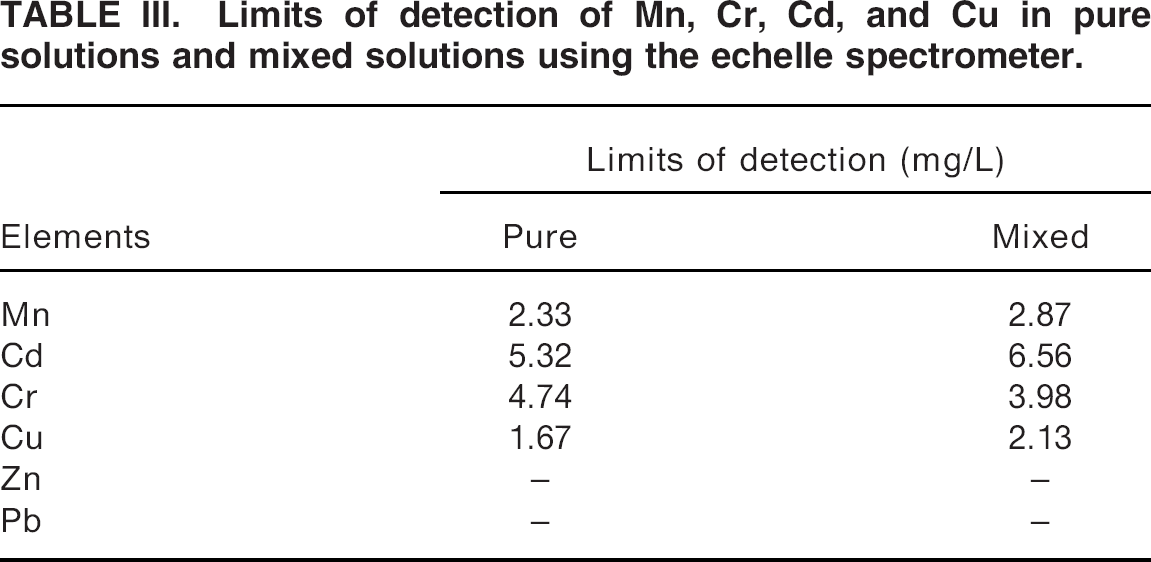
Figure 8 showed the calibration curve for Mn in mixed solutions with different concentrations. The correlation coefficient R 2 of the calibration curve was 0.998 which showed good linearity. The LOD of Mn in mixed solutions was 2.87 mg/L according to Eq. 2. It showed that the matrix effect increased LOD by about 23% for Mn compared with the result obtained in pure solution. In this work, other elements (Cd, Cr, and Cu) in pure and mixed solutions were also detected, and all LODs are listed in Table III. The LODs obtained in mixed solutions were affected slightly by the matrix effect compared with those obtained in pure solutions. It was noticeable that no sensitive spectral lines for Zn and Pb were observed in the wavelength range of 220–850 nm with the echelle spectrometer, and the preliminary results suggested that the limits of detection of Zn and Pb were higher than 100 mg/L.
Limits of detection of Mn, Cr, Cd, and Cu in pure solutions and mixed solutions using the echelle spectrometer.
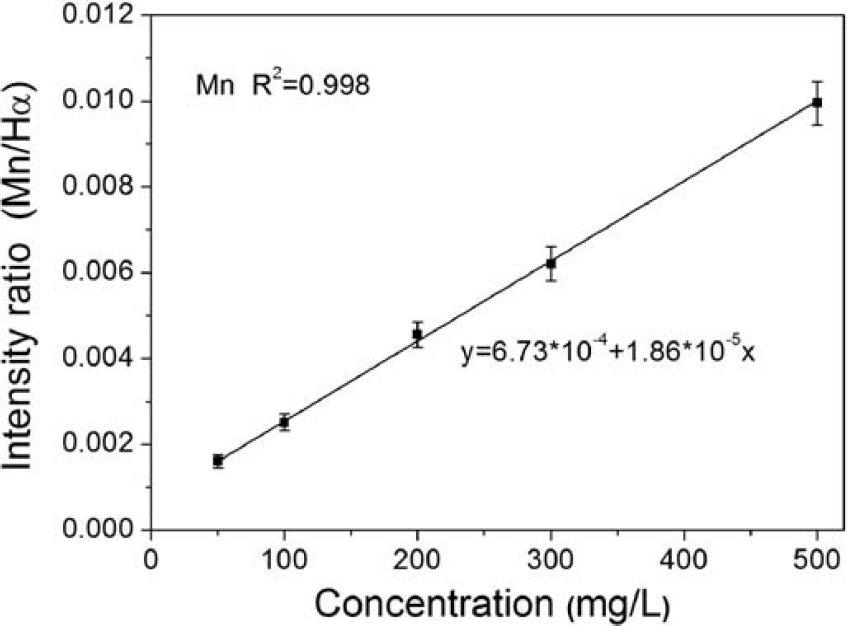
Calibration curve of Mn in mixed solutions (Mn- Cr-Cd-Cu) with normalization.
To assess the accuracy of this approach, Mn with known concentration in mixed solutions (100 mg/L) had been determined according to the experimental calibration curves obtained in the mixed aqueous solutions of Mn, Cr, Cd, and Cu. The concentrations of other elements (Cd, Cr, and Cu) were different with those used as standard samples for quantitative analysis, with 150, 150, and 100 mg/L, respectively. The LIBS result was 94 ± 5 mg/L under the average of seven measurements, and the relative standard deviation was 4.2% by calculation. Good agreement was obtained between the measured and known values, taking into consideration that the matrix effect was not exactly verified. It indicated that our method was suitable for rapid onsite detection with accurate results.
Figure 4c showed the LIBS spectra of Mn in seawater with the detection delay of 1500 ns and gate width of 4000 ns. Common elements in seawater (Ca, Na, and Mg) were observed obviously. Figure 9 showed the calibration curves of Mn in seawater. The LOD of Mn in seawater was 2.73 mg/L according to Eq. 2. From Figs. 7 and 8, we could see that the fitting calibration curves of Mn in mixed solution (Mn-Cr-Cd-Cu) and seawater were not parallel, which proved the existence of the matrix effect in these solutions.
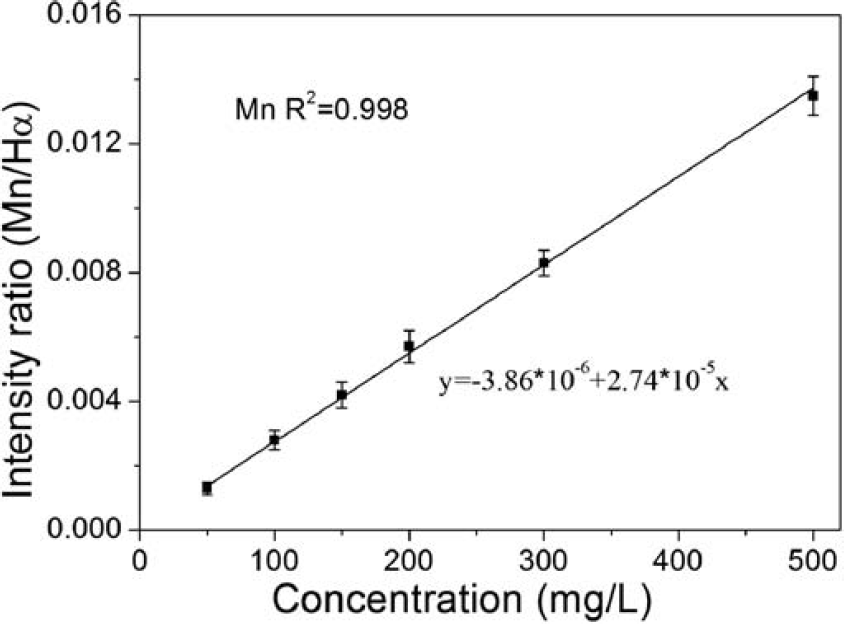
Calibration curve for Mn in seawater.
CONCLUSION
A paper substrate was used as a liquid absorber for quantitative analysis of Mn in aqueous solution and seawater by LIBS. The LOD of Mn in aqueous solution exhibited several hundred ppb level of 0.13 mg/L using the Czerny–Turner spectrometer. In order to apply it to onsite detection, the compact echelle spectrometer was used for two field samples of Mn solution simulating industrial wastewater and seawater. The results showed that the measured concentration of Mn in industrial wastewater had a good agreement to the real value even when the concentrations of other elements in the sample changed. However, due to the matrix effect in both solutions, relevant calibration curves of Mn were plotted and the LODs of two solutions were thus calculated to be 2.87 and 2.73 mg/L, respectively. Although our approach provided LODs no lower than those obtained with ICP-MS and AAS, its simplicity in sample preparation and its rapid detection capability make it especially suitable for application in complicated and different environmental conditions such as hazardous industrial wastewater and seawater. All results obtained suggest that this approach has great potential for the rapid onsite detection of Mn and other heavy metal elements in industrial wastewater and seawater, which would play an important role in pollution monitoring and the investigation of geochemical and biological processes in the ocean.
Footnotes
ACKNOWLEDGMENTS
Financial supports from National Natural Science Foundation of China (Grant Nos. 11104153 and 41376107) are highly acknowledged. One of authors (Junshan Xiu) would like to thank Zhen Shi for his language checking.