
Abstract
Many pharmaceuticals include highly potent active pharmaceutical ingredients (API), which only require a small dosage to obtain the desired therapeutic effect. This leads to a challenge for quantification of the API using process analytical technology, since the standard nondestructive measurement technique, near-infrared spectroscopy, is not able to quantify below 1% (weight/weight (w/ w)) API content. In formulations with more than one API, this challenge is further increased. The purpose of this study is to scrutinize the potential of fluorescence spectroscopy for the simultaneous quantification of two APIs: flupentixol (FLU) in low dosage (0.208–0.625% w/w free base) and melitracen (MEL) (4.17–12.5% w/w free base) in a tablet formulation. Despite internal quenching between the ingredients and the two APIs, this paper demonstrates that it is possible to establish calibrations using partial least squares (PLS) regression on unfolded fluorescence landscapes with a root mean square error of prediction and relative error of 0.038% (w/w) and 9.1%, for FLU and 0.344% (w/w) and 4.1% for MEL, respectively.
Keywords
INTRODUCTION
Content uniformity of tablets is a critical quality attribute due to its link to therapeutic effect and thus patient safety. Traditionally, active pharmaceutical ingredient (API) content determination is done using high-performance liquid chromatography (HPLC) analysis, but in a process analytical technology (PAT) context a more rapid and nondestructive method is required. This paper describes the development of a fluorescence method for determination of active content in Deanxit tablets. Deanxit is an antidepressant drug, containing two active ingredients, flupentixol and melitracen. A combination of 0.5 mg flupentixol (FLU) and 10 mg of melitracen (MEL) is used in conditions of depression and anxiety. 1
The API content of both MEL 2 and FLU 3 and the two drugs in combination 4 is traditionally measured using HPLC, but ultraviolet–visible spectrophotometry also has been used for FLU 5 and for FLU and MEL in combination. 6 Furthermore, liquid chromatography tandem mass spectrometry and liquid chromatography–electrospray ionization-mass spectrometry methods have been reported for quantification of FLU and MEL in human plasma.7–9 However, these techniques carry the disadvantages of being destructive, time-consuming, and laborious. It is therefore of interest to be able to quantify the APIs in a nondestructive manner for direct PAT monitoring of the production process.10,11 Near-infrared spectroscopy (NIR), in particular, is often used to quantify APIs in tablet formulation. However, NIR has not shown good results below 1% (weight/weight (w/w)) API content. 12
In contrast to the food studies, 13 fluorescence spectroscopy has so far only found limited application in pharmaceutical PAT studies. 14 Recently, the measurement of excitation–emission matrices (EEM) was proposed together with chemometric methods for analysis of pharmaceutical formulations. 15 Active ingredients often consist of substituted aromatic and heterocyclics that may exhibit fluorescence at the right wavelength. 16 Approximately 60% of the top 200 API molecules are estimated to fluoresce, while most excipients (lactose, starch, etc.) only fluoresce to a lesser extent. 17 The high sensitivity of fluorescence spectroscopy therefore makes it a viable alternative to the widely used but less sensitive NIR spectroscopy.14,18
Many studies have shown fluorescence properties of FLU after different chemical reactions with added solvents.19–22 For instance FLU when oxidized with nitrous acid 21 exhibits fluorescence at 440 nm when excited at 370 nm. However, this fluorescence is most likely related to the reaction rather than the actual flupentixol molecule. Fluorescence in liquid and solid phase can act differently. Moreira et al. 23 reported that paracetamol does not fluoresce in liquid solutions but has fluorescent properties in solid phase. Solid phase fluorescence is very attractive due to the reduced sample preparation, a minimal consumption of reagents, and low cost of analysis. 15
Moreira et al. 24 developed a fluorescence method for acetylsalicylic acid in tablet formulations in the range 50–170 mg/g with a relative standard deviation of 2.3%,a detection limit of 2.2 mg/g, and quantification limit of 7.3 mg/g. Subsequently, Moreira et al. 25 proved that they were able to simultaneously determine acetylsalicylic acid and caffeine in powder mixtures in the range of 50–170 mg/g and 5–20 mg/g using fluorescence and partial least squares regression (PLS) with relative standard deviations of 3.1% and 4.0%, respectively. Domike et al. 26 used fluorescence for prediction of triamterene in tablets with relative standard deviations (RSDs) of 1.8–12.3% in the API load range 1.6–4.75% (w/w) and caffeine with RSDs of 3.7–6.9% in the range 5–20% (w/w).
Problems with selectivity in fluorescence measurements can occur when analyzing a sample matrix with more than one component due to overlapping bands of structurally similar components. Furthermore, specificity can be a problem in the determination of fluorescent drugs. 27 In cases where univariate spectrofluorimetry is not sufficient, time-consuming separation techniques can be avoided by applying multivariate PLS to the fluorescence data.28–30 Moreira et al. 31 found that simultaneous determination of two actives in diluted powder mixtures was not possible with a univariate approach due to overlapping spectral bands. The authors solved this issue with the application of PLS. A different method to overcome the problem with emission overlapping peaks is to use first derivative synchronous fluorescence, where the difference between excitation and emission is kept constant during measurement. Karim et al. 27 used first derivative synchronous fluorescence to simultaneously determine acetylsalicylic acid and caffeine. Another approach is to use the second-order advantage of the EEM. Esteves da Silva et al. 32 and Leitão et al. 33 used EEM and parallel factor analysis (PARAFAC) and trilinear decomposition to detect verapamil in methanol solution. They also calculated different excitation and emission spectra with PARAFAC due to a changed background for verapamil from tablets compared with a pure verapamil standard. Furthermore, down weighing spectral regions with scatter band (first- and second-order scatter) gave better results in the PARAFAC models. Alves and Poppi 15 simultaneously determined acetylsalicylic acid (337–463 mg/g), paracetamol (59–101 mg/g), and caffeine (226–404 mg/g) with errors in the range from 0.2 to 13% and RSDs of 0.5–4.8% using PARAFAC. Garcia-Reiriz et al. 34 used unfolded principal component analysis combined with different artificial neural network techniques to determine pharmaceutical ingredients in different solvent systems using second-order advantage.
So far, only a few studies have been conducted using fluorescence spectroscopy for online measurements in the pharmaceutical industry, but the possibilities are promising.15–18,26 Lai et al. 18 developed a laser-induced fluorescence (LIF) sensor for online monitoring of powder blend homogeneity for triamterene down to 0.1% (w/w) in lactose matrix with less than 5% RSD. Later, Lai and Cooney 16 found a limit of detection below 0.02% (w/w) on a similar setup. In 2004, Lai et al. 17 simulated a production line and applied a LIF sensor with a measurement rate of up to 3000 tablets per minute.
In the production of pharmaceutical tablets, it is desirable to analyze the API content, noninvasively and preferably online. The aim of this study is to evaluate the potential of using a fluorescence sensor for the simultaneous and nondestructive quantification of two APIs in a tablet formulation: flupentixol (FLU) in low dosage and melitracen (MEL).
EXPERIMENTAL SECTION
Solid ingredients for production of tablets listed in descending order (of the target formulation).
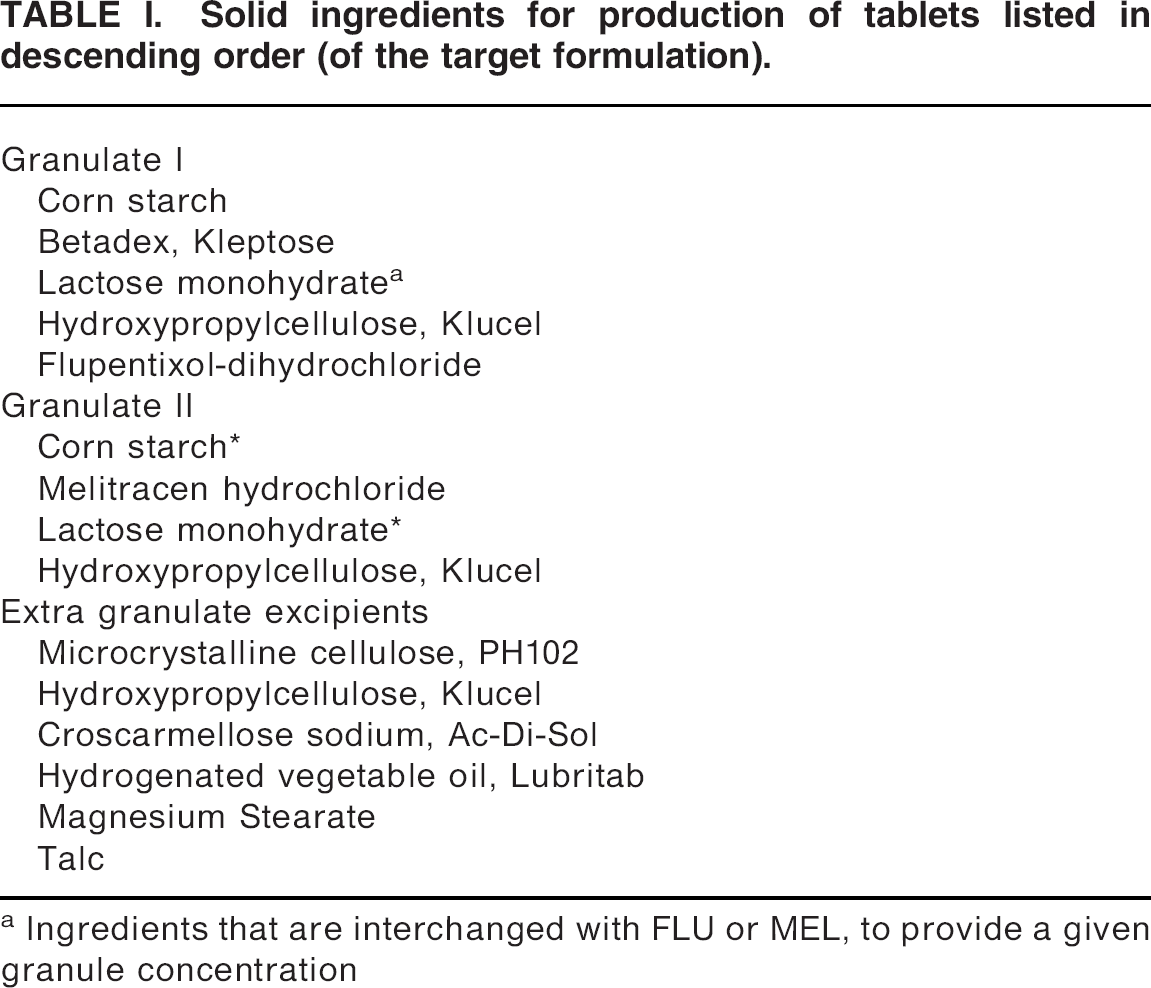
Ingredients that are interchanged with FLU or MEL, to provide a given granule concentration
Six granulations per API were carried out, each subbatch providing different concentration of active content. Concentration levels were 0 (placebo), 50, 75, 100, 125, and 150% of the nominal content in the intra-granular phase. Wet granulations were performed in a high shear mixer (Diosna P25, Dierks & Söhne GmbH, Osnabrück, Germany) using water as binder liquid. As stated in Table I, FLU was interchanged with lactose to provide a given concentration, while MEL was interchanged with cornstarch and lactose, the latter two excipients kept at a constant ratio.
In total, 36 tablet batches were manufactured by combining the six concentrations of granulate I with the six concentrations of granulate II (Fig. 1). In this manner, all combinations of granulate I and II were used. Due to the different concentrations of the intra-granular phases, it was possible to maintain identical amounts of intra-and extra-granular phases for all 36 batches, thereby providing tablets of similar mechanical strength. A Bohle LM40 blender (L.B. Bohle, Ennigerloh, Germany) was used for mixing granulates with the extra-granular excipients. Blending time was 8 min, followed by 3 min lubrication with magnesium stearate, both steps performed at 22–24 rpm.
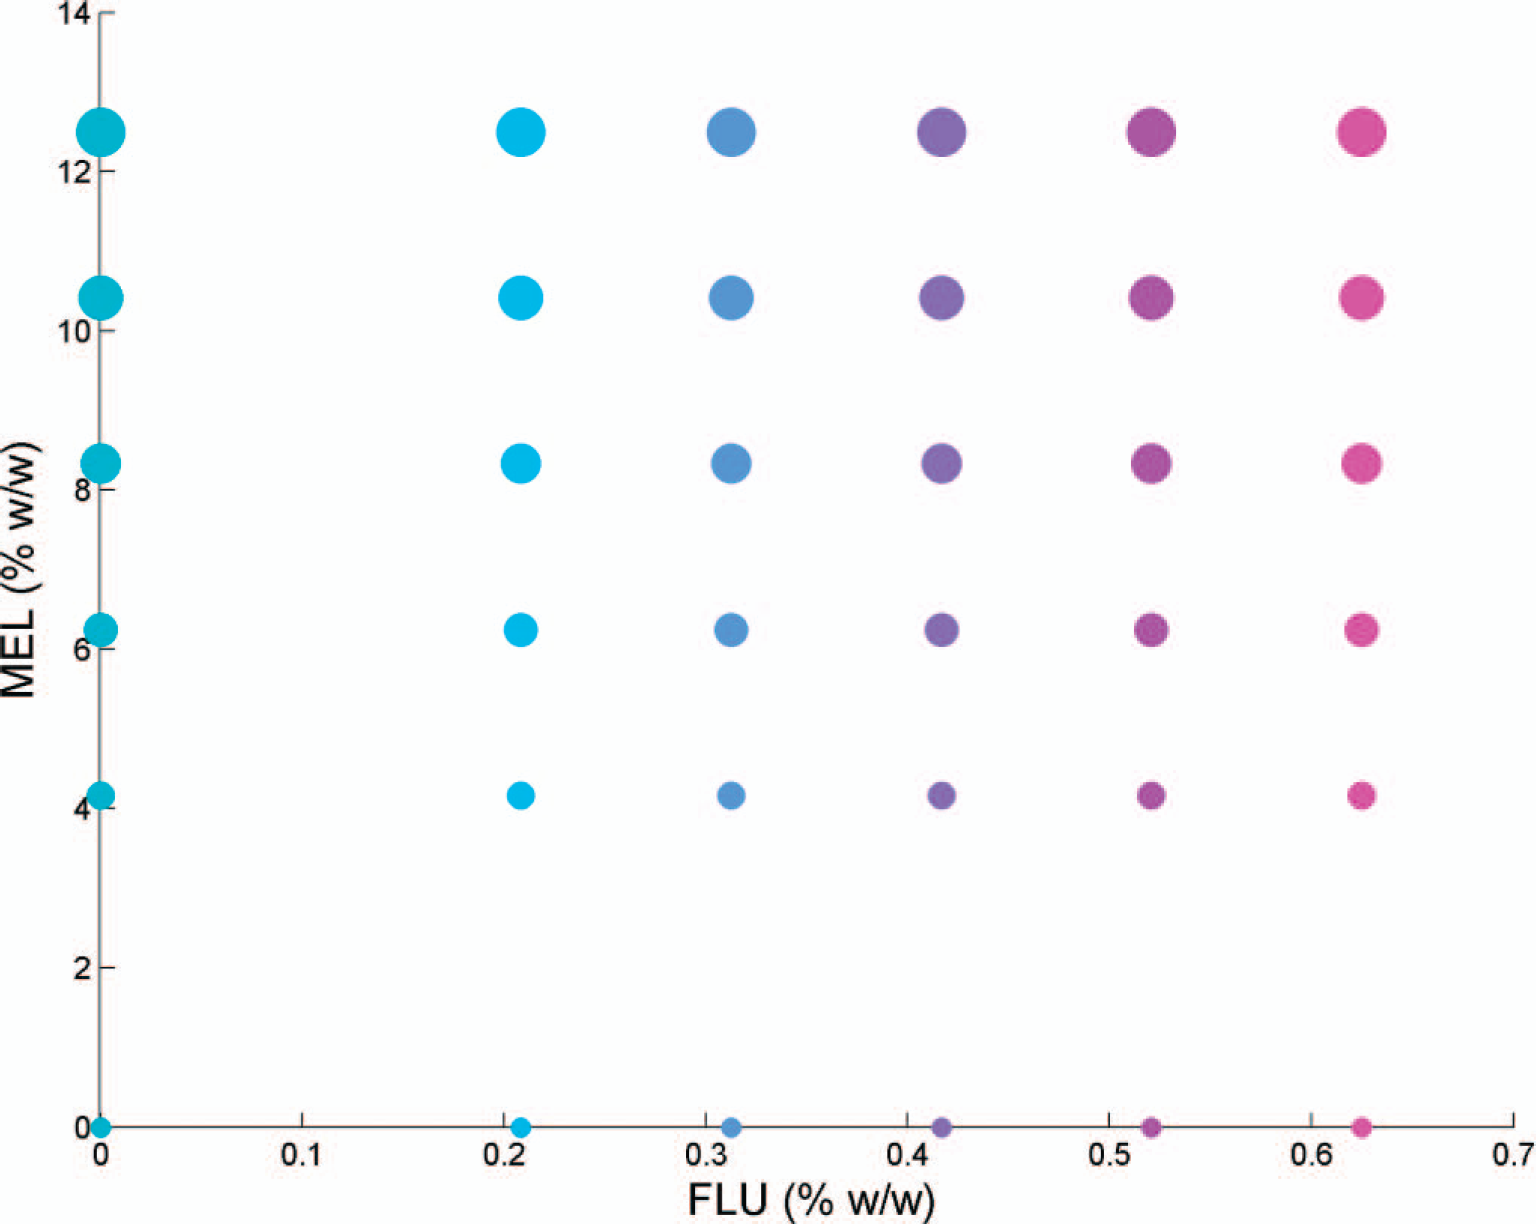
Experimental design of the 36 tablet batches containing 0–0.625% (w/w) FLU and 0–12.5% (w/w) MEL. The nominal (100%) content of FLU and MEL is 0.417 and 8.33% w/w free base, respectively.
Tablets with a total weight of 120 mg were manufactured on a Kilian Pressima, 12-punch rotary tablet press (I.M.A Kilian GmbH & Co. KG, Cologne, Germany) at a compression speed of 20 000 tablets per hour. Batch size was approximately 2000 g.
HPLC values were determined as an assay of five tablets using an in-house procedure with an analytical RSD of 0.4% for FLU and 0.6% for MEL.
The data analysis was done on unfolded data with first-order Rayleigh scatter removed (emission wavelength ≤ excitation wavelength + 20 nm). 35 The data were unfolded in the excitation mode, i.e., the new dimensionality of the data is samples × (emission spectra at excitation 1 + emission spectra at excitation 2, etc.). 36
Principal component analysis (PCA) 37 was applied to explore the unfolded EEM, creating an unfolded PCA.
Partial least squares regression 38 was performed on the unfolded data using the API concentrations (% w/w) determined using HPLC as response. Furthermore, variable selection through application of interval PLS (iPLS) 39 was used to identify the spectral ranges best describing the API concentration. Each interval consists of one excitation wavelength and up to 402 emission wavelengths. Since the focus of this study is not on variable selection, the selected iPLS model is chosen as an example for variable selection. Other variable selection methods may give slightly better results, but iPLS represents a very simple and intuitive method to reduce the number of variables. In iPLS, the prediction error of the reduced model is compared with the prediction error of the global model. In forward iPLS the selection starts with the best performing interval, and it continues to add intervals until the prediction error increases. The complexity of each model was estimated by finding the minimum or breakpoint in the root-mean-square error of cross-validation (RMSECV) curve. For the cross validation all three samples from each batch were left out sequentially (36 segments), so 1/36 of the data were left out at a time. A root mean square error of prediction (RMSEP) was calculated based on the independent test samples.
RMSECV and RMSEP are calculated as follows:
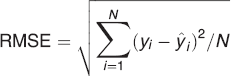
where yi is the true API value (here HPLC), ŷi is the predicted value (from EEM), and N is the total number of samples.
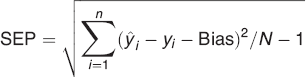
where
Repeatability is calculated as the average standard deviation
where n is the number of samples and J is the number of replicate measurements on one sample. 40
Domike et al.
26
found that for caffeine, logarithmic transformation of the emission intensities gave a better calibration. Therefore, logarithmic functions for either the
The limit of detection (LOD) and limit of quantification (LOQ) were calculated as described in the International Conference on Harmonisation Q2 41 guideline:

where σ is the mean value of the standard deviation of the two batches of placebo tablets (each three samples), one from the calibration set and one from test set.

To simulate the performance of a system only analyzing at single wavelengths, the correlation to the maxima of FLU (excitation 350 nm and emission 380 nm) and MEL (excitation 310 nm and emission 350 nm) was calculated.
Furthermore, PARAFAC 42 with standard settings (non-negativity) was examined but did not improve the results and is therefore not reported here.
RESULTS AND DISCUSSION
The fluorescence landscapes of pure FLU and MEL of excitation wavelength 280–365 nm and emission 300–450 nm are shown in Fig. 2.
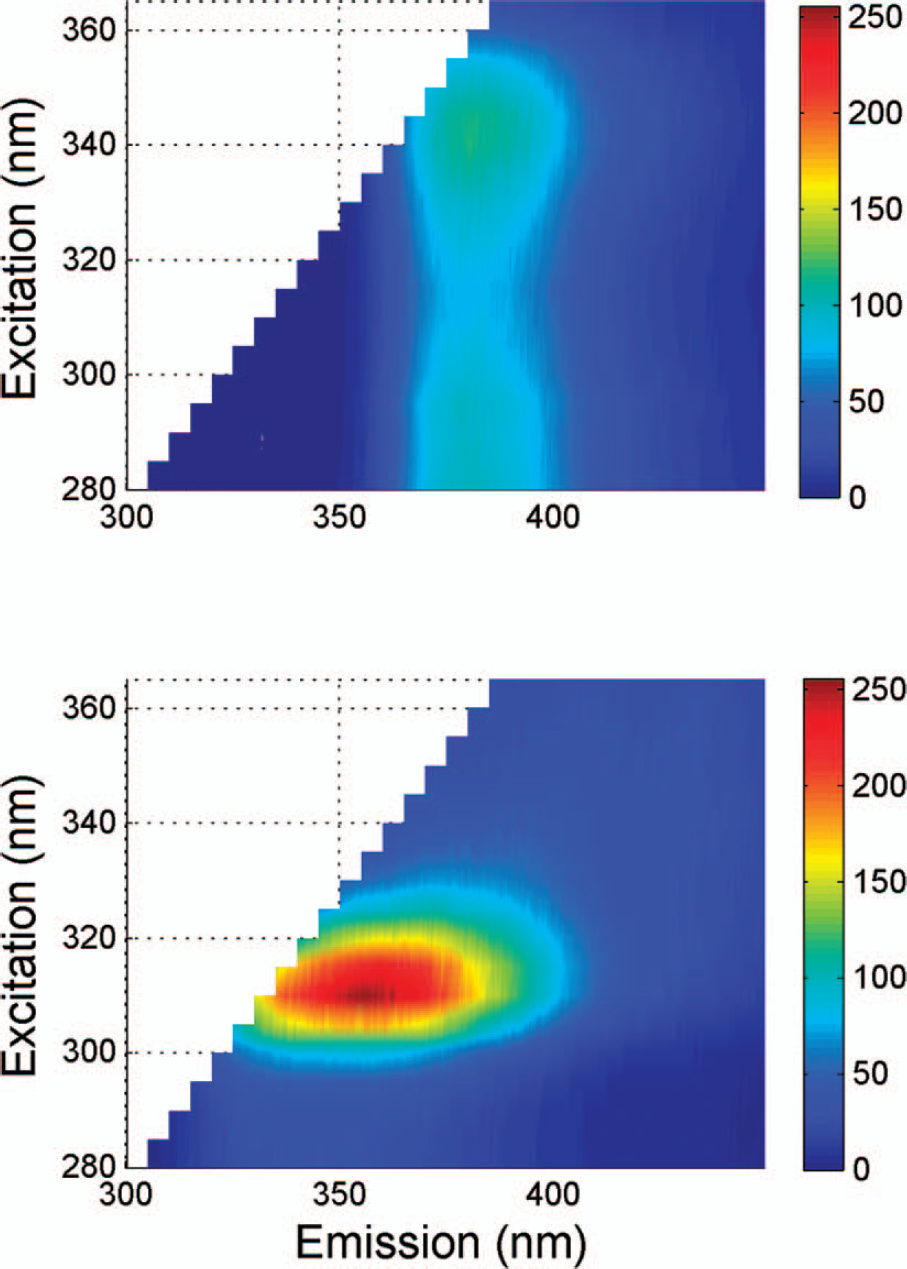
Excitation and emission landscapes of pure MEL (melitracen hydrochloride) and FLU (flupentixol dihydrochloride). To correct for Rayleigh scatter, any emission wavelength < excitation wavelength + 20 nm have been removed.
The fluorescence excitation–emission landscapes of nine out of the 36 batches used for calibration are shown in Fig. 3. The top left batch, which is the placebo, shows very little fluorescence. The top middle and right batches, which only include FLU at increasing concentrations, display increasing fluorescence at excitation 280–350 nm and emission around 400 nm. The left middle and bottom batches, which only include MEL at increasing concentrations, show weak but increasing fluorescence at excitation 310 nm and emission 350 nm. When both APIs are present (four remaining batches in Fig. 3), the fluorescence from MEL is not visible, and part of the fluorescence from FLU (excitation 280–300 nm, emission 400 nm) seems to disappear due to quenching 43 between the two molecules or their excipients. In the formulation MEL is used as melitracen hydrochloride, and chloride ions are like other halogens known to be a quencher. 44 Together with each flupentixol molecule we also added two hydrochloride molecules, but melitracen is added in approximately 20 times the concentration of flupentixol. It is therefore possible that the chloride from the MEL addition is quenching the FLU signal. It is also possible that energy transfer, or Förster quenching, 43 is occurring as FLU excites light in the range of MEL's emission around 350 nm. Moreira et al.23,24 found that different excipients—magnesium stearate, talc, corn starch, stearic acid, polyvonylpyrrolidone, and lactose—had different effects on acetylsalicylic acid fluorescence, probably due to specific interaction between the fluorophore and the ingredients. This underlines the importance of including all excipients when producing samples for calibration purposes.
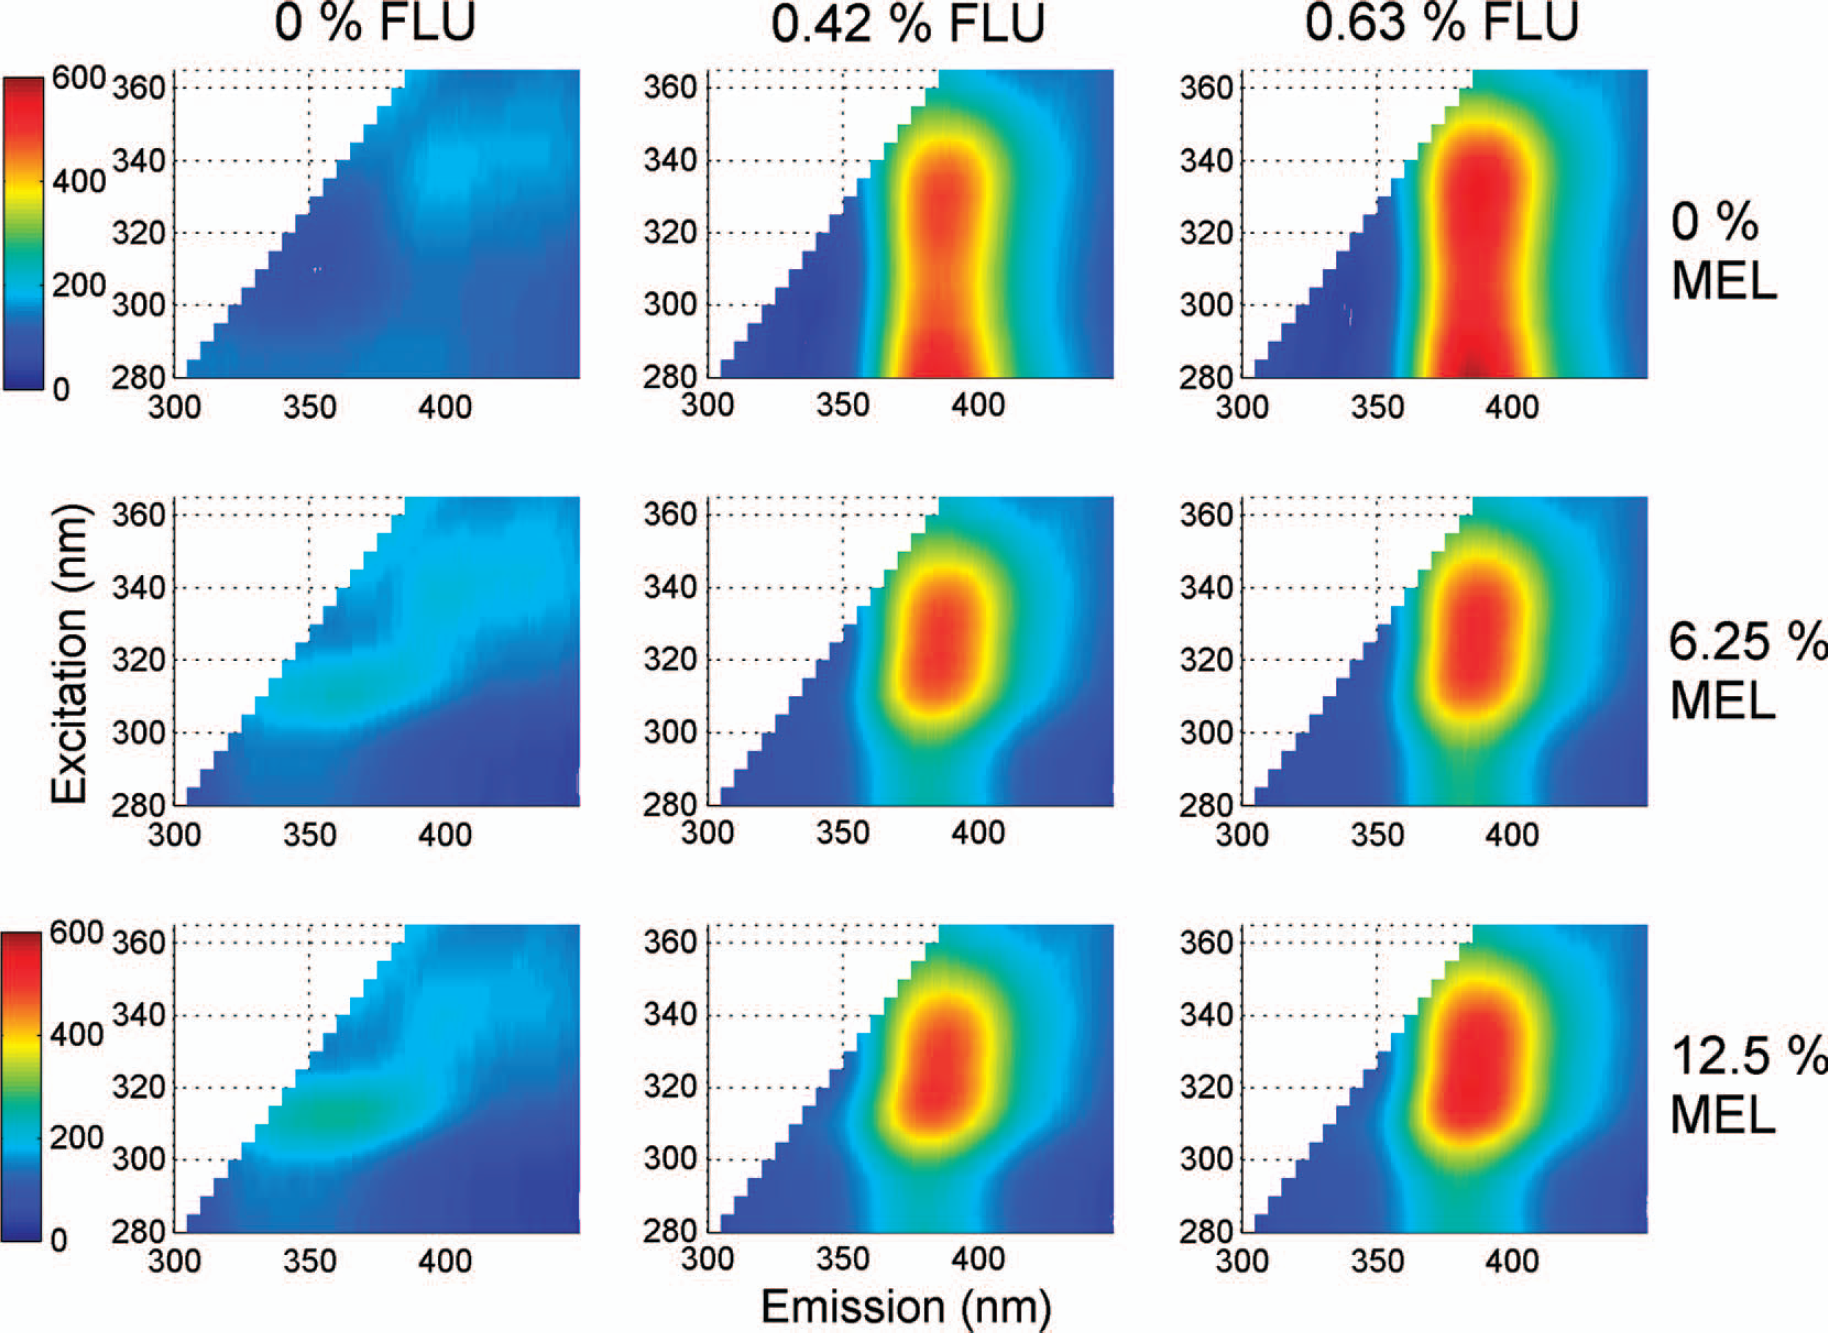
Fluorescence landscapes of nine batches (average of three tablets) with the two APIs, FLU and MEL. First batch is placebo, FLU (0–0.625% w/w) increases in the horizontal direction and MEL (0–12.5% w/w) in the vertical direction. To correct for Rayleigh scatter, any emission wavelength ≤ excitation wavelength + 20 nm have been removed.
A PCA on the unfolded data was run in order to explore the sample space and to detect outliers in the spectra (none were found). The unfolded PCA score plot is shown in Fig. 4. The score plot divides the samples into four groups. The upper left group consists of the three placebo samples; the lower left group consists of the tablet samples containing only MEL. The upper right group consists of tablet samples containing only FLU, and the lower right group consists of the remaining samples including both FLU and MEL. The score plot shows that the largest variation in the data, spanning PC1, is the FLU fluorescence, which is also the strongest signal in the EEM landscapes (Fig. 3). The second largest variation, described using PC2, is the MEL fluorescence, which is also notable in the EEM landscapes. Curiously, FLU is the strongest fluorophore in this matrix, despite the fact that its concentration is approximately 20 times lower than the concentration of MEL. Perhaps this is the reason that it is beneficial for the calibrations of MEL to only use parts of the landscape, where FLU is not so dominating. Figure 5 shows the selected parts of the unfolded landscape using regional variable selection using iPLS. From the iPLS plot we observed that the RMSECV is decreased when only four out of the 18 excitation wavelengths are selected (280, 300, 315, and 320 nm).
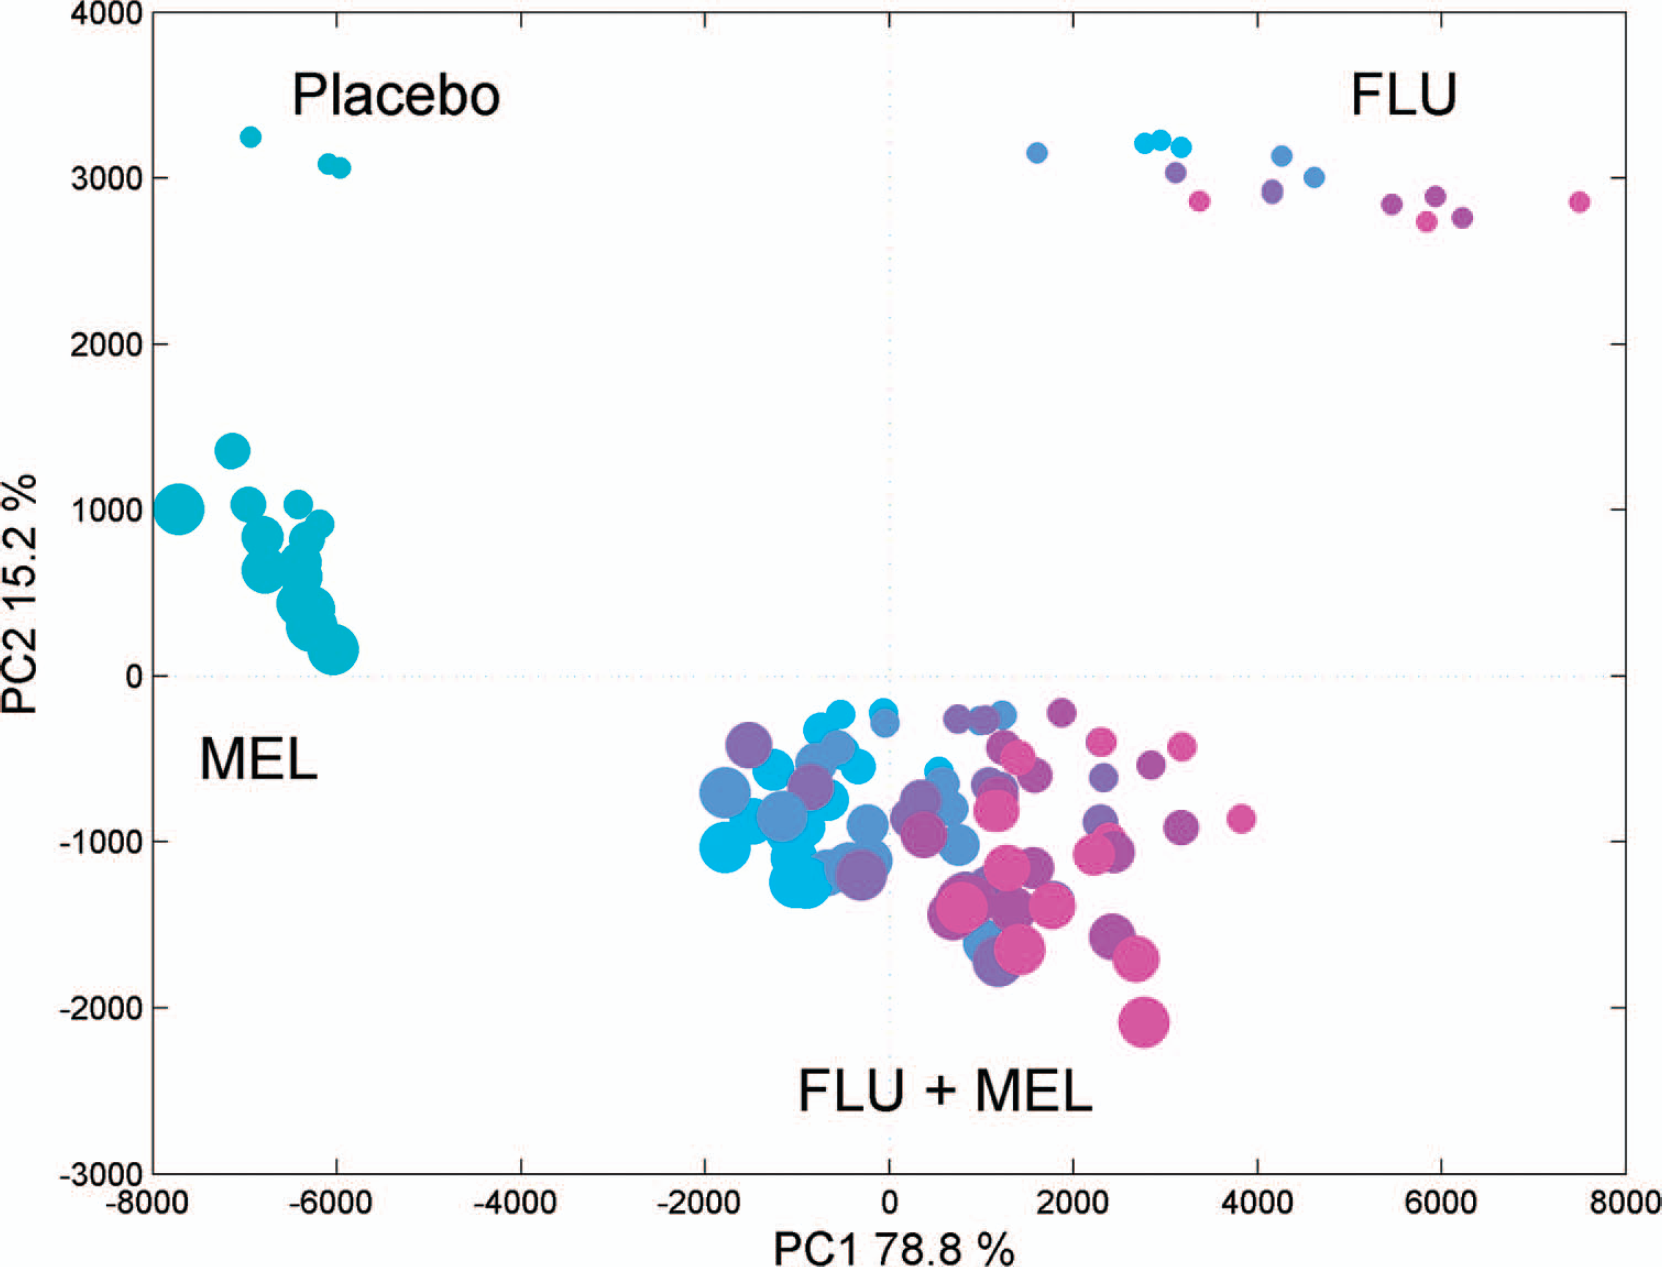
Scores plot from unfolded PCA colored using the FLU concentration (turquoise indicate low values, blue indicate medium values, and pink indicate high values). The sizes indicate the concentrations of MEL (see Fig. 1 for the color designations).
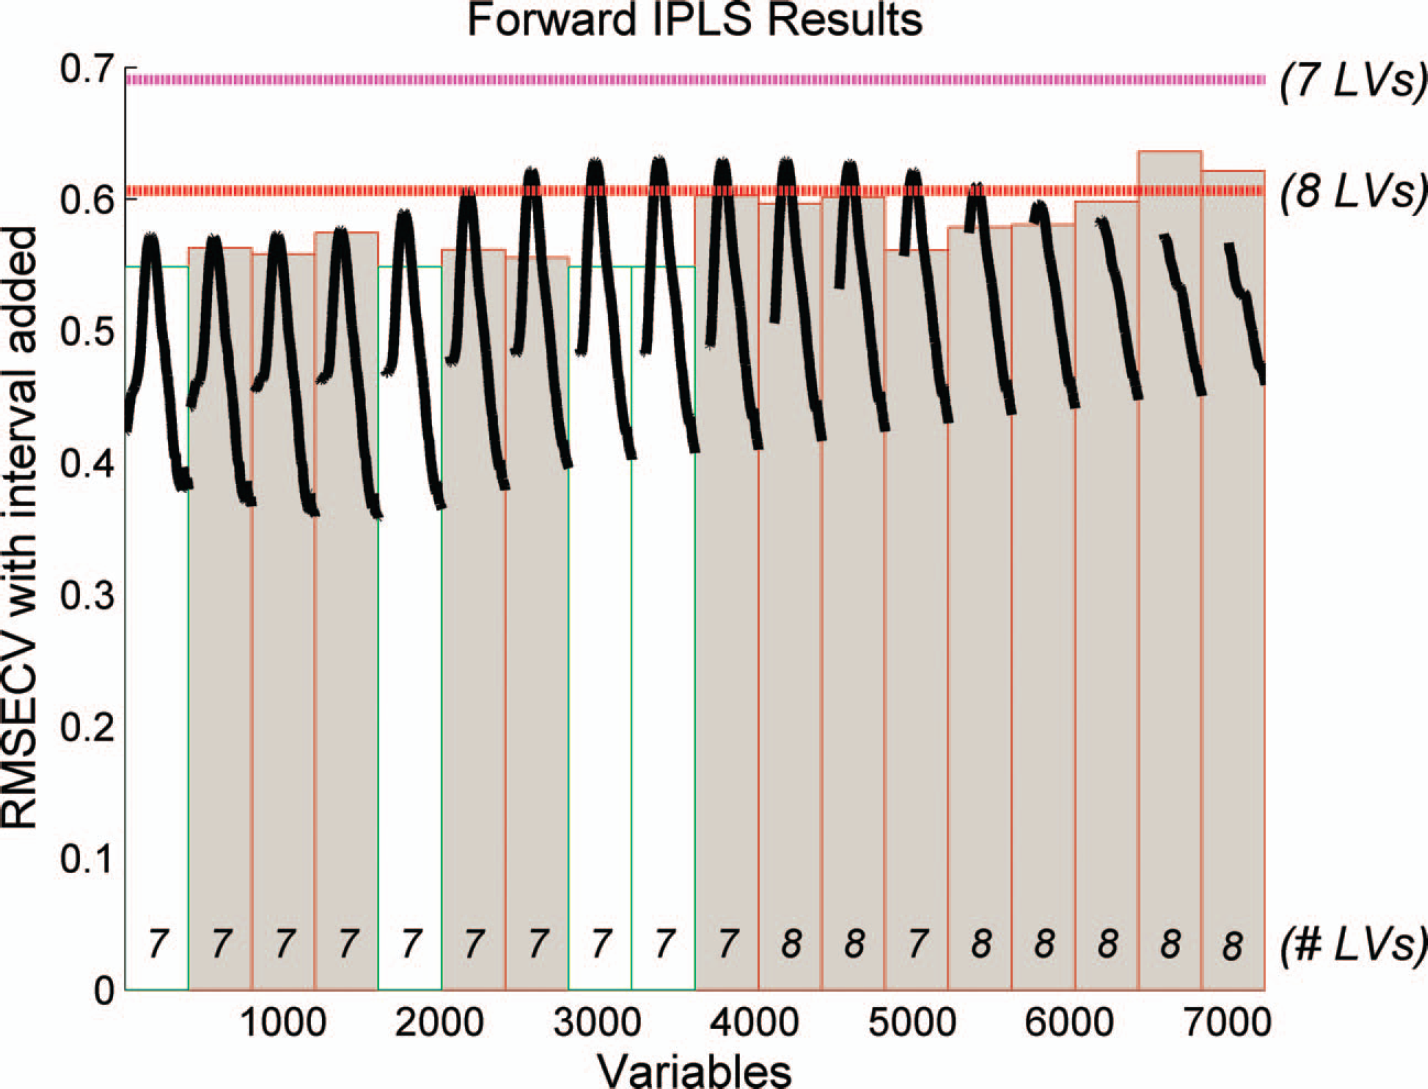
iPLS plot of the selected areas using interval PLS (iPLS) for MEL on logarithmically treated EEM from excitation 280–365 nm and emission 300–500 nm. Each interval consists of one excitation wavelength (18 in total), and the emission spectra are shown. For each interval a local model is found. These are compared to the global (all interval) models RMSECV for 7 latent variables (pink horizontal line) and 8 latent variables (red horizontal line). Only the intervals that will contribute to a lower RMSECV will be included in the final model (white intervals).
The performance of selected regression models is shown in Fig. 6. The figure shows the calibration models for FLU and MEL calibrations performed on unfolded data, and Table II shows the statistics of the corresponding models. For FLU the calibration model was based on the logarithmic function to y + 1 in order to handle the 0% placebo. Variable selection using iPLS did not improve the model for FLU. The log transform provided the best model, with a RMSEP and RMSECV of 0.038% (w/w) and 0.015% (w/w), respectively (compared with 0.041% (w/w) and 0.017%(w/w) for non-transformed data). The RMSEP for FLU was corresponding to 9.1% relative to the nominal concentration. From the predictions of earlier lab-scale samples and recent real production batches (Table), it appears that the prediction is better for the production batches than for the lab-scale productions. The reason for this may be lot-to-lot variation between batches of excipients, which is not included in the calibration. For the MEL calibration only four excitation wavelengths were used, and the calibration was based on the logarithmic function to EEM. For MEL, the log transform of
Calibration overview for FLU and MEL for calibration and test set.
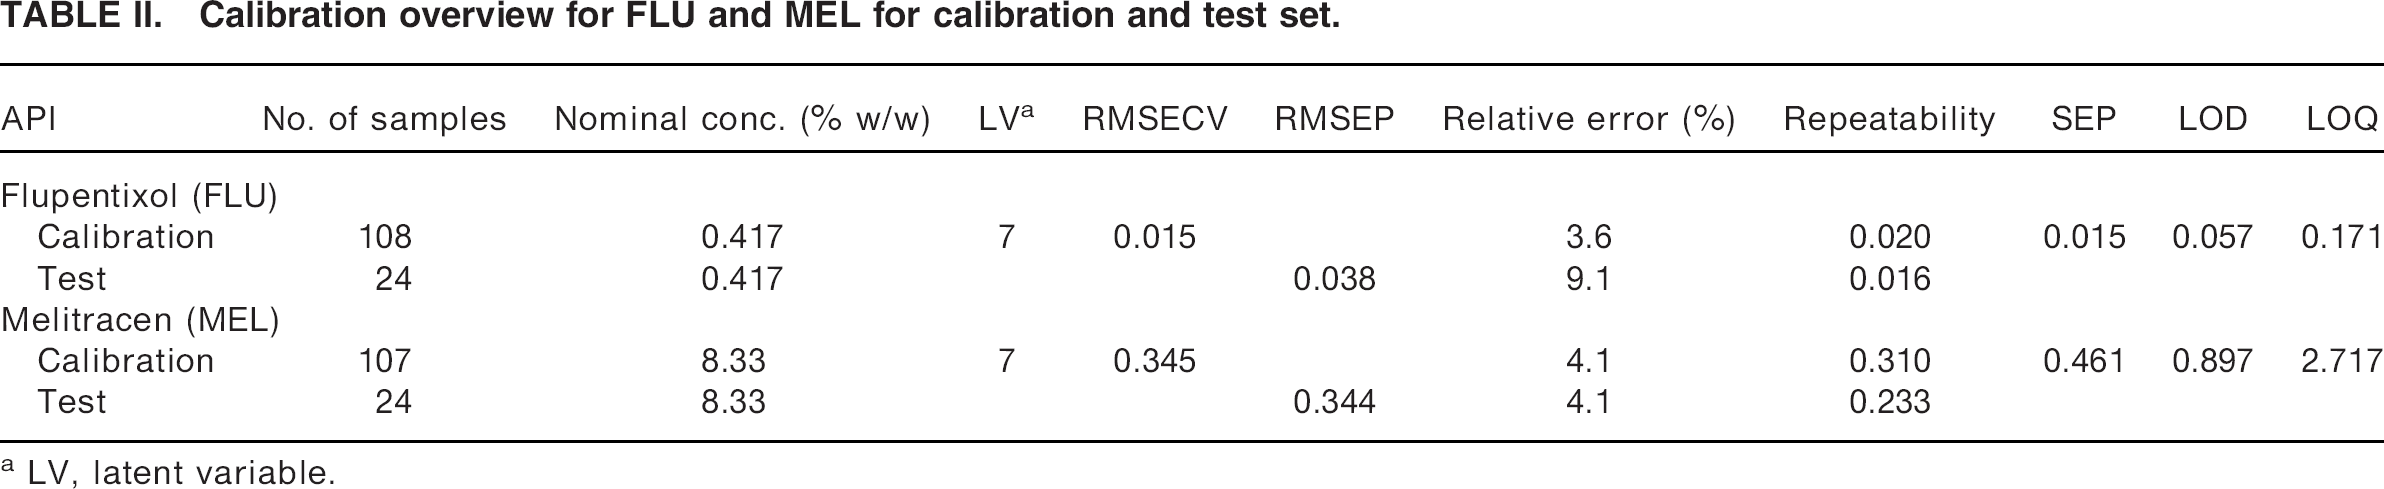
LV, latent variable.
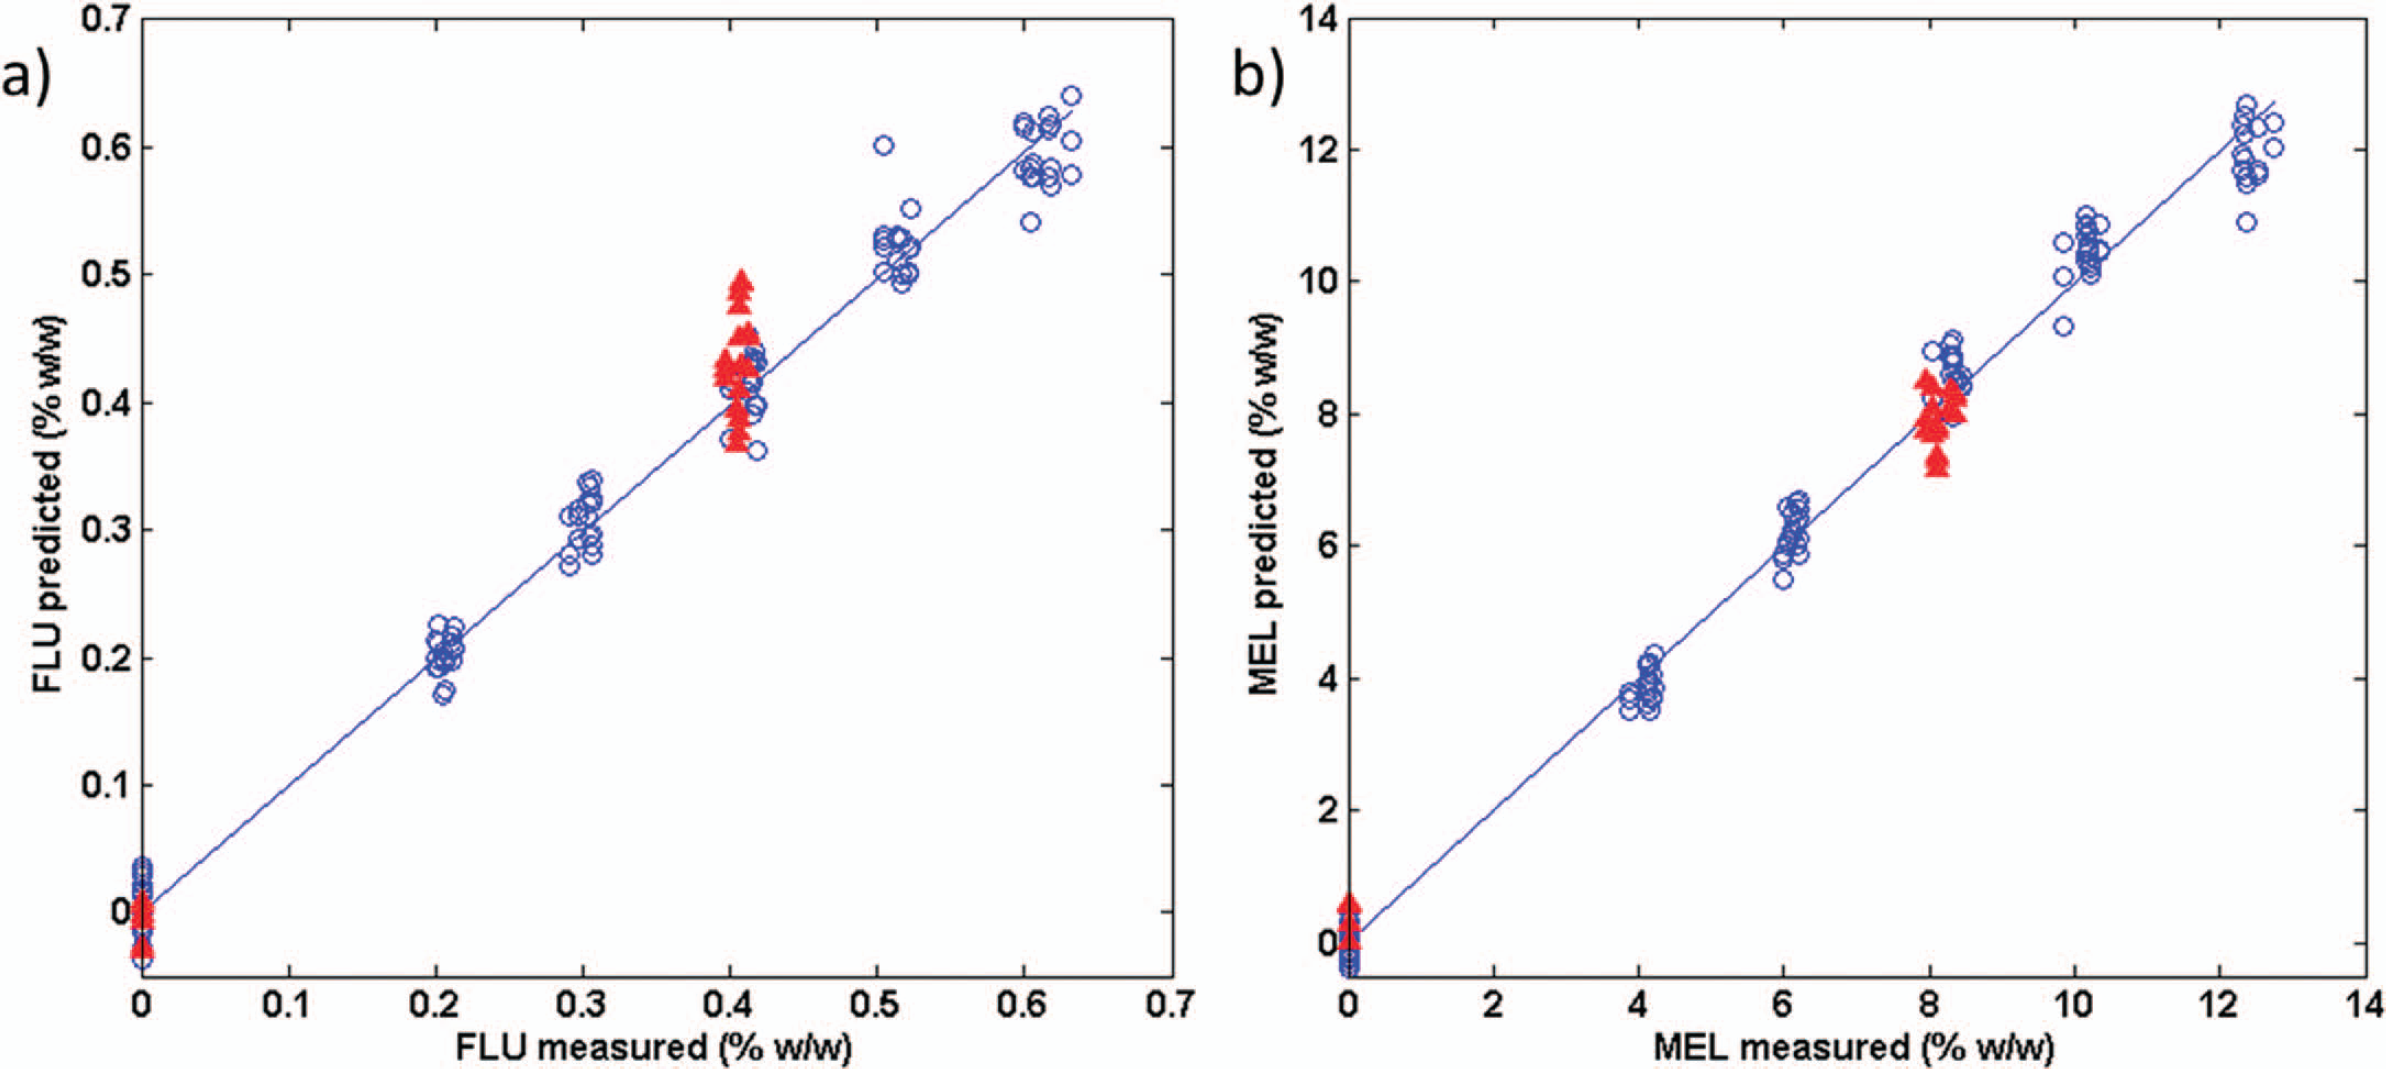
Predicted versus measured for the PLS models (a) FLU using seven latent variables on all excitation wavelengths. The slope is 0.996 for the calibration samples. (b) MEL using seven latent variables and four out of 18 excitation wavelengths selected using iPLS. The slope is 0.997 for the calibration samples. Blue samples (^) are from calibration set and the red samples (Δ) are test samples.
For flupentixol, despite the low active content, the highest concentration point (0.625% w/w) appears to be on the edge of the linear range. This is, however, resolved by using the logarithmic function, which is in line with the findings of Domike et al. 26 They found that for higher concentrations of caffeine (5–20% w/w) the best curve fit was a logarithmic function due to partial saturation of the detector. Lai et al. 17 solved the problems with inner filter effects due to high fluorescence from triamterene by using longer excitation wavelengths (weaker emission) for samples containing > 1% triamterene. Moreira et al. 23 describe different possibilities for dealing with a fluorescence signal of too high intensity by modifying the distance between the optical fiber and the sample and changing the excitation slit, thereby reducing the intensity of the radiation source.
The values for repeatability for FLU and MEL of 0.02 and 0.31% (w/w), respectively, are relatively high, which is assumed to be due to the fact that the fluorescence primarily occurs from the surface of the powder. Therefore, the result depends not only on wavelength but also on the surface topology (particle size and packing density). 16 In contrast to HPLC analysis, in which five tablets are dissolved and analyzed, fluorescence spectroscopy only measures a small part of the sample that is hit by the beam. This sampling inconsistency can be a challenge, especially for low concentrations of API, and one way to solve the problem is to increase the amount of calibration samples (tablets) from the same batch. Another way of improving the predictions and the repeatability is to increase the spot size and thus the sampling area.
Recovery for FLU and MEL for test samples compared to HPLC analysis.

Only samples at nominal concentration are included.
In the production of pharmaceutical tablets, it is desirable to analyze the API content, noninvasively and preferably online. For this purpose, a filter fluorescence system would be a possible solution. 17 However, a spectrofluorometer with only one filter cannot compensate for minor changes in the fluorescence from the excipients, and it cannot deal with quenching. Due to the complex nature of the FLU–MEL formulation, online measurements are a major challenge, since the single point approach did not show good results in the current study. The results obtained by only using the excitation–emission maxima for calibrations are FLU, RMSEP 0.10% (w/w), 23.9% relative deviation, LOD 0.059%, LOQ 0.180%; MEL, RMSEP 11.55% (w/w), 138.6% relative deviation, LOD 1.12%, LOQ 3.39%. In particular, the prediction of the test set seems to be poor for MEL. This may imply that there is more information in the fluorescence landscape, not covered by the chosen excitation wavelength, which contains valuable information, especially for new batches. The FLU–MEL application is therefore not expected to be suitable for a LIF sensor with only one or few excitation wavelengths. It should, however, be mentioned that the single point approaches have similar LOD and LOQ for both FLU and MEL compared with the model based on landscape data.
In this study, each sample measurement took 7–8 min, but it is possible to speed up the process with fewer excitation wavelengths and far fewer emission wavelengths (lower resolution). Simulations of the minimum number of wavelengths required showed that 12 excitation wavelengths out of 18 and every fourth emission wavelength (2 nm resolution) gave similar results (not shown) to the calibrations listed in Table II. This could reduce the analysis time down to 1.5 min per sample. Moreover, it would be of interest to measure fully noninvasively, i.e., directly on the tablet, instead of on the ground sample. This optimization should be possible, since a limited number of the tablets were analyzed directly in a Varian Cary Eclipse that uses a different sample holder (result not shown). In this study, a complex dataset with 36 tablet batches based on 12 granulate batches (one for each API level) was investigated. Each granulate consists of API and several excipients. In many studies, pure standard of the API is added to spread the range of the calibration. This does not take the variation of the excipients from the granulation into account. In this study, the calibrations are based on real batches (lab-scale), and the ratios between the added granulations are varied.
While this feasibility study can serve as a proof of concept, future studies will require many more samples to be included in order to study the different sources of variation. 45 Furthermore, it would be beneficial to investigate the quenching in more detail in order to understand more fully why and how the quenching occurs.
Despite interference from quenching, this study demonstrates that it is possible to achieve relative errors between 3 and 9% for both APIs using multivariate data analysis of the unfolded fluorescence landscapes.
CONCLUSION
A total of 36 tablet batches were analyzed with fluorescence spectroscopy using excitation wavelengths from 280 to 365 nm and emission wavelengths from 300 to 500 nm. The study demonstrates that single point calibrations are not sufficiently accurate and that a multivariate approach is required. Principal component analysis of the unfolded fluorescence data nicely recovers the experimental setup. Partial least squares regression with variable selection (iPLS) allows for simultaneous quantification of both actives, with an RMSEP of 0.038% (w/w) and a relative error of 9.1 % for flupentixol (0.417% w/w), and respective values of 0.344% (w/w) and 4.1 % for melitracen (8.33% w/w).