






Abstract
The dynamic properties of photothermal processes occurring after the initial photogenerated carrier recombination in the flash photolysis of a semiconductor plate sample probed with a reflected infrared beam are reported in this work. Transient kinetics pertaining to the photothermal processes always appear as interfering signals in that of the photogenerated carrier recombination and should be distinguished and excluded. We observed that the photothermal-induced Rayleigh wave occurs immediately after the photogenerated carrier recombination that is then followed by the photothermal-induced flexural vibration of the sample substrate with a set of intrinsic frequencies as reported in our previous work (Appl. Spectrosc. 2013. 67(5): 506–512). When these two faster types of waves decay, the transient decaying signal from the plate deformation due to the inhomogeneous temperature field remains for much longer than 22 ms. Thus, all three types of the photothermal dynamic processes of different temporal properties induced by the pulsed laser on an absorbing semiconductor thin plate are clearly identified.
Keywords
INTRODUCTION
Photogenerated carriers with a long lifetime in semiconductors play a crucial role in photocatalysis and solar energy conversion.1–4 The time-resolved transient absorption method has been used to trace the recombination dynamics of the photogenerated free carriers or carriers in shallow-trapped states for both the nanocrystalline film and the bulk crystal samples.5–11 However, some other non-carrier recombination signals, such as photothermal-induced flexural vibration of the sample, interfere with the carrier dynamic signal through deflecting the probe light, as reported in our previous work. 12 In our continued study, we find that there are still other non-carrier recombination processes contributing to the interfering signals in addition to the reported oscillation signal of photothermal-induced flexural vibration. This work reports two other non-carrier recombination processes, i.e., photothermal-induced Rayleigh wave and plate deformation occurring before and after the reported flexural vibration, respectively, giving a thorough view of the possible dynamic interference presenting in the photoinduced carrier recombination kinetics at a large time scale from micro- to milliseconds.
A Rayleigh wave is one of the two types of surface acoustic waves, with the other acoustic wave known as a Love wave. Rayleigh waves include both longitudinal and transverse motions that decrease exponentially in amplitude as the distance from the surface increases, whereas Love waves are horizontally polarized surface waves wherein the particle motion forms only a horizontal line perpendicular to the direction of propagation. The photoinduced Rayleigh wave has been investigated for the past 30 years through probe deflection detection13–15 in its application to seismological study, e.g., simulating surface waves on the earth's surface, and more recently through an imaging technique called Sagnac interferometry16–20 to observe the surface wave propagation induced by a laser pulse. In contrast, thermal-induced deformation in metals arising from local thermal expansion caused by the inhomogeneous temperature field after photoexcitation has been studied only since the 1980s;21–27 mainly, the propagation of longitudinal acoustic phonon and the coherence of longitudinal optical phonon were investigated with observation of the corresponding decay time, being limited only to a temporal range of picoseconds.
In the current work, we aim to distinguish the carrier recombination kinetics for photothermal-induced deflection kinetics in the flash photolysis of a thin rutile titanium dioxide (TiO2) single-crystal plate sample probed with a reflected infrared (IR) beam. We observed three different photothermal processes: (1) Rayleigh wave immediately after the carrier recombination, followed by standing waves of the whole plate, leading to (2) an oscillation signal known as flexural vibration, 12 and (3) a much slower decay.
A deflection signal in the milliseconds range is still discernible after the complete decay of the flexural vibration. This slower decay signal is attributed to the probe light deflection caused by an inhomogeneous temperature field in the bulk, giving rise to the plate deformation.
EXPERIMENTAL
The third-harmonic generation (355 nm) of a neodymium-doped yttrium aluminum garnet laser (Quanta Ray, Spectra Physics) with a pulse duration of 10 ns and a repetition rate of 10 Hz was used as the excitation light, and a mid-IR laser from a quantum cascade laser (QCL, Daylight Solutions) with a wavelength of 4.78 μm and an output power of several milliwatts was used as the probe light.
The reflected probe light was focused onto a liquid-nitrogen-cooled, mercury–cadmium–telluride (MCT) detector (KV104-0.5, Kolmar Technologies, with the MCT photodiode size of 0.5×0.5 mm2), from which the output signal was amplified by a current preamplifier (KA104, Kolmar Technologies) with a band width of 100 MHz, and the amplified signals were digitized by an oscilloscope (TDS 520A, Tektronix) interfaced to a personal computer for data acquisition and further analysis. The total instrumental response time of the whole setup was 80 ns.
The commercially available rutile (Heifei Kejing Material Technology Co. Ltd.) TiO2 single crystals used in the experiment were cut into a square plate of 10 × 10 × 0.5 mm 3 with (001) plane exposed. One specific sample named the TiO2-silcion dioxide (SiO2)-Au sample (Fig. 1a) was coated by means of the electron beam vapor deposition method with a SiO2 layer and a Au layer successively, where a 120 nm-thick layer of SiO2 coated on the unpolished side of TiO2 and a 60 nm-thick layer of Au was deposited on the SiO2 layer. The sample was prepared to distinguish the non-carrier recombination signal from the carrier recombination kinetics when the probe light is on the opposite side of the TiO2 excitation light, because the carriers cannot penetrate through the SiO2 insulating layer. A more detailed description can be found in our previous work. 12 Moreover, to trace the Rayleigh wave, the diameter of the excitation beam was increased from 2.0 to 6.0 mm, while that of the IR probe beam was kept smaller than 0.5 mm. The surface wave signals for different excitation beam sizes were detected at the uncoated rutile TiO2 single-crystal plate. The fluence of the excitation laser is 70 mJ/cm2 per pulse.
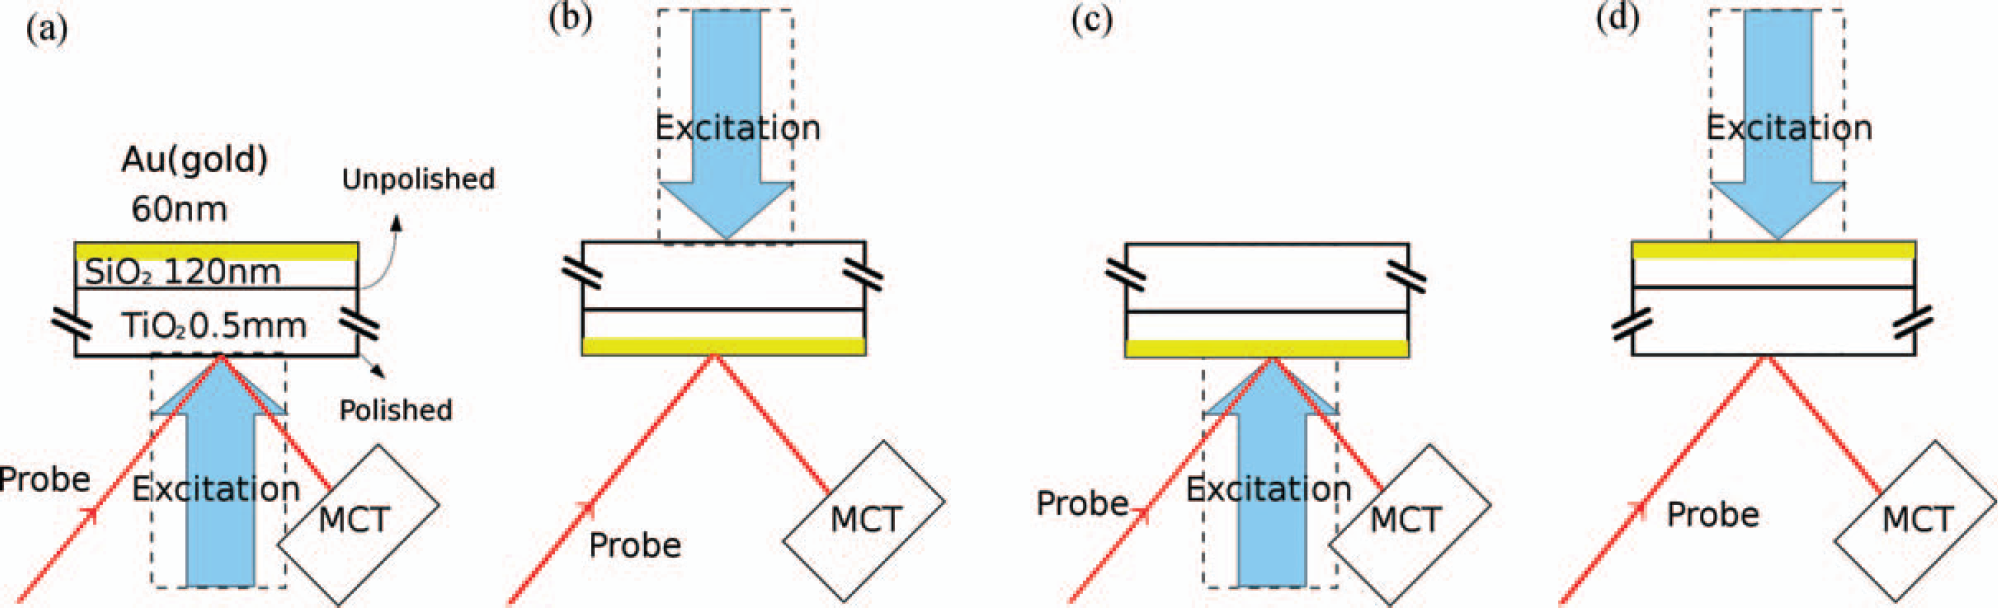
Schematic diagram showing the multilayered structure of the coated TiO2 single-crystal plate (001) and four different arrangements of the excitation and detection beams: (
The excitation power dependence for an uncoated rutile TiO2 single-crystal plate is also performed to examine the thermal process, where the diameter of the excitation beam is 5.0 mm and the fluence is varied from 9.7 to 76.5 mJ/cm2.
RESULTS AND DISCUSSION
The excitation and probe beams were incident on the two sides of the TiO2–SiO2–Au sample, respectively, in turn with four different combinations shown in Fig. 1, and the four corresponding acquired kinetic curves are shown in Figs. 2 and 3 at different time scales. Note that the signs of the signals when excitation and probe beams are incident on the same surface are opposite to those when they are on different sides, indicating that the vibration and the deformation of the sample plate dominate the whole process, because the photogenerated carrier absorption signal would not change its sign in the different excitation probe arrangements. To compare these four signals clearly, we change the sign of some signals denoted by “inverted” in the figures. These four signals are basically similar except for the signals at the very beginning after the excitation pulse in Fig. 2. We note that these very beginning signals present only when the excitation and the probe beams are incident on the same side of the sample, indicating that there are some localized processes such as carrier recombination or surface wave that cannot penetrate through the bulk arriving at the other side of the sample. Within a scale of 10 μs, the kinetics for the carrier recombination and the surface wave cannot be identified. However, as discussed below, they can be clearly distinguished at a time scale of 2 μs, revealing that the surface wave follows after the charge carrier recombination. The remaining parts for all the cases are quite similar, persisting in a much longer time scale shown in Fig. 3, where two types of decays exist, i.e., decaying of the vibration amplitude attributable to the flexural vibration signal as we reported previously 12 and the decaying envelope attributed to the relatively slower relaxation of the plate deformation.
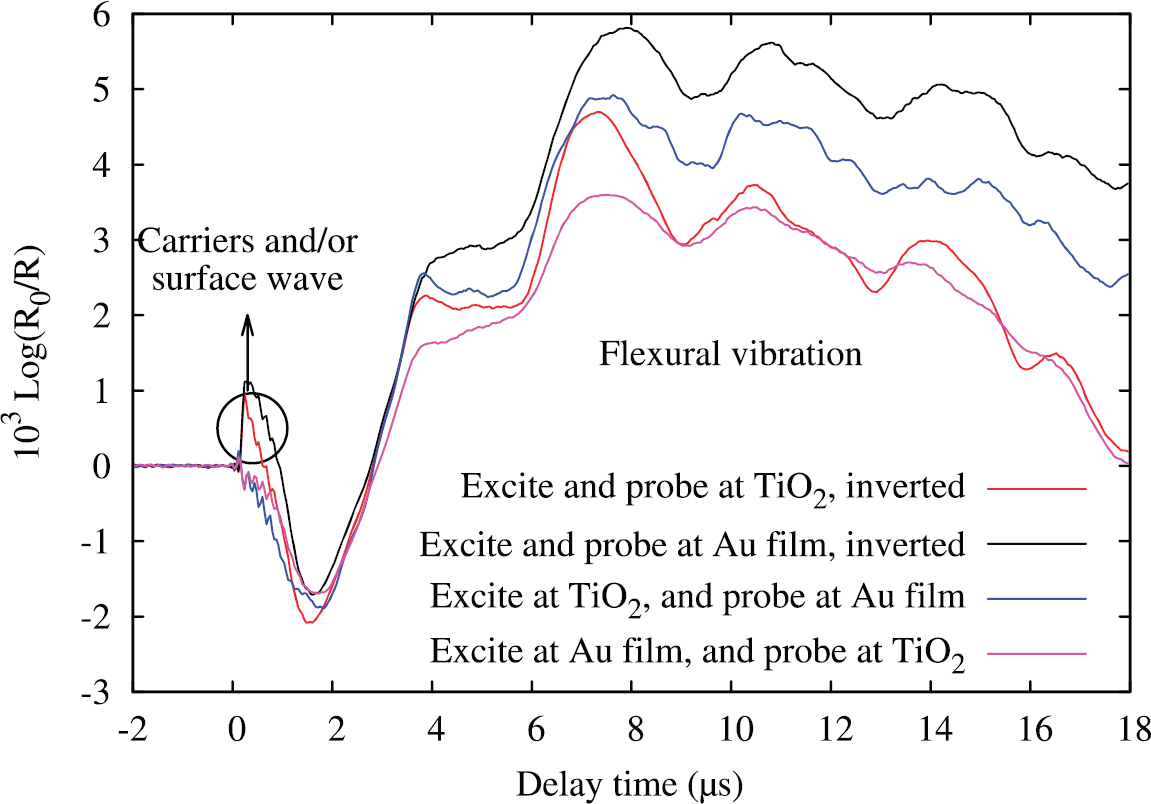
Dynamic curves of four cases when exciting and probing at different sides of the TiO2-SiO2-Au sample. The signals for both beams at one side are inverted so that the four signals can be compared.
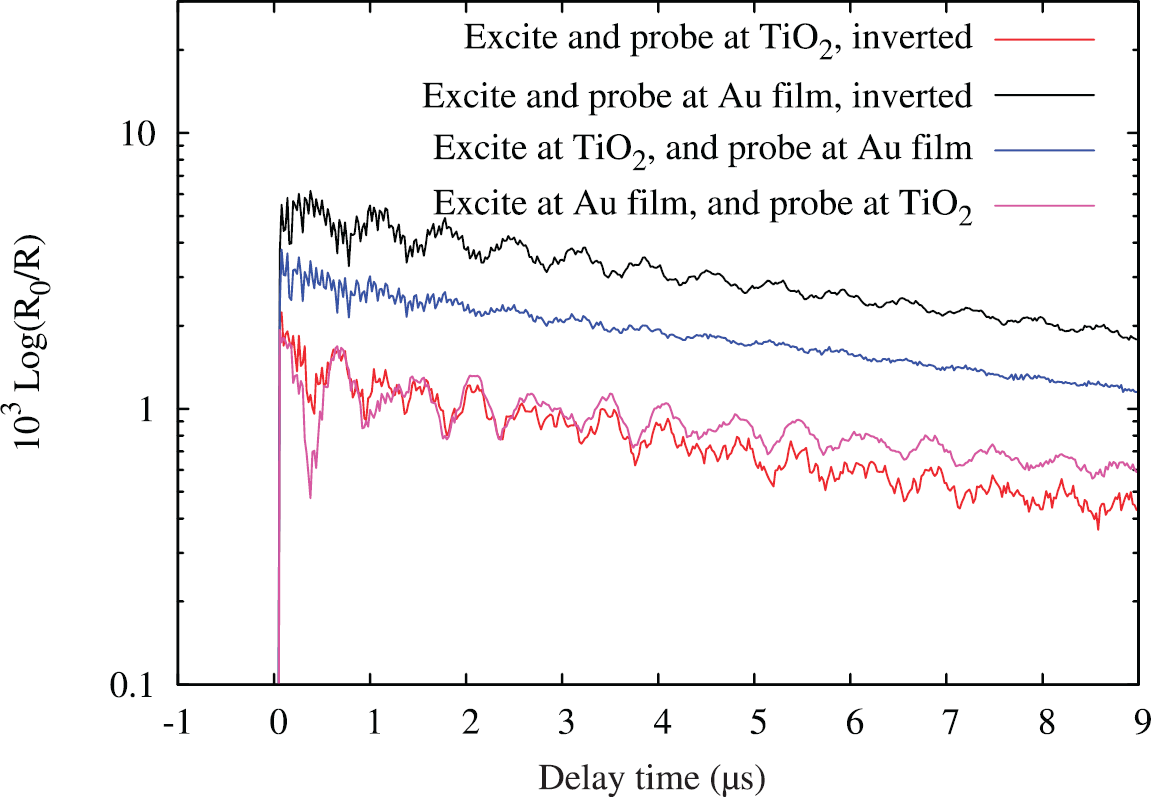
Semi-logarithmic dynamics of four cases when exciting and probing at different sides of the TiO2-SiO2-Au sample at the millisecond time scale.
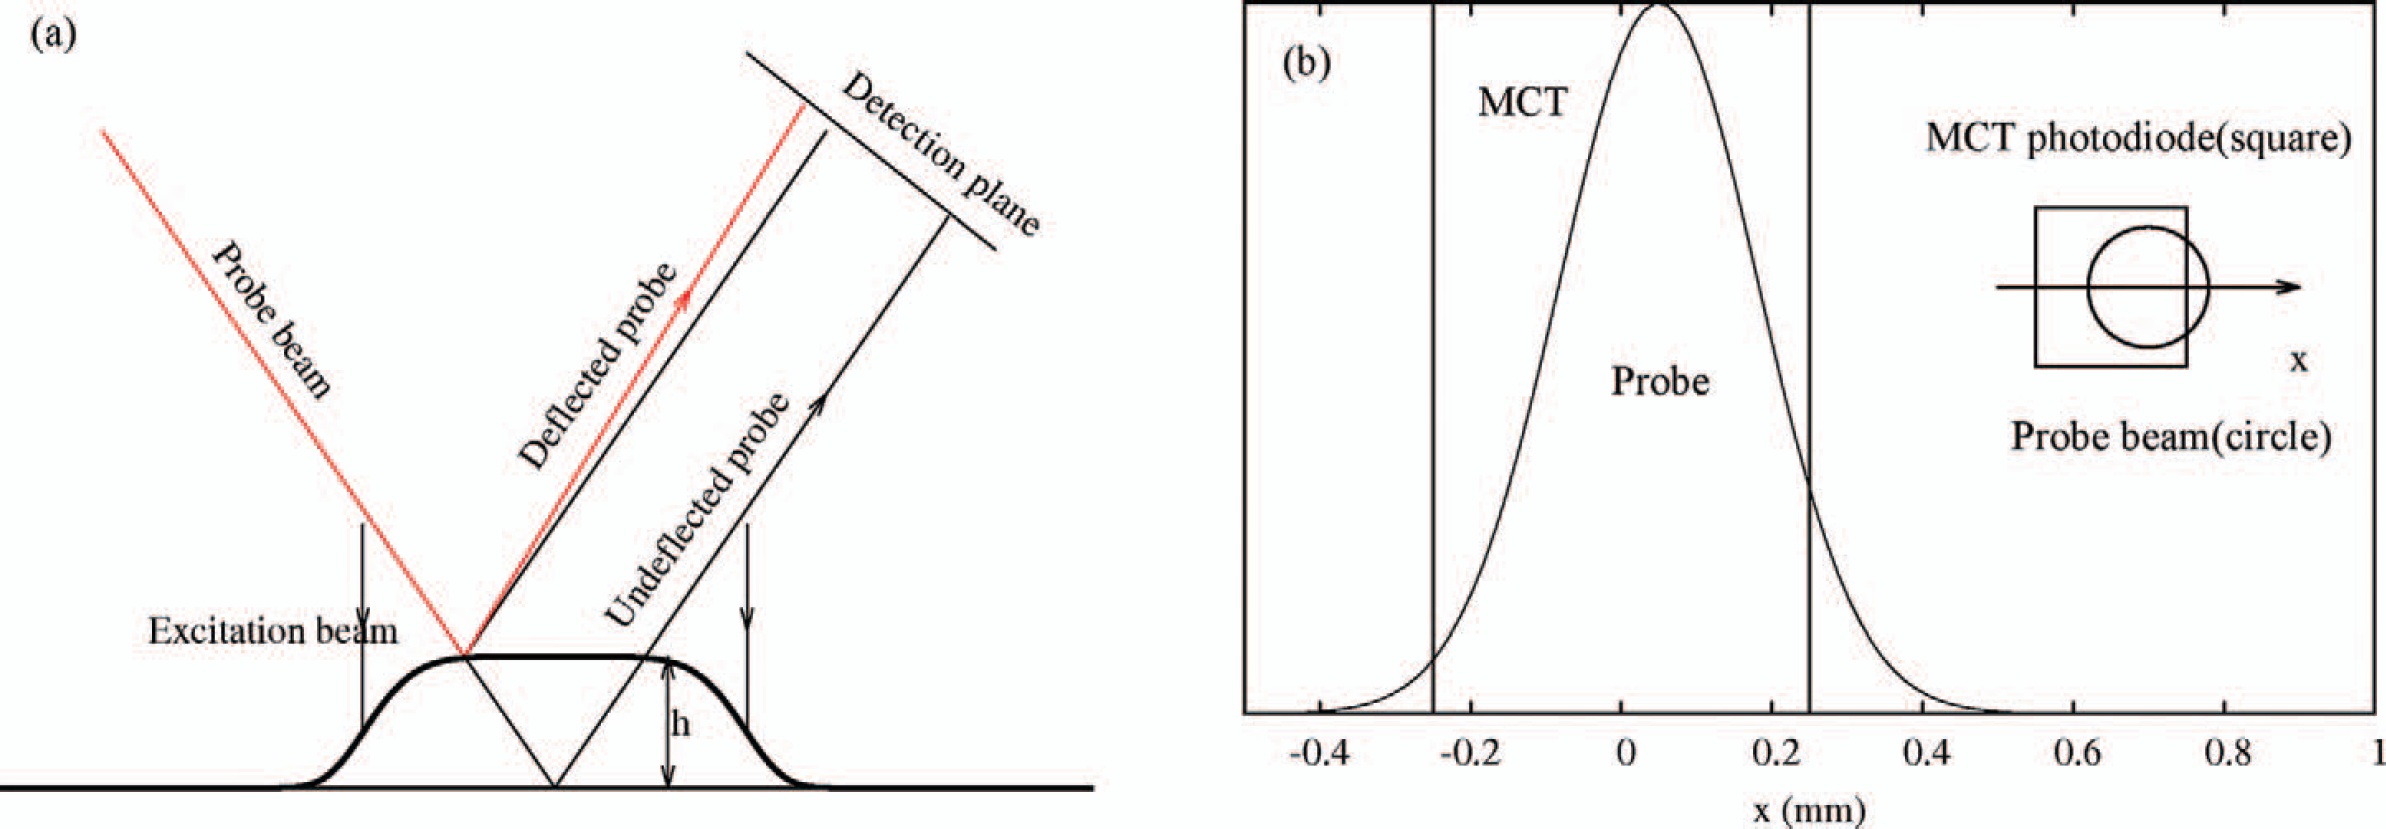
Schematic diagrams for photothermal probe experiment. (
The movement of the probe beam from the initial position in the square MCT photodiode results in the changing of the reflection signal shown in Fig. 4b. The initial position of the probe beam is set off-center with respect to the photodiode so that the reflection signal will increase when the probe beam moves toward the center of the photodiode; otherwise, the reflection signal will decrease. By this method, a very small surface distortion due to thermal expansion can be observed, e.g., observation of distortions even as small as 10−3 Å has been reported previously.16,28,29
To examine the propagating property of the Rayleigh wave, we gradually increased the diameter of the excitation beam from 2.0 to 6.0 mm, while that of the probe beam was kept smaller than 0.5 mm. Then, a series of optical deflection kinetic curves at a varied excitation beam size were recorded (Fig. 5), where the time duration of the rapid rising and decaying signal appearing immediately after the excitation beam is about 200 ns, comparable to the temporal response limitation of the detection system, and it is almost unvaried to the change of the excitation beam size. The recombination time of charge carriers in the rutile TiO2 crystal is estimated to be 4 ns at an excitation fluence of 10 mJ/cm2,10 a value that is smaller than 80 ns (the response time of the detection system). Therefore, this fast process is considered as the carrier recombination process. We notice that the emergence time for the maximum of the bump after the carrier recombination signal correlates to the excitation beam size, i.e., the larger the excitation beam size, the longer the time taken for the bump to reach its maximum. This dynamic feature is quite different from that of the carrier recombination, and we tentatively attribute the observed bump in the optical deflection kinetics to the surface distortion aroused by the thermal-induced surface wave, i.e., the Rayleigh wave. Therefore, as mentioned in the previous section, the kinetics for the carrier recombination and the surface wave can be clearly distinguished at a time scale of 2 μs.
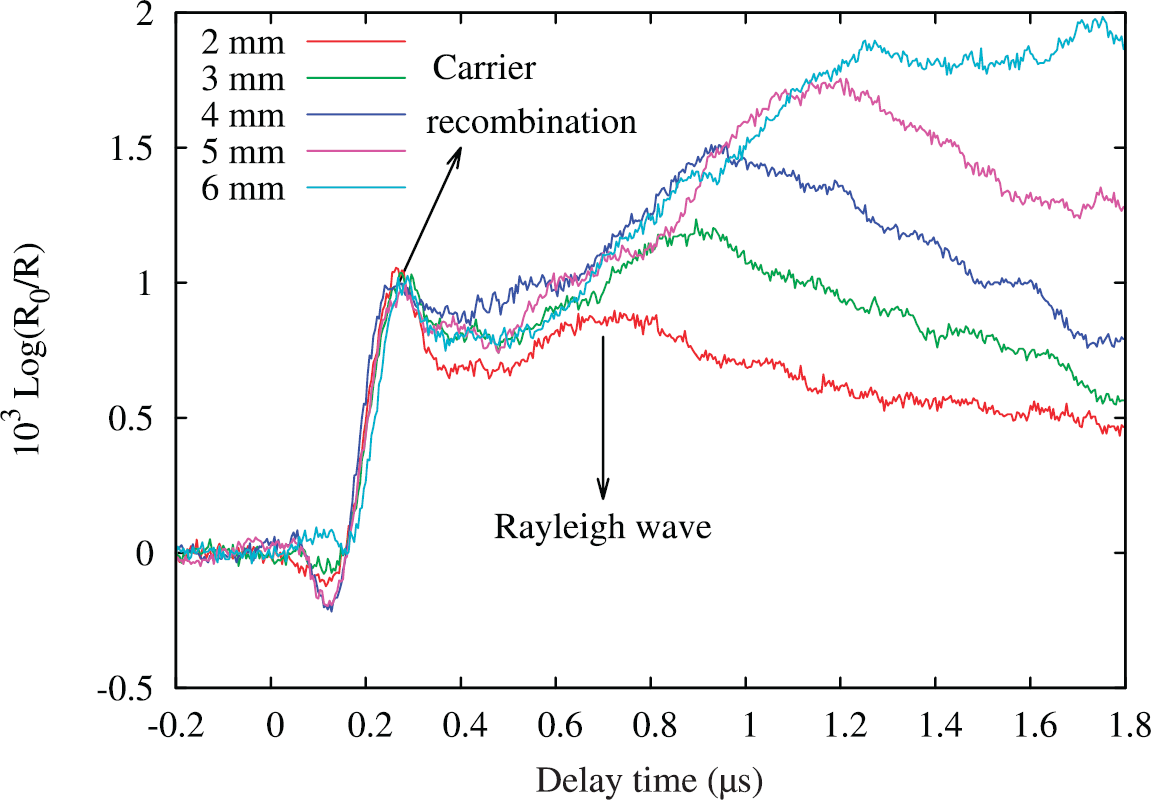
Deflection dynamics of a TiO2 plate with varying sizes of excitation beams at a fixed probe beam size of 0.5 mm.
For a better understanding, the probe deflection signal due to the Rayleigh wave is simulated as described more detail in the Supplemental Material. As a ripple-like surface acoustic wave of axial symmetry,17–20 the propagation of Rayleigh wave in the radial direction has been simulated. It is deduced from the equation for the linear elastodynamics describing the displacement vector

where ρ is the density, and λ and μ are Lamb's coefficients. Using Helmholtz decomposition to decompose Eq. 1 to a curl-free component (φ) and a divergence-free component (

The differential equation can be composed to


We can obtain displacement

where Jv is the vth order Bessel functions of the first kind, C is a constant, s = ω/cR, ω is the angular frequency, and η= c R /c s , η = c s /c d where cR is the velocity of Rayleigh wave, and cs and cd are the shear and longitudinal velocity of the bulk acoustic waves, respectively.
Because of the Bessel form of the function, the propagation of Rayleigh wave in radial direction can be obtained numerically from Hankel transform and inverse Hankel transform of the initial condition of the scalar potential. 32 The transform code for Mathematica is given in section 2 of the Supplemental Material. uz(r+ur) is approximately the same as uz(r), because ur here is estimated to be about 1 nm, much smaller than r, as mentioned in the Supplemental Material. The time evolution of z component of the radial function of Rayleigh wave in the radial direction is thus shown in Fig. 6, with an initial scalar potential shown in Fig. S1 and the r component of the radial function in Fig. S2 in the Supplemental Material.
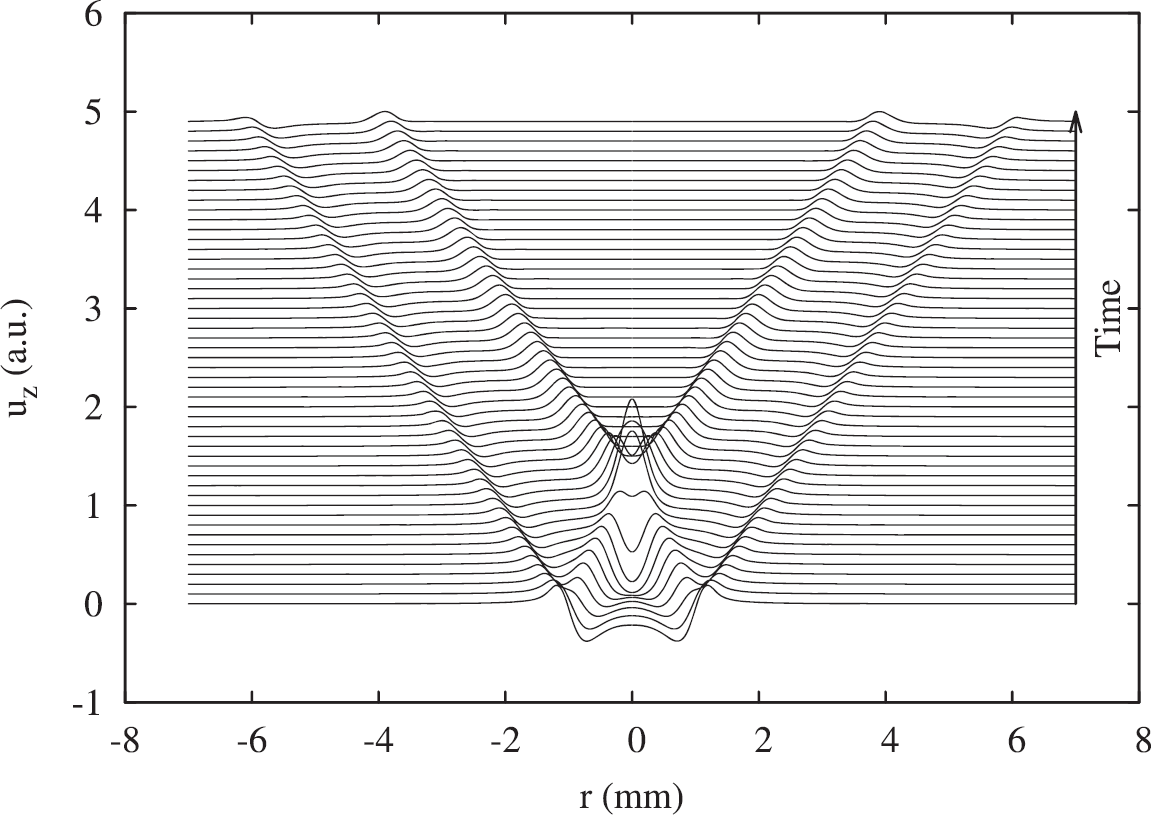
Time evolution of z component of radial function of Rayleigh wave along the diameter.
According to Fig. 4, the deflected reflection signals for different excitation beam sizes are simulated and shown in Fig. 7, where the bumps are similar to those in Fig. 5. We attribute the profile difference between Fig. 7 and Fig. 5 of Rayleigh waves to the approximation of the zero probe beam size used in the simulation. In Fig. 8, the experimental and simulated relationship between the radius of the excitation beam and the appearing time of the deflection peak is plotted. The time zero in simulation is added with 0.4 μs, at which the carrier recombination has almost finished as shown in Fig. 5. The value of simulated slope is 4.32 km/s, being slightly larger than the experimental value of 3.46 km/s. This difference can be attributed to the assumption in the simulation that the surface wave is not dispersive.
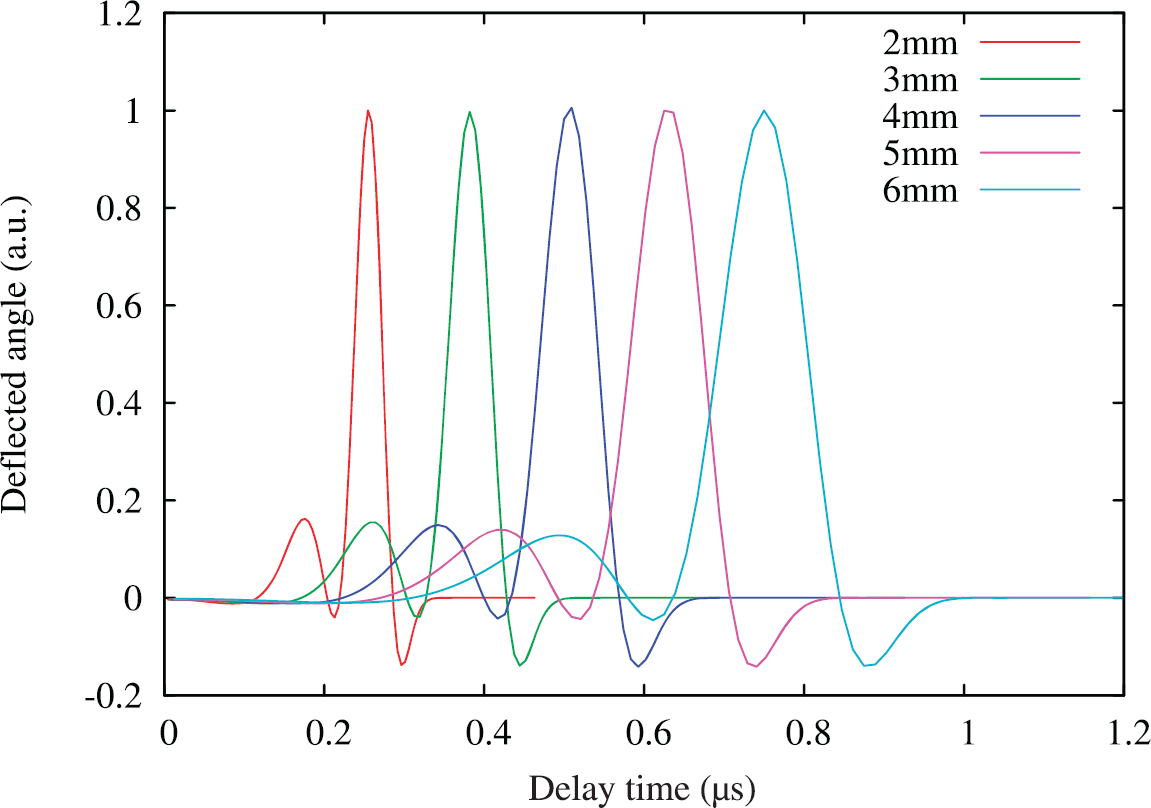
Simulated dynamics of the deflected probe beam at varied excitation beam size.
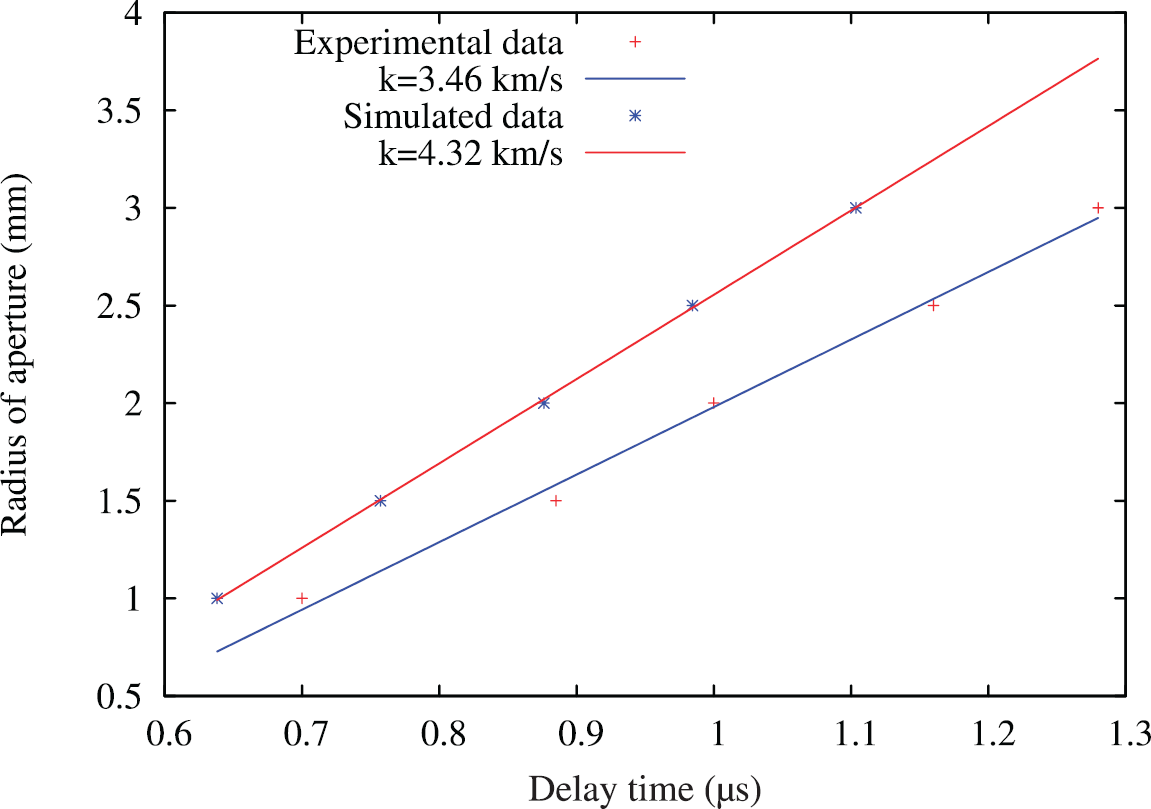
Plot of the appearing time of the peak of the surface wave signals against the radius of the excitation beams denoted by + symbol and fitting line with a slope of 3.46 km/s. Plot of the appearing time for the peak of surface wave signals and the radius of the excitation beams for the simulation results denoted by asterisk (*) and fitting line with a slope of 4.32 km/s, where the time zero has been added with 0.4 μs to take into account of the carrier recombination process.
The 355 nm excitation power dependence of the carrier recombination kinetics and Rayleigh wave is shown in Fig. 9; note a growing intensity as the excitation power increases. At a lower excitation power of 9.7 mJ/cm2, the early kinetics mainly consists of the carrier recombination kinetics, while the Rayleigh wave signal is rather small. When further increasing the excitation power, the intensity of the Rayleigh wave grows more significantly than that of the carrier recombination kinetics (Fig. 9). For comparison, the kinetics for excitation at 532 nm is plotted as the red line in Fig. 9. Apparently, there is no obvious carrier and non-carrier signal, because the absorption coefficient of TiO2 at 532 nm is much smaller than that at 355 nm, so the TiO2 crystal would be warmed up homogeneously, and it is expected that there would be no observable surface effect.
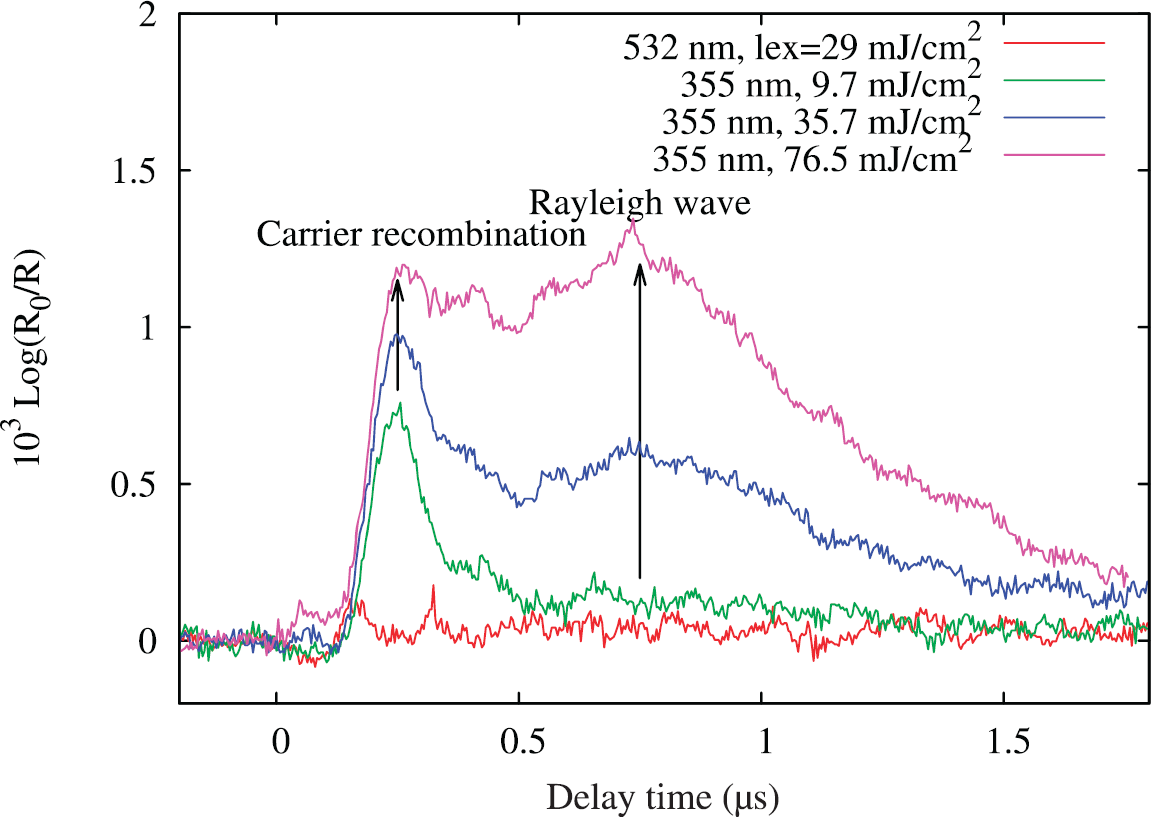
Effect of 355 nm excitation power on the charge recombination kinetics and Rayleigh waves observed for an uncoated 10 × 10 × 0.5 mm 3 TiO2 single-crystal plate: green line, 19 mJ/cm2; blue line, 35.7 mJ/cm2; and magenta line, 76.5 mJ/cm2. The red line is the acquired kinetics excited 532 nm with a fluence of 29 mJ/cm2 for comparison.
Based on our experimental results, it can be concluded that both the excitation power and the probing methods determine the contributions from the thermal effects. The effect of the excitation power is shown in Fig. 9. To elucidate the whole thermal-induced deflection phenomenon, the probe beam is reflected from the sample in the current experiment, thereby enlarging the deflecting contribution as shown in Fig. 10 and showing that the detected thermal effect in the reflection beam is larger than the transmitted beam in a typical case of a 17° incident angle, although the thermal effect detected in the transmitted beam is larger than that when the probe beam is perpendicular to the surface of the sample. In our previous work, 12 we showed that the interference between the transmitted probe beam and the reflected beam on a calcium fluoride window would also enhance these thermal effects.
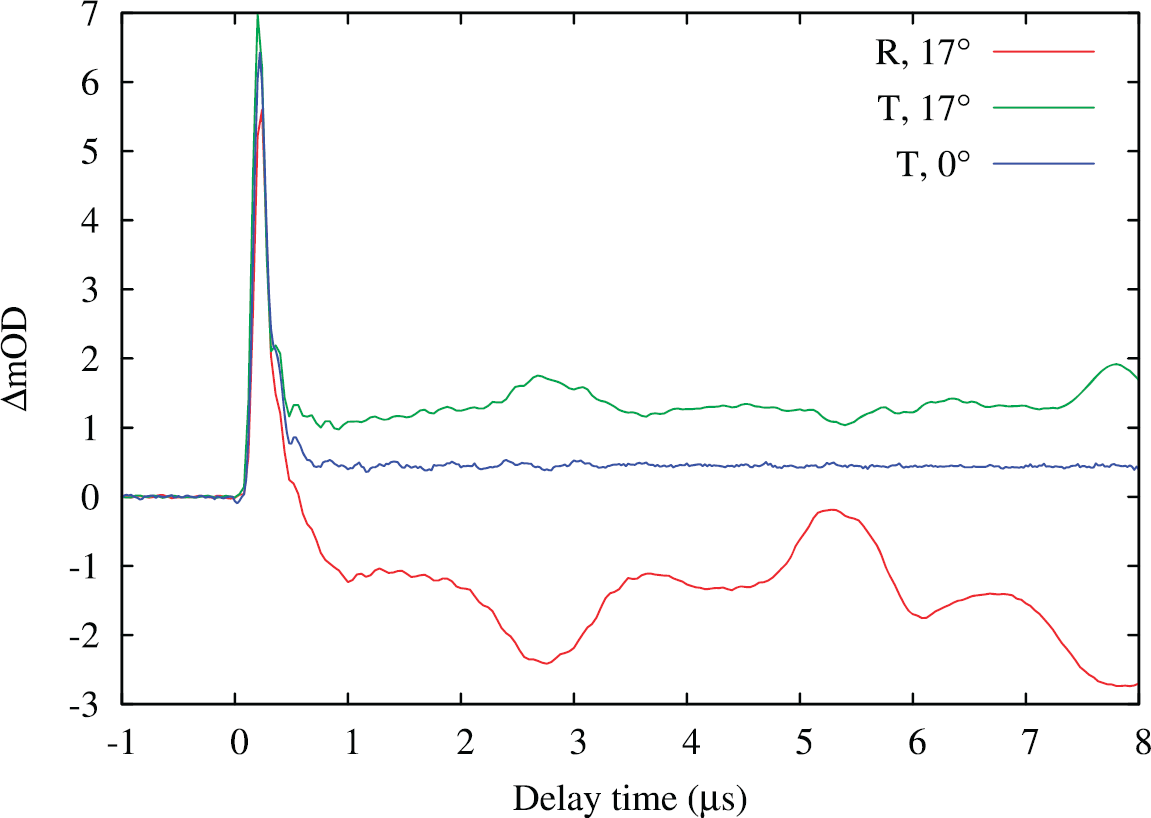
Signals for the uncoated TiO2 single-crystal plate excited by 355 nm with a fluence of 70 mJ/cm2 at different probing incident angles acquired at the microsecond time scale. The blue line shows the probe beam is normal to the sample surface and the transmitted beam is detected. The red and green lines indicate the probe beam, having an incident angle of 17°; both reflected and the transmitted beams are detected, respectively.
Generally, the carrier recombination kinetics would dominate at the early phase in the transmitted probe beam, especially when the probe beam is normal to the surface of the sample (Fig. 10, blue line). On a millisecond time scale, when the carrier recombination kinetics diminishes, only the thermal effect owing to the relaxation of the photoexcited crystal remains (Fig. 11, viewed in a large time scale). As a result, because of the coexistence of the carrier recombination and thermal effects, currently there is no effective method to completely separate the carrier recombination kinetics from the thermal effects for crystal samples. However, to suppress the thermal effects, using a transmitted probe beam of zero incident angle and a sufficiently low excitation power can be effective.
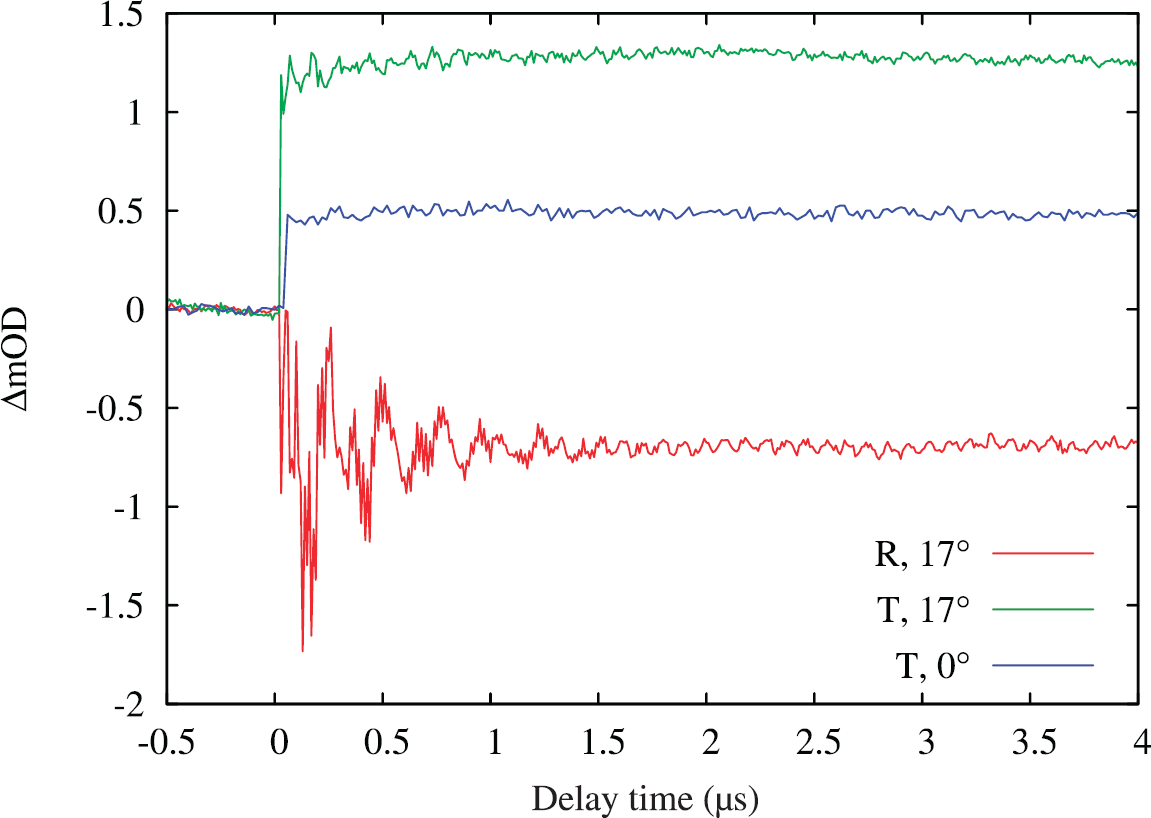
Signals for the uncoated TiO2 single-crystal plate excited by 355 nm with a fluence of 70 mJ/cm2 at different probing incident angles at the millisecond time scale.
CONCLUSIONS
In addition to the oscillating deflection signal from the flexural vibration of the substrate, in the current work we further identify two more dynamic processes arising from the photothermal processes other than the photogenerated charge recombination process during the ultraviolet laser flash photolysis of TiO2 thin single-crystal plate probed by the reflected IR laser. The deflection signals arising from three different physical mechanisms, i.e., Rayleigh wave, flexural vibration of the substrate, and the plate deformation due to the inhomogeneous temperature field in the bulk, would interfere the investigation of the photoinduced charge carrier recombination dynamics. The phenomenon can be realized in the transient photolysis experiments for the solid samples as the acoustic effect occurring in the solution phase. 38 Their time sequence is as the follows: Rayleigh wave appears immediately after the carrier recombination and then follows the oscillation signal from the flexural vibration, while the relaxation of the plate deformation takes the longest time. To minimize the interference from the thermal effect in the measurement of the photoinduced charge recombination process, we suggest the use of an excitation power as low as possible and the use of the transmitted beam normal to the surface of the solid sample as the probe beam.
Footnotes
ACKNOWLEDGMENTS
This work is supported by the Natural Science Foundation of China (grants 20925313, 21090342), National Basic Research Program of China (grant 2009CB930700), and Chinese Academy of Sciences Innovation Program (KJCX2-YW-W25).