
Abstract
Presented in this paper is an assessment of the applicability of Raman spectroscopy and microspectrophotometry (MSP) in visible and ultraviolet light (UV–Vis) in the examination of textile fibers dyed with mixtures of synthetic dyes. Fragments of single polyester fibers, stained with ternary mixtures of disperse dyes in small mass concentrations, and fragments of single cotton fibers, dyed with binary or ternary mixtures of reactive dyes, were subjected to the study. Three types of excitation sources, 514, 633, and 785 nm, were used during Raman examinations, while the MSP study was conducted in the 200 to 800 nm range. The results indicate that the capabilities for discernment of dye mixtures are similar in the spectroscopic methods that were employed. Both methods have a limited capacity to distinguish slightly dyed polyester fiber; additionally, it was found that Raman spectroscopy enables identification of primarily the major components in dye mixtures. The best results, in terms of the quality of Raman spectra, were obtained using an excitation source from the near infrared. MSP studies led to the conclusion that polyester testing should be carried out in the range above 310 nm, while for cotton fibers there is no limitation or restriction of the applied range. Also, MSP UV–Vis showed limited possibilities for discriminatory analysis of cotton fibers dyed with a mixture of reactive dyes, where the ratio of the concentration of the main dye used in the dyeing process to minor dye was higher than four. The results presented have practical applications in forensic studies, inter alia.
INTRODUCTION
Color is a particularly important feature of a textile, from the perspective of a potential buyer. The process of textile colorization primarily involves the use of a variety of synthetic dyes, with a mixture of them often employed in the process, as opposed to using any single, particular dye.
Textiles, as well as their basic elements, i.e., single fibers, play a very important role in forensic science. 1 Fragments of single fibers may constitute forensic microtrace evidence, allowing forensic experts to recreate transpired events accurately. In forensic laboratories, examination of this kind of evidence involves detaching and separating fibers intertwined primarily as a result of textile surfaces being rubbed together during physical contact. The task of the forensic expert is to identify a fragment of a single fiber and then to compare it with fibers that come from a particular, known source (e.g., a suspect's clothing).
The growing popularity of polyester fibers in garment production can be seen through the increase in annual polyester fiber and filament production, from 20 million tons in 2002 to more than 41 million tons in 2012. 2 Cotton fiber has been cultivated for 7000 years, and its popularity among consumers has increased as it is blended with other fibers and coated with performance-enhancing finishes through modern technology. 3 Information concerning the presence of single fiber fragments dispersed in the environment can only be obtained based on the results of population studies, which define how frequently a certain type of fiber is encountered within a given geographical area. 4 Considering fiber type exclusively, cotton fibers are among the most ubiquitous in the environment. The color of certain types of fiber evidence also plays a very substantial role in the assessment of its evidential value in forensic science; blue cotton fibers, for example, are usually encountered more frequently than red or green ones, since blue denim apparel has high demand and high production. 4
Color plays a crucial role, in the case of comparative fiber studies. Optical microscopy and microspectrophotometry (MSP) in the ultraviolet and visible range (UV–Vis) are methods traditionally used for comparing colors of textile fibers in forensic studies.5–9 MSP is a means of measuring the interaction of radiation from different wavelengths of light, across the UV–Vis range, in terms of absorption or transmission; it has the capability of measuring the physical result of this interaction between the radiation and the substance being examined (containing chromophores). Fiber dyes are substances that contain conjugated systems of excitable electrons. MSP allows for the measurement and comparison of colors of small samples, such as fragments of single fibers, but does not provide information on the types of dyes present in the fibers. It is possible to identify the coloring substances using thin-layer chromatography, capillary electrophoresis, or liquid chromatography, but, because of their destructive nature, these methods are not widely used in forensic research. Raman spectroscopy, however, is used with increasing frequency in the identification of dyes and comparison of dyed fibers.10–13 In recent years, developments in Raman instrumentation-particularly regarding juxtaposition of the spectrometer and optical microscope—have made this technique more attractive for analytical use. Raman spectroscopy has been deemed the only technique through which molecular structural information concerning the dye present in a fiber may be obtained in a virtually nondestructive manner. There are numerous studies in the literature, relating to Raman research of cotton fibers dyed with one type of dye, yet only a few concern the identification and comparison of cotton fibers treated with mixtures of dyes.11,14
The study presented herein was dedicated to the possibility of distinguishing between the currently most prevalent types of textile fibers—polyester and cotton, dyed with mixtures of disperse and reactive dyesusing nondestructive Raman spectroscopy and UV–Vis MSP. The purpose of the research was to determine the possibility of identifying each component of the dye mixture, thereby verifying the practicability of dye type identification in actual cases of forensic fiber trace studies.
MATERIAL
Single fibers, selected from five woven polyester fabrics (one ready to dye, four dyed) and 11 knitted cotton fabrics (one ready to dye, 10 dyed; Table I), as well as 25 individual dyes used for fabric coloring (12 disperse, 14 reactive), in powdered form (Table II), were used in the study. polyester fabrics made of polyethylene terephthalate (PET) were stained with ternary mixtures of disperse dyes, in low mass concentration dye baths, ranging from 0.019% to 0.480%. Knitted cotton fabrics were dyed with binary or ternary mixtures of reactive dyes, at a mass concentration of 0.1 % to 3.0%. The fabrics were dyed in laboratory conditions, using an Ugolini Redkrome dyeing apparatus, equipped with infrared heating. Dye concentrations in the fabric samples were calculated based on the absorbency values of the dye-bath samples, taken at the beginning and end of each dyeing process, using a UV–Vis–NIR Jasco V-670 spectrophotometer. It was concluded, through visual color assessment, that all of the woven and knitted fabric samples tested differ from one another. The polyester and cotton fabrics used in this study contained no auxiliary additives or optical brightening agents.
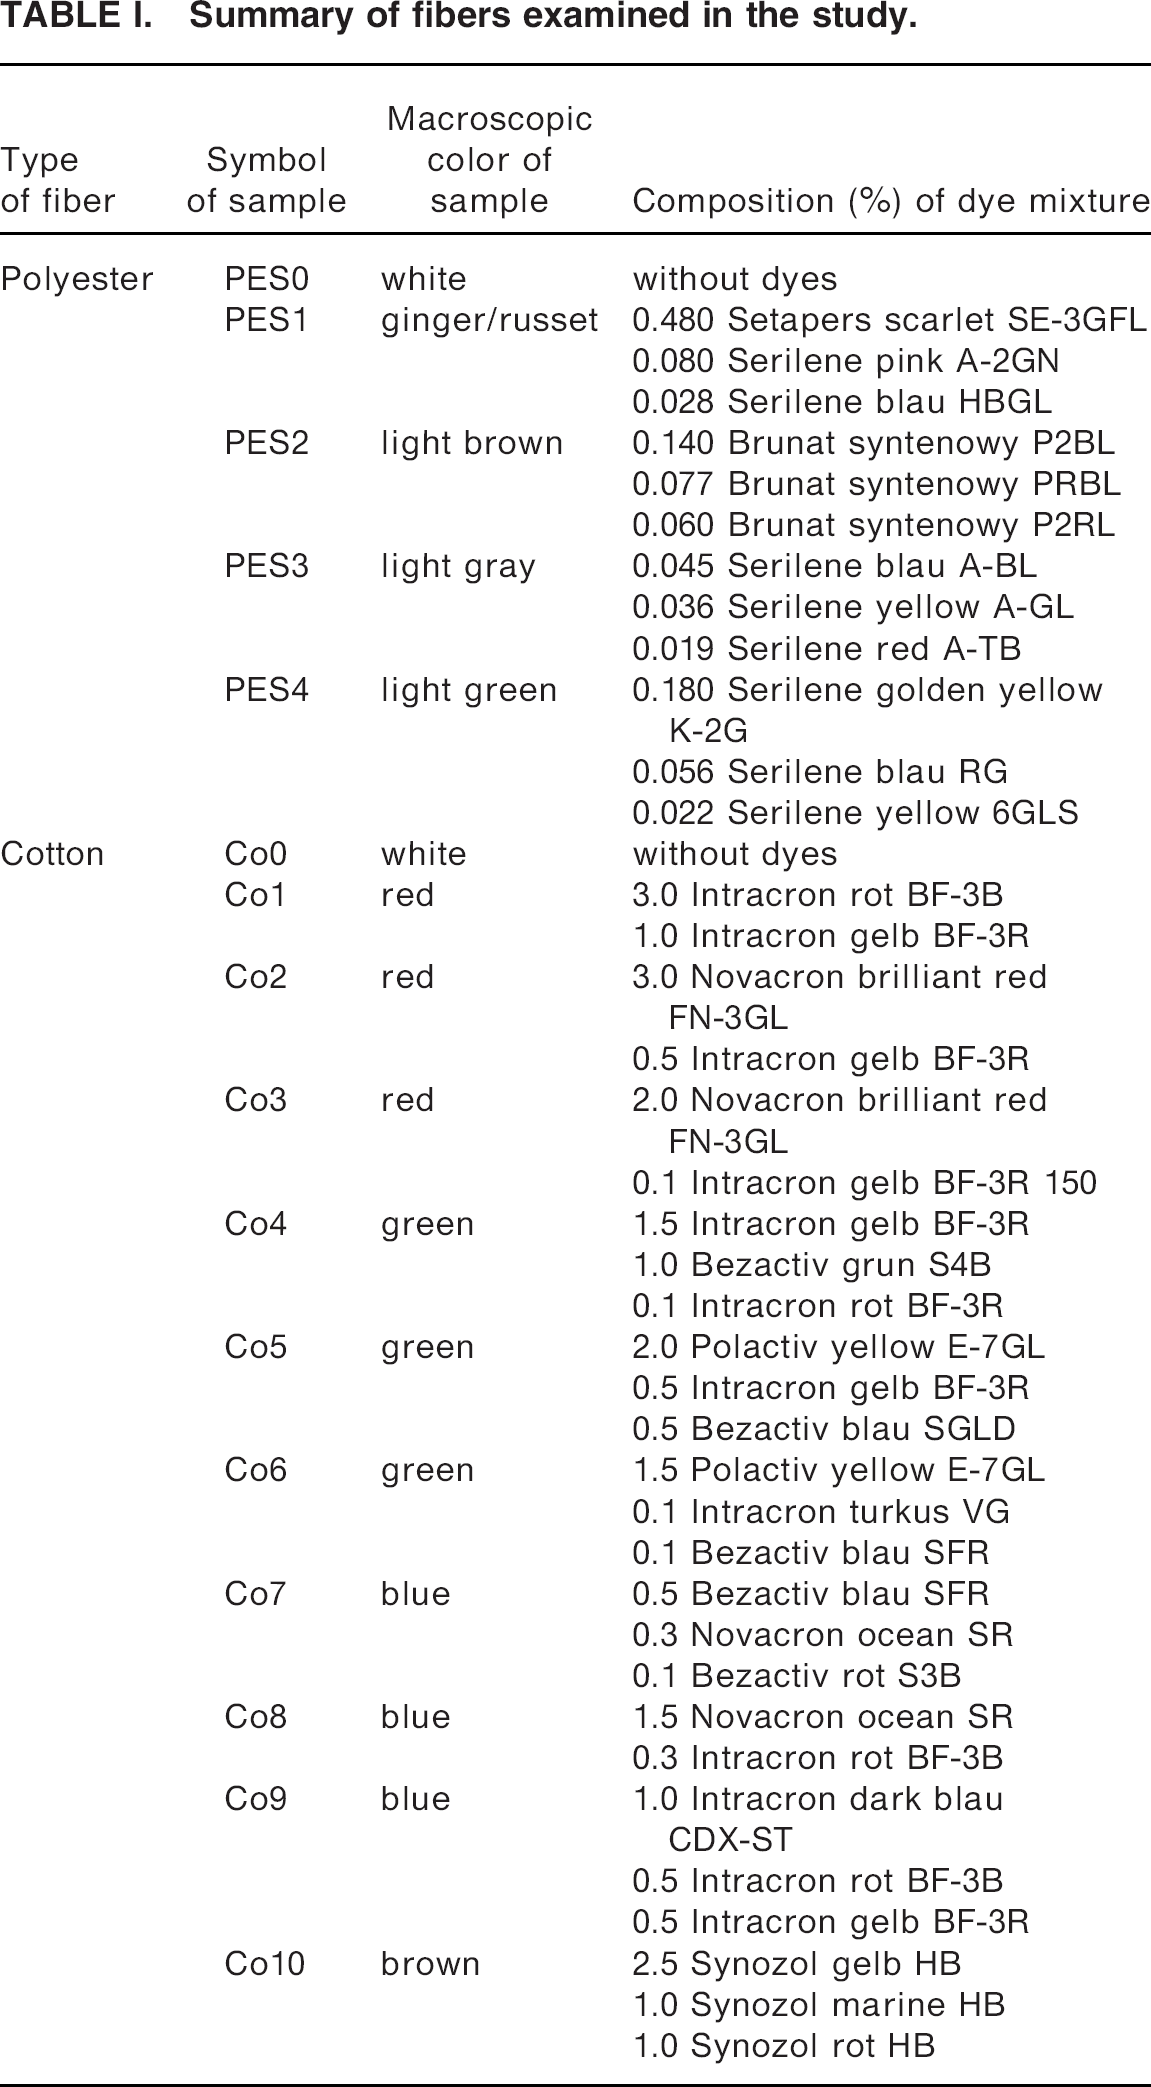
Summary of fibers examined in the study.
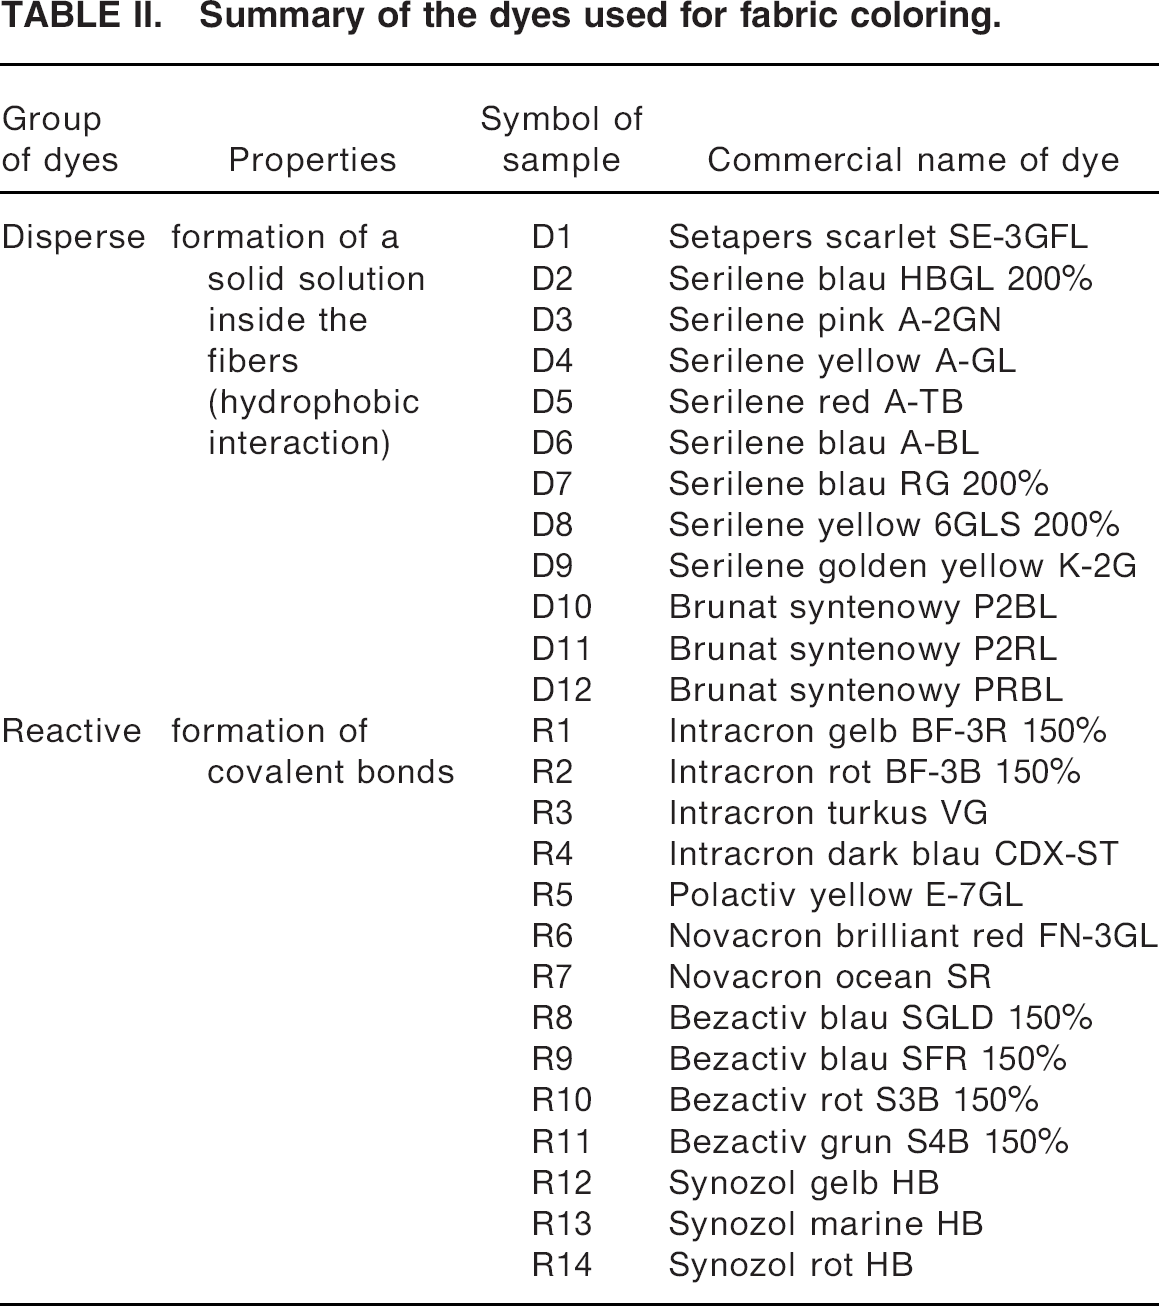
Summary of the dyes used for fabric coloring.
METHODS
The study of fibers and dyes presented here was carried out using two spectroscopic techniques: Raman spectroscopy and microspectrophotometry in the visible and ultraviolet range (UV–Vis MSP). All of the fabrics were dyed in their entirety; however, measurements were performed separately for fibers extracted at random from the weft and warp of each fabric.
The spectra were recorded in the ultraviolet and visible range, between 200 and 800 nm. Measuring conditions were aperture size, 6.0 × 6.0 μm; scans to average, 25; resolution value, 1 nm.
The examined fibers were mounted between quartz microscope slides and cover slips, using glycerine (Sigma-Aldrich Chemie GmbH, Germany) as a mounting medium. Reference data were taken exclusively from an area immediately adjacent to the mounted fiber; this was directly followed by measurements of the fiber sample.
A solution of an individual dye was prepared by dissolving a solid dye in deionized water, recording its UV–Vis spectra immediately after preparation, and putting a small amount of this solution between quartz microscope slides and cover slips.
The bleaching of fiber in UV light was minimized by using very fast scanning and by closing off the path of the light source immediately after a single measurement.
From at least 10 spectra measured for single fiber, a mean spectrum was calculated. Finally, the average spectrum of all 50 measurements representing a particular fabric sample was calculated. The mean spectra of solutions were calculated from 10 measurements, where a clean quartz microscope slide constituted the reference data. Mean spectra were calculated and compared using CRAIC MSP Data Acquisition Software, and smoothing was performed on some of the spectra, applying a third order Savitzky–Golay filter.
RESULTS AND DISCUSSION
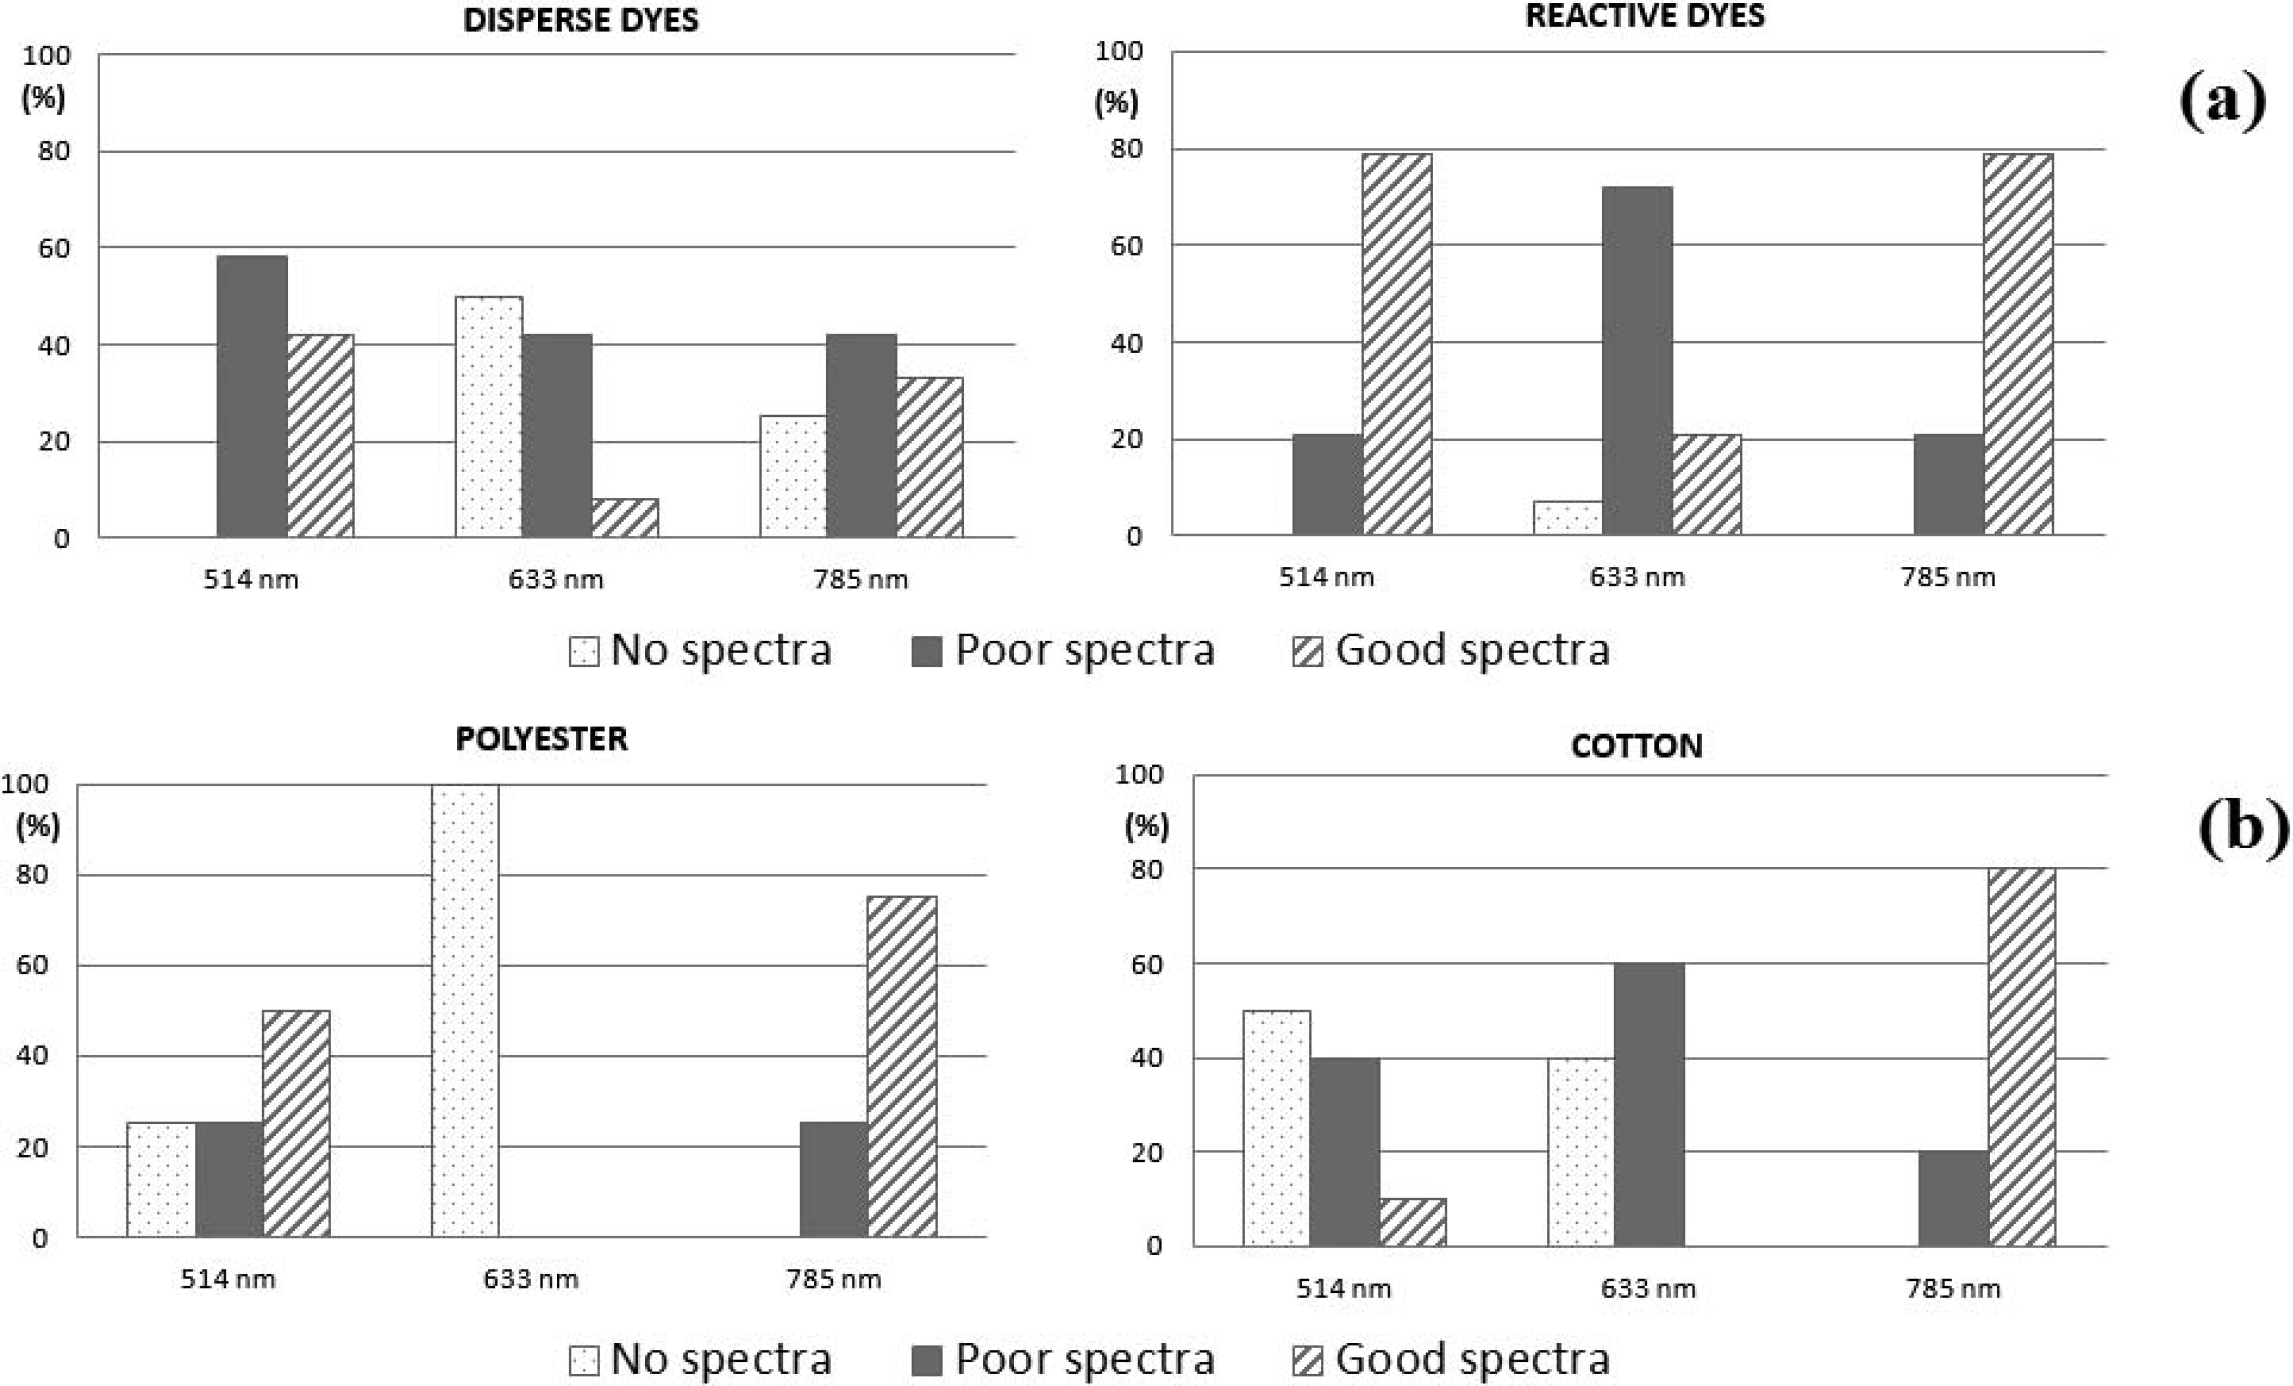
No spectrum—when the spectrum obtained was inadequate for interpretation due to the appearance of fluorescence.
Poor spectrum—when there are a few low-intensity Raman bands visible in the spectrum obtained.
Good spectrum–when there are intense, well-defined Raman bands visible in the spectrum obtained (Fig. 1a).
Assessment of quality of Raman spectra obtained for (
Analyzing the results (Fig. 1a), we observed that the He-Ne laser (λ = 633 nm) turned out to be the least effective in measurements of the Raman spectra from disperse dyes (no spectrum for 50% of samples). Application of a 785 nm line of excitation allowed for an increase in the amount of interpretable Raman spectra to 75%. Using a 514 nm wavelength laser for measurements made it possible to obtain the Raman spectra of all of the disperse dyes examined, in which 42% of these were good quality.
Obtained results led to the conclusion that none of the lasers used is ideal for the study of disperse dyes. However, it should be noted that the He-Ne laser (λ = 633 nm) turned out to be the least effective or efficient.
The majority of the disperse dye samples was differentiated using Raman spectroscopy. The only exception was with the dyes D10 and D11, in which case the spectra obtained using 633 and 785 nm lines of excitation were characterized by a very similar waveform, but using an Ar laser (λ = 514 nm) allowed for differentiating between them. Significant conformity in terms of the number and shape of Raman bands was also obtained for samples D10 and D12, which is a result of these substances' similar chemical structures because both dyes constituted a mixture: Disperse Red 54, Disperse Orange 30, and Disperse Blue 79:1.
Results obtained for polyester fibers led to the conclusion that mainly 514 nm or 785 nm lasers should be used in Raman studies of those types of fibers.
Comparing the spectra of colored polyester fibers with the spectrum of an uncolored fiber and the spectra of dyes used for coloring a given fabric, we assessed whether identification of every component of a dye mixture is possible. In Fig. 2, example Raman spectra that were obtained using a 785 nm laser are shown, for standard polyester fiber (PES0), red-colored polyester fiber (PES1), and dyes D1, D2, and D3. Analysis of the obtained results indicated that bands that come from the fiber-forming polymer (PET) are dominant in the spectrum of dyed fiber. Additionally, low-intensity bands coming from the dye D1, the main component of the dye mixture, were observed; however, the presence of bands characteristic for the remaining two dyes, D2 and D3, was not confirmed. This may be a result of too low a concentration of these substances in the dyed fiber. In the case of analogous measurements of samples using 514 and 633 nm lines of excitation, no spectra were obtained that were adequate for interpretation (fluorescence).
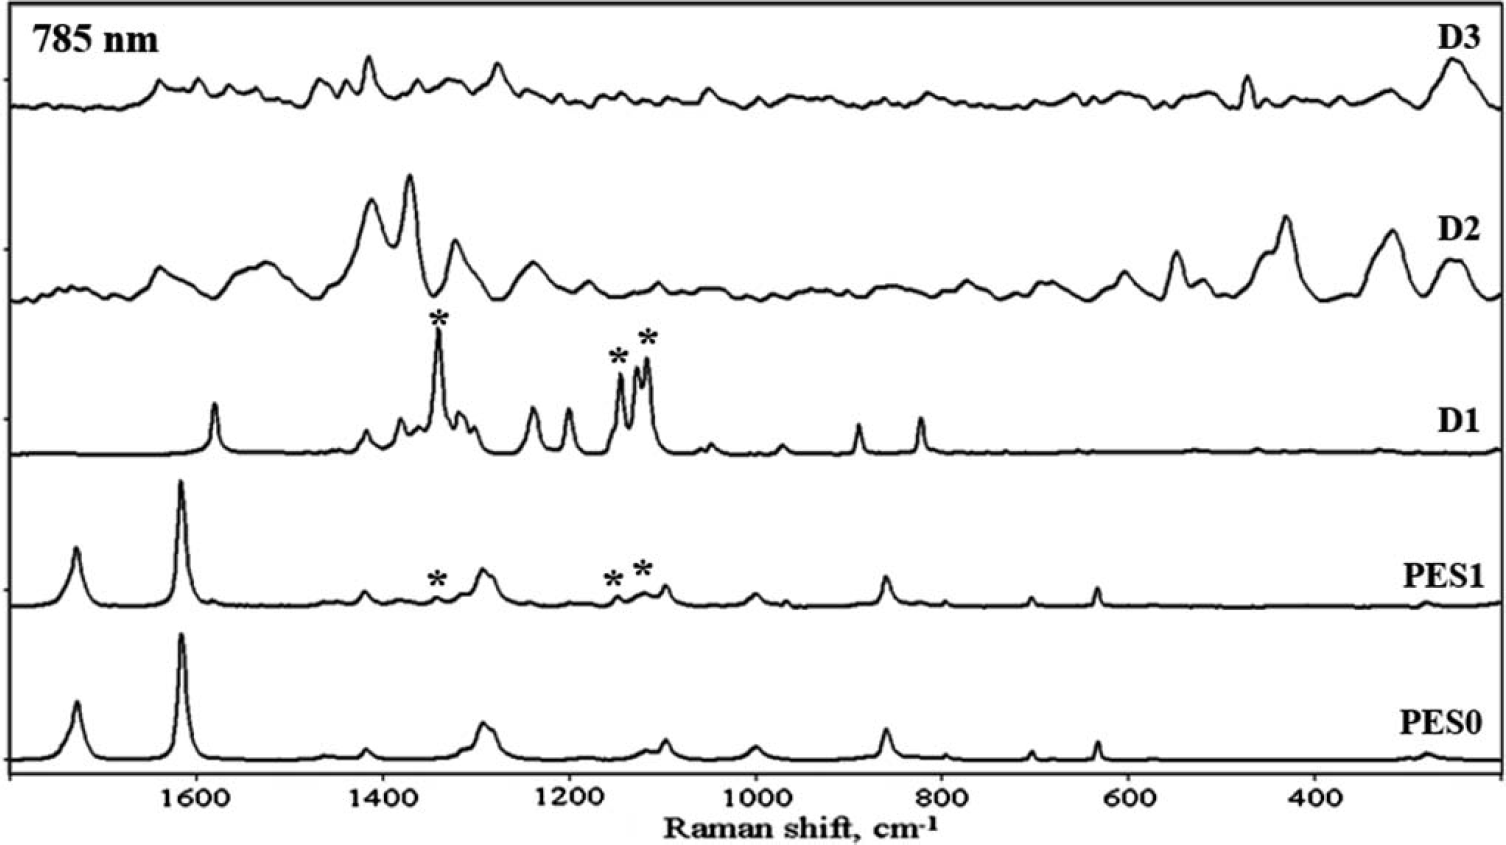
Juxtaposition of Raman spectra from polyester fibers and disperse dyes, obtained using a 785 nm wavelength laser; uncolored polyester fiber (
Recapitulating the results obtained for dyed polyester fibers, using all accessible lines of excitation, we determined that
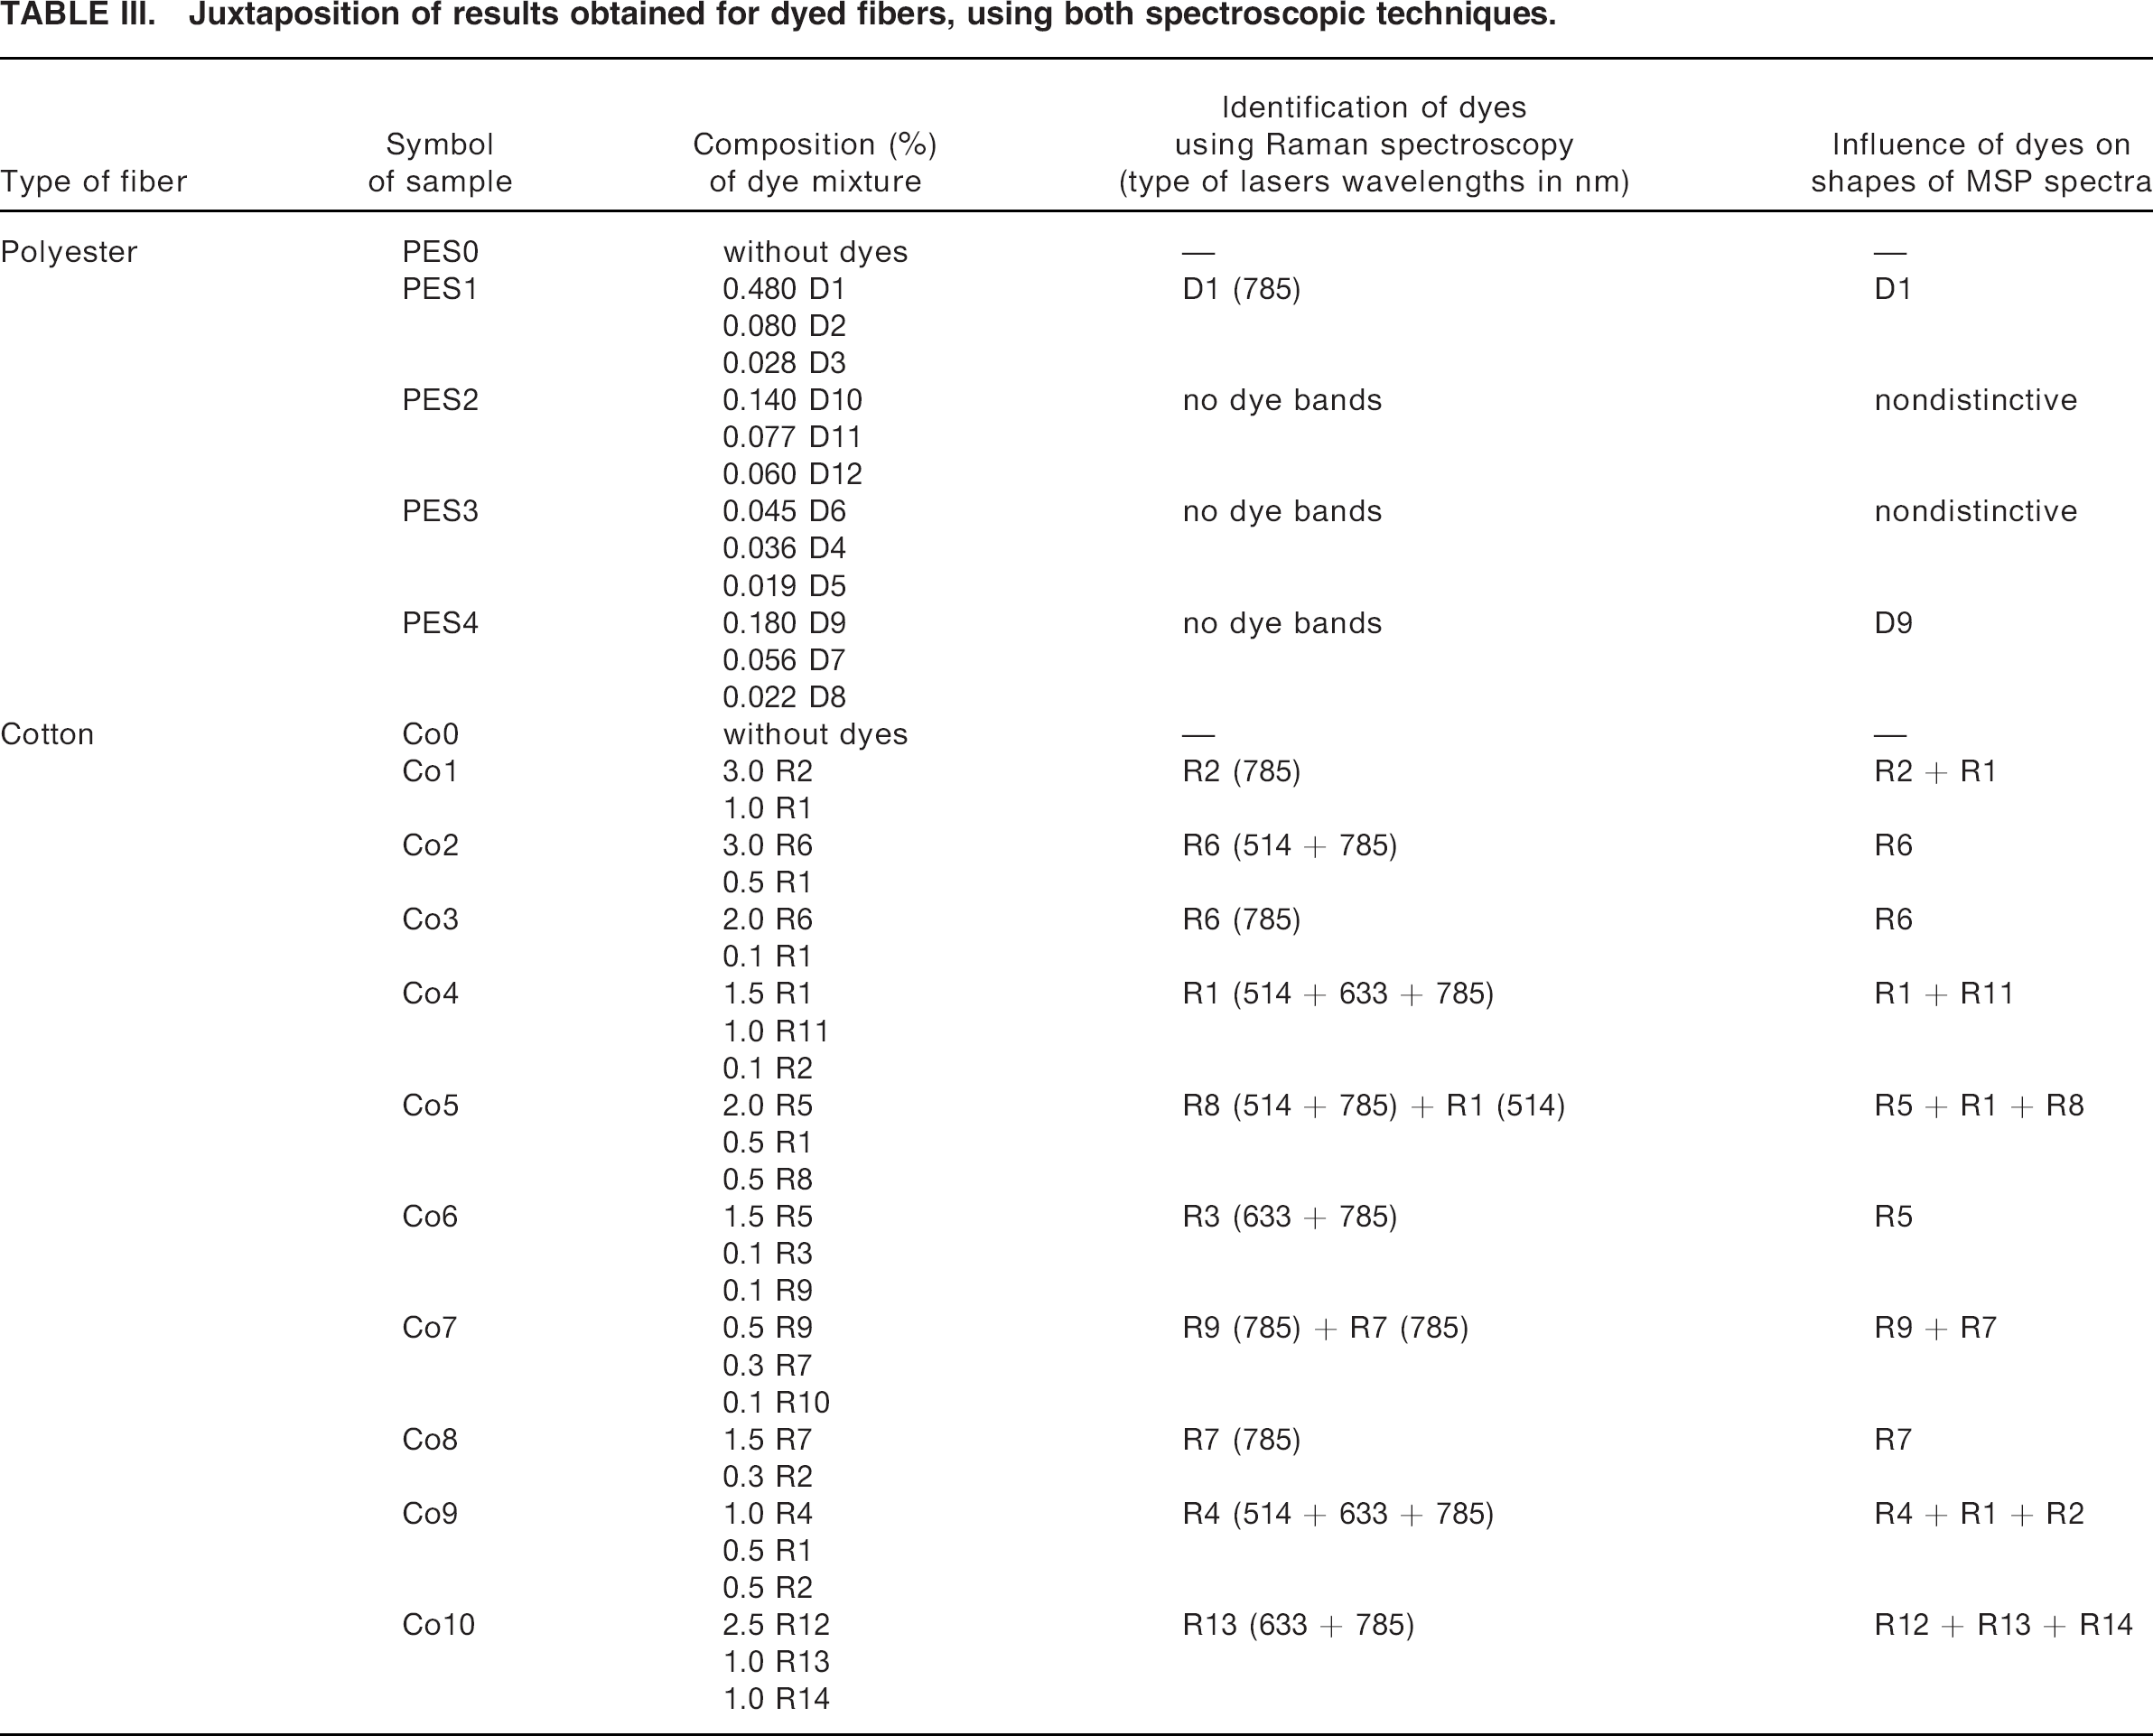
Fiber-forming polymer was identified in about 60% of cases, in examinations of dyed polyester fibers. Two or three components of dye mixtures were not detected in any colored polyester fiber sample. The lowest mass concentration of a detected dye was 0.48% (Table III).
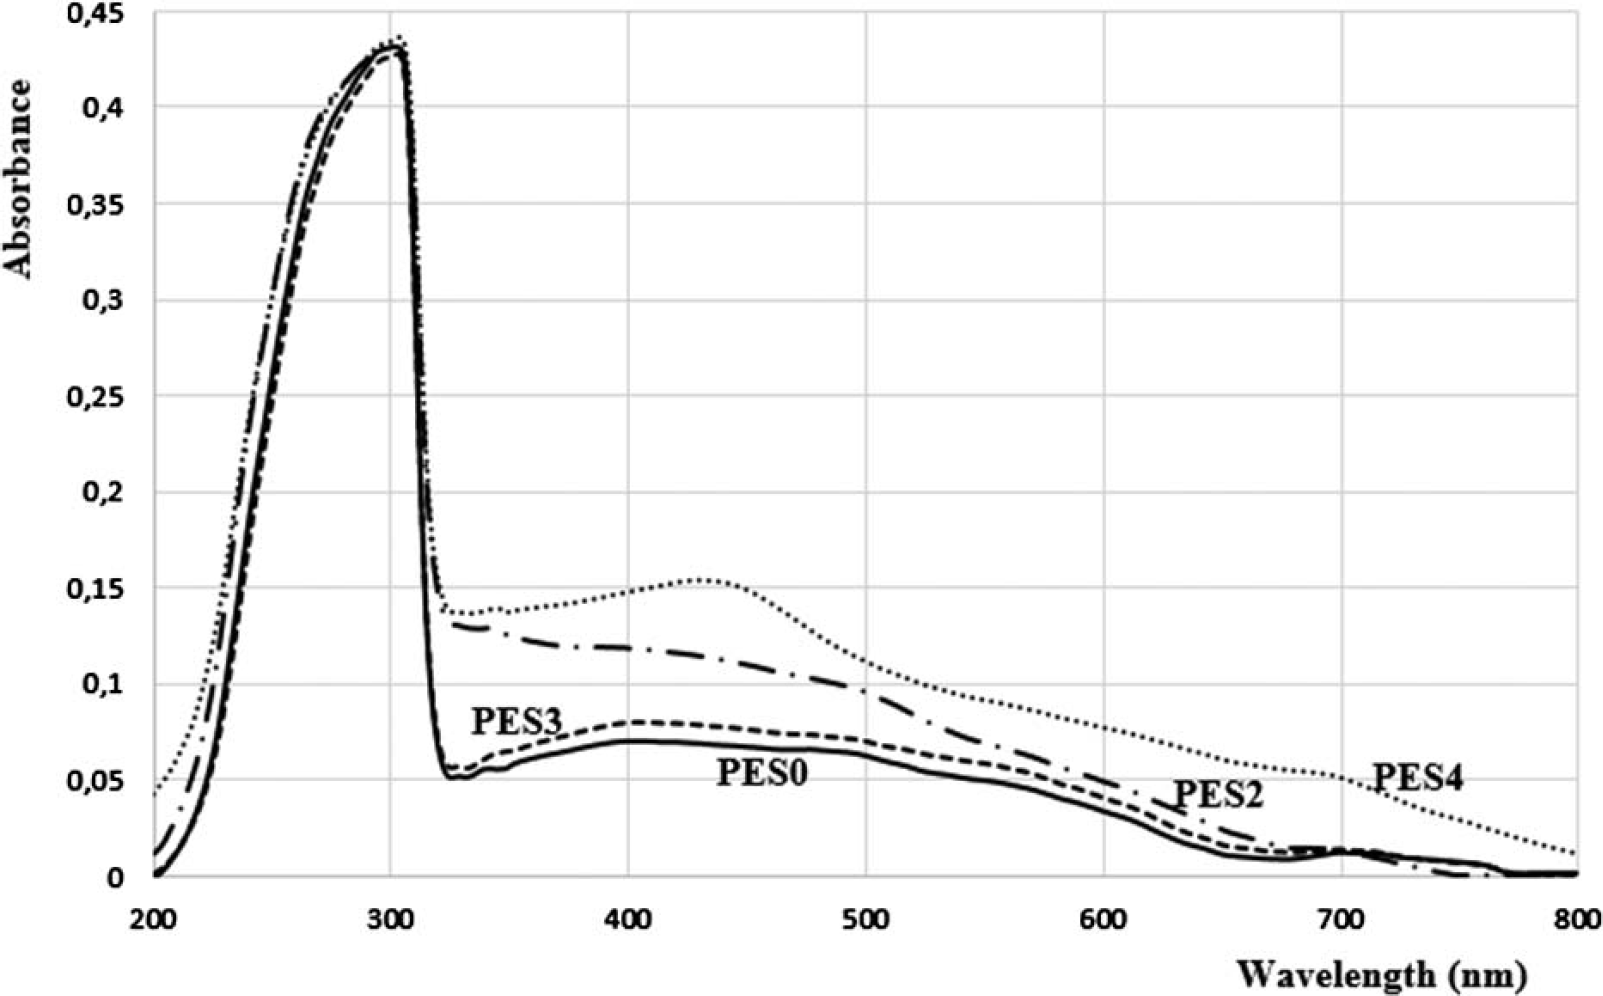
UV–Vis absorbance spectra of polyester fibers: uncolored (PESO), light brown (PES2), light gray (PES3), and light green (PES 4).
To assess the possibility of distinguishing the slightly dyed polyester fibers (PES2, PES3, PES4), a comparison of their spectra with the spectra of uncolored fibers was made (Fig. 3). There were no significant differences in the course of the spectra in the visible region obtained for the uncolored fiber, fiber of light gray color (concentration of main dye 0.045%), and fiber of light brown color (main dye concentration 0.140%). The lack of clear minima, maxima, or inflection points was probably because the concentration of disperse dyes used in dyeing process was too low. Only in the spectrum of fiber PES4 was the characteristic band for the main dye in the mixture (D9) observed (concentration in the dyeing bath was 0.18%).
Analyzing the spectra obtained for dyed cotton fibers, and comparing them with the spectra of uncolored fiber and those of reactive dyes, we determined that
No bands that come exclusively from fiber-forming polymer were observed in any of the Raman spectra of the dyed cotton fibers that were examined.
In the case of all fibers colored with a binary dye mixture, only one dye was detected, which was the main component of the mixture, and this pertained to 56% of these samples.
In the case of fibers colored with ternary dye mixtures, three components were not detected in any colored cotton fiber sample. In 61% of fiber samples, only one component was identified; in 11% of colored fiber samples, two dye mixture components were identified, while in half of these cases the dyes identified were not the ones of the highest concentration (Fig. 4).
The lowest mass concentration of a dye detected in a dye bath used for coloring a given textile was 0.1 %.
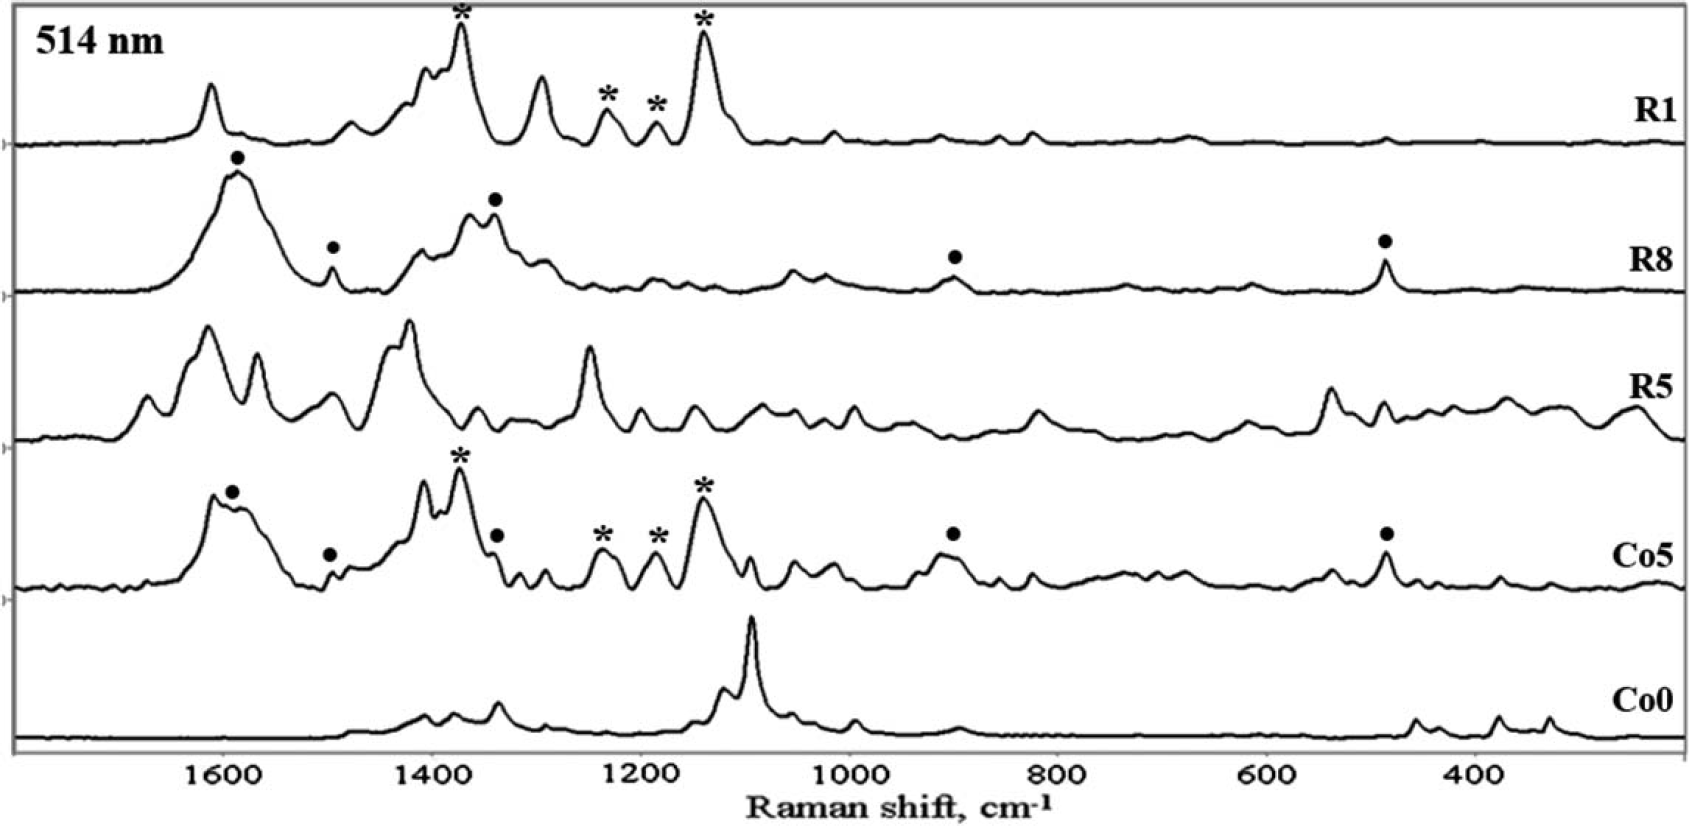
Juxtaposition of Raman spectra from cotton fibers and reactive dyes, obtained using a 514 nm wavelength laser; standard cotton fiber (
Spectra of cotton fibers dyed with binary or ternary mixtures were compared with spectra of pure dyes that are components of these mixtures.
Figures 5 and 6 present two extreme examples. In the first case, the spectrum of the fiber dyed using a ternary mixture proved to be an intermediate form of overlapping spectra of pure dyes used in the dyeing process. A different situation is illustrated in the second case as there were no significant differences in the course of the spectral curve for fiber dyed using a binary mixture and for pure dye, which was the main component in the dyeing process.
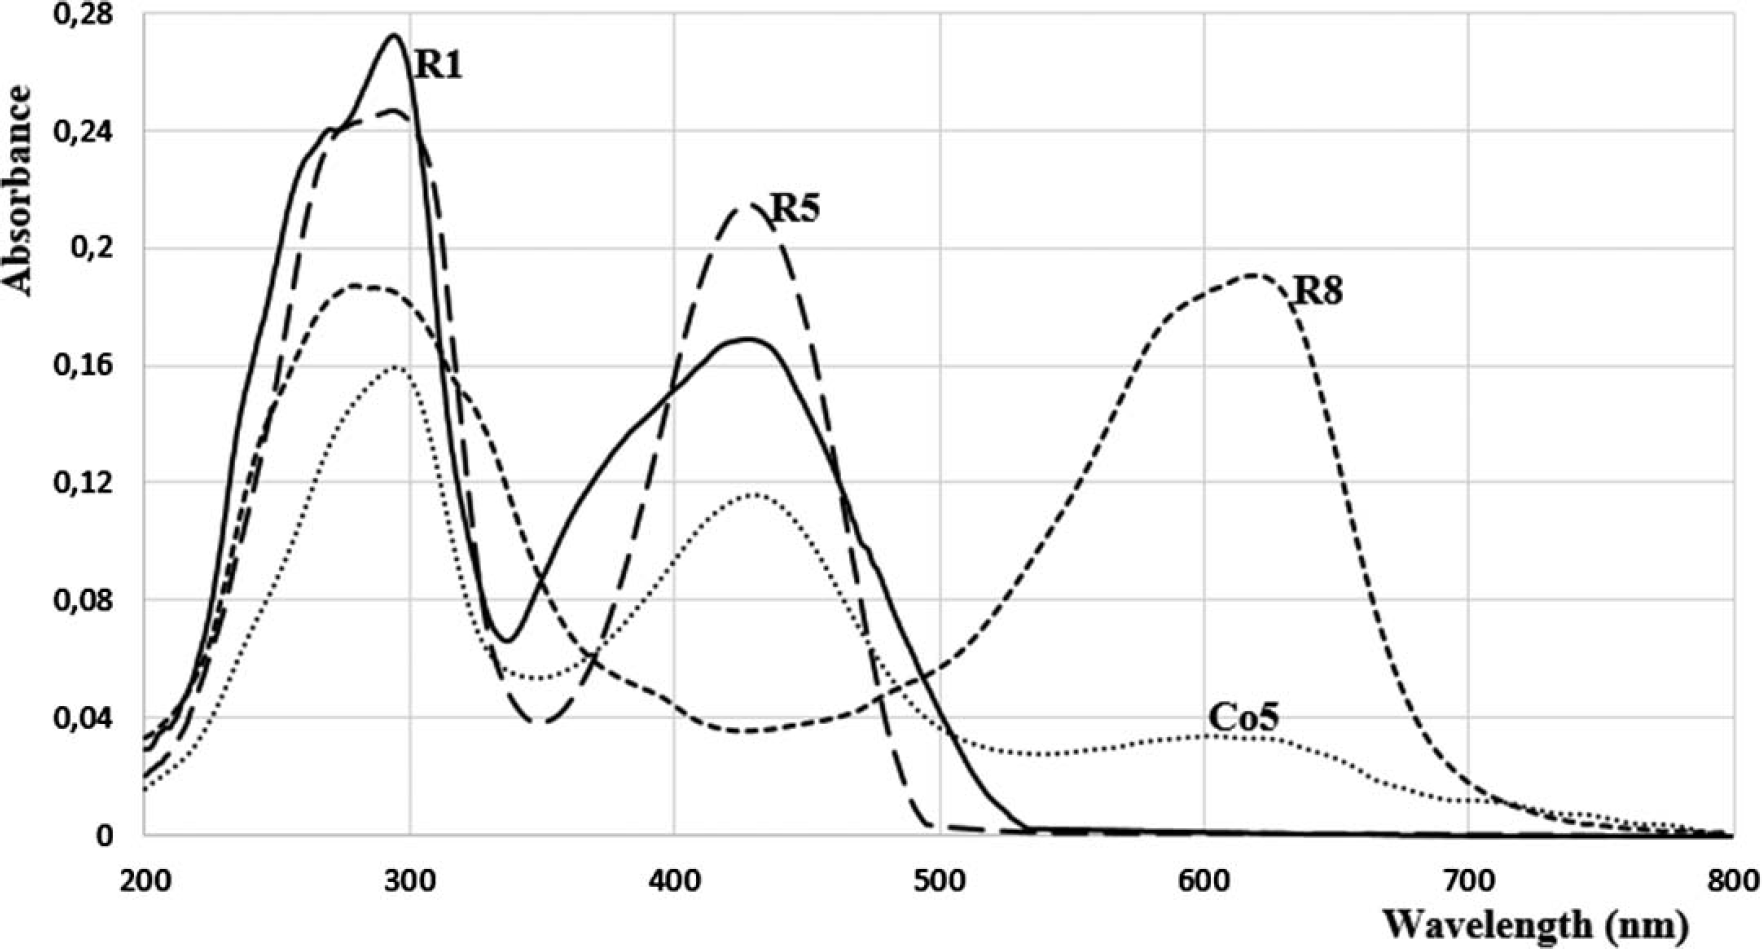
The comparison of UV–Vis absorbance spectra of dyes R1, R5, and R8, and cotton fiber dyed with a mixture of those dyes (Co5), where ratio of the concentration of the main dye (R5) to minor dye (R1, R8) was 4.
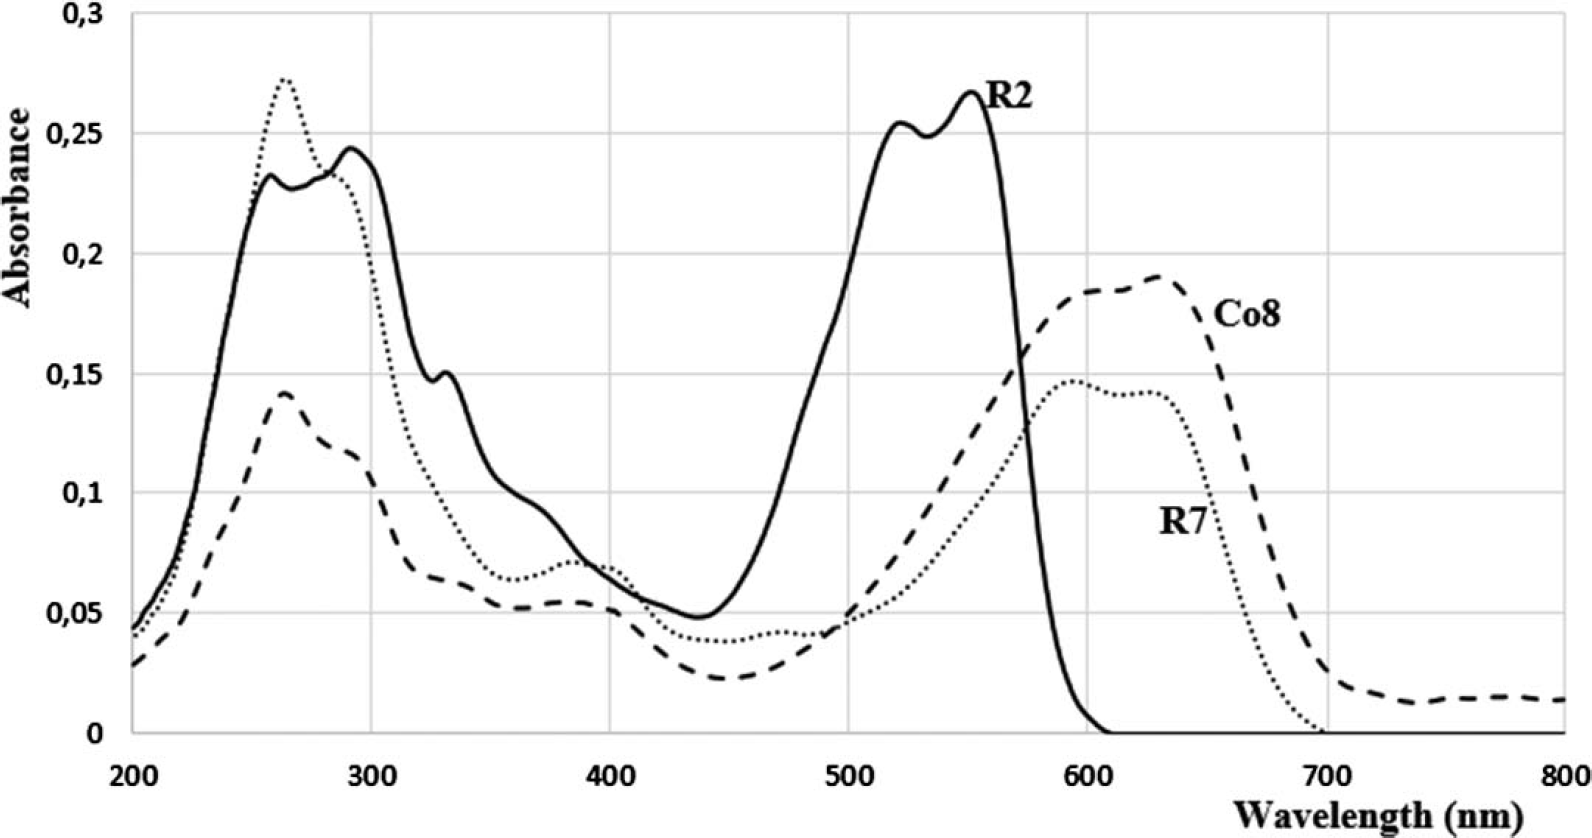
The comparison of UV–Vis absorbance spectra of dyes R2, R7, and cotton fiber dyed with a mixture of those dyes (Co8), where ratio of the concentration of the main dye (R7) to minor dye (R2) was 5.
The differences in the course of the spectra obtained for the pure dyes and fibers dyed using the dye mixtures were only visible when the ratio of the concentration of the main dye used in the dyeing process to minor dye was four or less (Table III).
Juxtaposition of results obtained for dyed fibers, using both spectroscopic techniques.
At the same time, in the case of cotton fibers, significant variations of UV–Vis spectra were observed, both within an individual fiber (intra-sample variation) and for the single fibers taken from different areas of the knitted fabrics (inter-sample variation), most likely caused by nonuniform deposition of the dye in the fiber during the dyeing process.
CONCLUSIONS
The conducted studies evinced the difficulty of identifying lightly colored polyester and cotton fibers through Raman microspectroscopy, which can be effectively applied for the identification of fiber-forming polymers in these cases. A second or third component of the disperse dye mixtures used to color polyester fabrics was not detected at all in the Raman spectra of polyester fibers, and the detection level of dye concentration in the dye bath amounted to 0.18%.
In the Raman spectra obtained for cotton fibers that came from fabrics dyed with mixtures of reactive dyes, only one of the coloring components was most often identified, and in about three-quarters of cases this was the dye of the highest concentration. Identification of all dyes used in the dye mixtures was not successful in any of the Raman spectra obtained for cotton fibers.
The best results, in terms of the quality of Raman spectra from polyester and cotton fibers, were obtained using an excitation source from a near infrared range (λ = 785 nm).
Results of the study of polyester fibers carried out using UV–Vis microspectrophotometry indicated strong absorption of ultraviolet light by the fiber-forming polymer. Those results led to the conclusion that this type of testing should first be carried out in the range of visible light and ultraviolet A radiation (above 310 nm). The UV–Vis MSP method also showed limited possibilities for discriminatory analysis of slightly dyed polyester fibers dyed with a mixture of disperse dyes.
The results for cotton fibers indicated a relatively large variation of UV–Vis spectra both in a single colored cotton fiber and for the single fibers taken from different areas of the knitted fabrics caused by structure of cotton fiber and nonuniform deposition of the dye in fibers during the dyeing process. MSP UV–Vis showed limited possibilities for discriminatory analysis of cotton fibers dyed with a mixture of reactive dyes, where the ratio of the concentration of the main dye used in the dyeing process to minor dye was higher than four.
These results have practical applications, inter alia, in forensic research in the course of the identification and comparison of fragments of single fibers that are trace evidence.
Footnotes
ACKNOWLEDGMENTS
The authors are very grateful Dr. Waldemar Machnowski from the Faculty of Material Technologies and Textile Design of Lodz University of Technology for selection and preparation of the reference fabric samples. This study was carried out thanks to collaboration between the Institute of Forensic Research and the Jagiellonian University, and it would not have been possible without the personal involvement of Prof. Pawel Koscielniak, the Head of Department of Analytical Chemistry at the Faculty of Chemistry. Raman spectra were prepared by Joanna Wojton, a student of the Jagiellonian University's Chemistry Department, in the course of compiling her master's thesis. The part of the research was financially supported by the Polish National Centre for Research and Development, Project Number O N204 115036.