






Abstract
Paperboard is widely used in different applications, such as packaging and graphic printing, among others. Consumption of recycled paper is growing, which has led the paper-mill packaging industry to apply strict quality controls. This means that it is very important to develop methods to test the quality of recycled products. In this article, we focus on determining the recovered-fiber content of paperboard samples by applying Fourier transform mid-infrared (FT-MIR) spectroscopy in combination with multivariate statistical methods. To this end, two very fast, nondestructive approaches were applied: classification and quantification. The first approach is based on classifying unknown paperboard samples into two groups: high and low recovered-fiber content. Conversely, under the quantification approach, the content of recovered fiber in the incoming paperboard samples is determined. The experimental results presented in this article show that the classification approach, which classifies unknown incoming paperboard samples, is highly accurate and that the quantification approach has a root mean square error of prediction of about 4.1.
Keywords
INTRODUCTION
The use of recovered paper products has expanded considerably over the last decades 1 , mainly because of its environmental, economic, and social benefits. 2 According to the European Recovered Paper Council 3 , Europe reached a recycling rate of 71.7% in 2012. Paperboard is the most recycled packaging in Europe, exceeding the recycling rate of steel, glass, and aluminum. Because of the economic crisis, paper consumption in Europe has been reduced by 13% since 2007, but the recovery of paper products has dropped by only 3.5%. It is essential to ensure the quality of the recycled material to guarantee the sustainability of the recycling process. 2
According to the U.S. Environmental Protection Agency 4 , paper-fiber types are usually defined as either recovered or virgin. Virgin fibers are defined as cellulosic elements obtained directly from trees (hardwoods and softwoods) and other plants. It is worth noting that virgin fibers are newly pulped, so they have never been previously used. In contrast, recovered fibers are defined as post-consumer fibers derived from diverse origins, including paper, paperboard, and other fibrous materials that have been collected mainly from manufacturing processes or municipal solid waste. Recovered fibers can also include preconsumer material such as waste material recovered from a manufacturing process.
The use of recovered fiber has several environmental benefits. It reduces the demand for virgin fiber, thus putting less pressure on the forests. This also saves energy, reducing greenhouse gas emissions and extending the available fiber supply. Recycling also minimizes landfill disposal of a valuable resource, reducing the amount of waste and rejected materials.
Paperboard is used to meet different needs. Depending on the final application, paperboard requires specific properties, including brightness, smoothness, or strength, that can be achieved by using suitable blends of both virgin and recovered fibers. However, the use of recovered fibers in paperboard formulations for packaging materials that will be in contact with foodstuffs is of special concern. 1 This is because some of the chemical components in the recovered materials are harmful to human health and can migrate from the packaging into the food.
Some processing is required to obtain usable fibers from recovered fibrous materials; the extent of the processing and the amount of energy required depend on the requirements of the final product. The use of too high an amount of recovered fiber can reduce the environmental returns beyond the threshold percentage. This means that the final manufactured product determines the maximum amount of recovered fiber that can be used in its formulation.
Manual and automatic paper-sorting systems are commonly used in many countries to recover usable fibers from the waste stream. 5 Sorting methods seek to recover raw material of the highest purity from the waste stream because in this way the addition of chemicals and the energy requirements are minimized while the manufacture of high-quality products is facilitated. 6 However, manual sorting often faces several drawbacks, including unpredictable end-product quality, relatively high costs (especially in developed countries), and exposure to dust, microorganisms, or other pathogenic agents that may cause infections in workers. 7 Therefore, automated paper-sorting systems have acquired importance in the paper industry and are constantly subject to technological improvements.
There is a growing interest in developing automatic sorting systems. For example, a sorting system based on near-infrared spectral imaging has been described for the classification of different paper types (e.g., raw and colored cardboard, newspaper, and printer paper). 8 Rahman et al. 5 described a paper-sorting technique based on image processing combined with statistical reasoning and machine-learning systems for identifying different paper grades. A review of sorting methods in the paper industry can be found in Rahman et al. 6
However, available sorting systems either do not provide information about the composition of the analyzed samples or have not been applied to determine the recovered-fiber content of paper samples. This article makes a contribution in this area in that, as far as we know, it is the first attempt to determine automatically the recovered-fiber content of paperboard samples.
Various methods of analysis are available for identifying paper products containing recovered fiber in their formulations. For example, Holik 9 described a system to determine the amount of damaged fibers in a sample. Other methods are based on the analysis of chemicals and products that remain in recovered paper fiber that identify the content as being different from virgin fiber. 10 However, these methods are time consuming, requiring sample preparation.
In this article, we determine the recovered-fiber content of different paper samples by analyzing the spectral data provided by a mid-infrared (mid-IR) spectrometer. Mid-infrared spectroscopy has been applied to the analysis of pulp composition and paper structure,1,11 and it is known to be very fast and nondestructive. 12 We further process the Fourier transform mid-infrared (FT-MIR) spectrum of a given sample by applying multivariate feature extraction algorithms combined with classification and statistical regression methods. Unlike other approaches, the FT-MIR spectrum provides information about the composition of paper-board samples instead of their external physical appearance.
To determine the content of the recovered fiber in a given paperboard sample, we apply two approaches. In the first, classification-based approach, we classify paperboard samples into two groups, low and high recovered-fiber content, according to their composition by applying two feature reduction methods, principal component analysis (PCA), and canonical variate analysis (CVA), along with the k-nearest neighbor (KNN) classifier. In the second, quantification-based approach, we determine the content of recovered fiber by applying multivariate regression, in this case the partial least squares (PLS) algorithm.
The proposed system for determining the recovered-fiber content of an unknown sample has several appealing features, including a very fast response, application in situ, and not requiring the use of chemicals and reagents, thus minimizing costs because a chemical laboratory and a specialized technician are not needed. Note that recovered-paperboard samples are particularly diverse. Due to the wide range of compositions (i.e., the heterogeneity of the samples), this is a highly complex problem.
The quantification system proposed here, which is fast and easy to use, may be highly valuable for paperboard manufacturers because they need to check the quality of their incoming stock. It may also be useful in the packaging industries, and especially for food packagers, because they need to implement very strict quality controls to ensure that the content of the recovered fiber is below a certain threshold value to avoid health-related problems caused by chemicals migrating into foodstuffs.
MATERIALS AND METHODS
The Analyzed Samples. The recycled samples dealt with in this study were mixtures containing different proportions of raw pine mechanical pulp (virgin material) and pulp obtained from recycled newspapers, magazines (new samples returned to the printers), and gray paper scraps in a proportion of approximately 50:25:25. The pulp samples were taken directly from the high-density helical pulper (Licar-Lamort). Next, we performed appropriate dilutions and mixtures in the laboratory to obtain the different sample compositions, which afterward were dried in a stove. By modifying the proportion of mechanical pulp depending on the desired quality, we obtained material that could be used directly to manufacture the intermediate layer of paperboard, which was analyzed in this study. The final manufactured paperboard product may include two other layers (are not analyzed in this study), composed of white recovered fibers (top side) and recovered paperboard (back side). When it contains these two layers, the final product is designed as fully coated white-lined chipboard with gray back, and it is mainly used for packaging food, textiles, beverages, and detergents and cleaning products, among others.
We prepared the analyzed samples during two different time periods, therefore increasing the heterogeneity of the overall sample set because the incoming stock was from different origins and of different compositions. All the samples were prepared in the facilities of Reno De Medici Iberica.
We made a total amount of 31 paperboard samples following this manufacturing procedure. As explained, because the analyzed samples were made of recovered fiber with different proportions, this group of samples was highly heterogeneous. Therefore, the automatic quantification of the recovered-fiber content was a highly challenging problem.
We split the whole set of 31 samples into a training set and a prediction set to evaluate the performance of the statistical models proposed in this article. 13 The samples in the prediction set were distinct from those in the training set. The samples in the training set were required to calibrate the statistical classification and quantification models; the samples in the prediction set (different from those used in the calibration stage) were used to predict the content of the recovered fiber. Table I lists the paperboard samples, their recovered-paper contents, and the set to which they were assigned.
Samples analyzed.
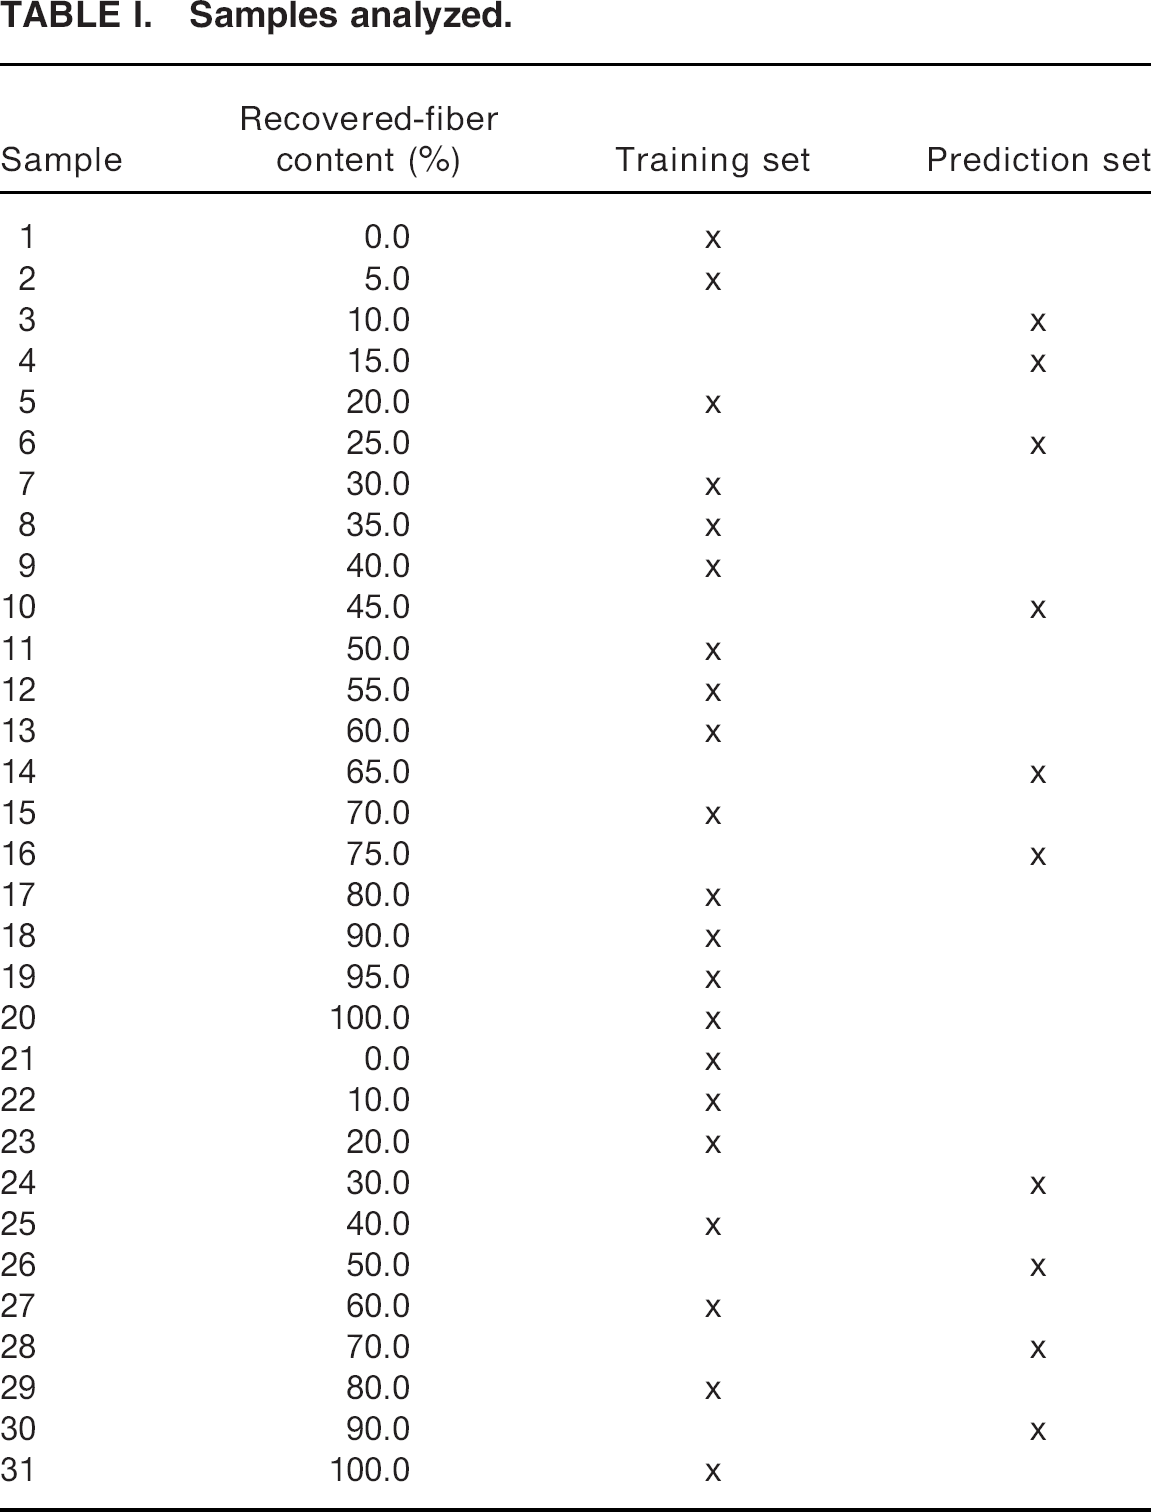
Figure 1 shows two of the 31 samples analyzed in this article. Because all of the analyzed samples were light gray in color (due to the light gray chemical pulp), they could not be screened by simple visual inspection; the only exceptions were those produced from 100% virgin fiber, which were yellowish in color (due to the presence of lignin, which is not removed during the manufacturing process of the mechanical pulp). The samples composed of physical mixtures of virgin mechanical pulp and recovered fiber were all light gray in color because this color always predominated over yellow.

Two specimens of the set of 31 samples studied. Specimen 1 (left) and specimen 20 (right).
The spectra of the raw paperboard samples were acquired at 25 ± 1 °C using an ATR cuvette over the wavenumber range 4000–650 cm−1 by averaging four scans, with a resolution of 1 cm−1. Three readings were done in different parts of each sample, which were averaged.
It is well known that, by analyzing the ATR spectrum of a particular material, different types of components such as organic, inorganic, and polymeric molecules can be identified. Analyzing the ATR spectrum of a paperboard sample shows that most of the spectral bands are due to the cellulose. 14 In this study, we acquired the ATR spectra of 31 paperboard samples (one per sample), transformed them to absorbance spectra, and further analyzed them by applying multivariate mathematical methods. The spectrum of each sample consists of 3351 data points (x, y), where x is the wavenumber and y is the absorbance. The large number of variables per sample combined with the inherent difficulty of the problem made it is very difficult to determine the recovered-fiber content of a given paperboard sample directly from the raw spectra data. Therefore, we needed to process this huge amount of spectral information using suitable multivariate statistical methods, which are described in the following sections. All the multivariate statistical methods used were programmed by the authors using Matlab.
Figure 2 shows the absorbance spectra of three paperboard samples with different contents of recovered fiber, in which it is possible to distinguish the characteristic bands of the cellulose (O-H, C–H, and C-O-C). Figure 2 also shows that the most marked differences among the three paperboard samples are found in the 1600–1500 cm−1 spectral band. The intensity of this spectral band can be associated with the presence of lignin in the samples (aromatic skeleton and C=O vibration modes). In the analyzed samples, the intensity of this band decreases significantly when the recovered-fiber content increases; therefore, the maximum intensity of this band for sample 1 is 0% recovered fiber, and the minimum for sample 20 is 100% recovered fiber. However, the differences among the samples with different recovered-fiber contents do not seem to be linear by simple visual inspection; thus, they need to be evaluated by means of suitable multivariate mathematical algorithms.

Absorbance spectra of specimens 1, 11, and 20.
Among the feature extraction algorithms, PCA is one that is most often applied15–17, although it is an unsupervised method. Principal component analysis combines the measured variables linearly, thus obtaining the latent variables or principal components (PCs), which are directed through orthogonal directions explaining the highest variance. The output of PCA is the same number of PCs as the original variables defined in the problem, although a reduced number of PCs are retained, those accounting for a sufficient portion of the total variance.
Supervised feature extraction methods are used to boost discrimination between classes. 18 Therefore, supervised feature extraction algorithms are preferred in classification problems. Unlike unsupervised methods, supervised methods use class labels to evaluate the performance of latent variables. The class labels of the training samples are selected by a human expert.
Among the supervised feature extraction algorithms, CVA is highlighted because it is a multiclass method specifically designed to strengthen the differences among classes. 19 Canonical variate analysis calculates nonorthogonal latent variables, called canonical variates (CVs). These latent variables are calculated by maximizing the differences among classes while minimizing sample dispersion within each class. Canonical variate analysis does not work with data sets in which the number of measured variables is greater than the number of samples. This is the case for the problem analyzed in this study: there are 3351 variables and 31 samples. Therefore, to avoid this limitation, we applied PCA before CVA to reduce the number of variables we had to deal with, as shown in Fig. 3.

Link between the PCA and CVA algorithms.
Figure 4 shows the mathematical methods applied in this study to determine the recovered-fiber content of the analyzed samples.

The two approaches applied to determine the recovered-fiber content of the analyzed samples.
RESULTS AND DISCUSSION
The results attained with the two analyzed approaches, classification and quantification, are presented in this section. All results are based on the analysis of the ATR spectra after suitable preprocessing, which included baseline correction, smoothing, transformation to absorbance spectra, and analysis of the first and second derivatives, with or without mean centering or unit variance scaling. All results shown in this section are based on the 31 paperboard samples, for which the recovered-fiber contents were known because they were expressly prepared for this study in the Reno De Medici Iberica facilities. We split these samples into two groups: the training set (21 samples) and the prediction set (10 samples). Therefore the prediction set contains approximately one-third of the total set of samples. The whole absorbance spectrum (4000–650 cm−1) for the 31 paper samples provided a data matrix with 31 rows and 3351 columns, from which a first-derivative matrix of 31 × 3341 components and a second-derivative matrix of 31 × 3331 components were obtained by applying the Savitzky–Golay algorithm; these are shown in Fig. 5. Prior to calculating the derivatives, we preprocessed the spectra by applying the baseline correction and smoothing operations. In addition, a prospective analysis showed that more accurate results for both the classification and quantification approaches could be obtained when dealing with the first derivative of the spectra with mean centering, so all results presented in this article are based on this preprocessing method.

First and second derivatives of the absorbance spectra of specimens 1, 11, and 20, obtained by applying the Savitzky–Golay algorithm.
The paper industry market often demands paper-board products with either a high or low recycled-fiber content, depending on the specific application of the final product. In these cases, a screening tool such as the one developed next, based on PCA + CVA, may be suitable. But when the quantification of the recovered-fiber content is required, that method is not suitable. We therefore apply the quantification approach based on the PLS algorithm. When applying this approach, it is mandatory to prepare a calibration set of paper-board samples (for which the recovered-fiber content of each sample is known accurately) containing the entire interval of recovered-fiber content. Therefore, this strategy requires a more complex and accurate preparation of the pattern samples with the whole interval of the concentrations to be dealt with.
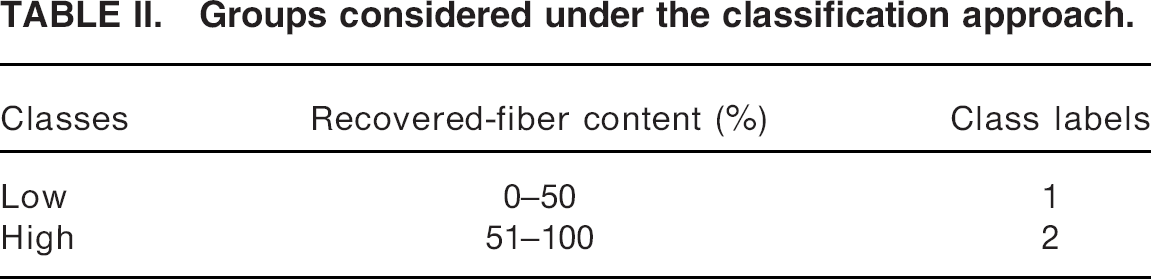
Under the classification approach, we split the paperboard samples into two groups—low and high recovered-fiber content—as shown in Table II. That is, this approach classifies incoming unknown paperboard samples into one of these two classes by applying the feature extraction methods PCA + CVA in combination with the KNN classifier.
Groups considered under the classification approach.
As previously explained, the PCA is applied before the CVA algorithm. Therefore, it is mandatory that the researcher select a reduced number of PCs arising from the PCA. Although there is no standard method for selecting the appropriate number of PCs, in this study, we retained those explaining at least the 97% of the overall variance. Figure 6 shows that this condition was achieved when we retained the first 10 PCs.

Cumulative variance as a function of the number of retained PCs in the training data set for the overall 4000–650 cm−1 spectral interval.
Afterward, we applied the CVA algorithm to the 10 retained PCs. Figure 7 shows the results of applying the CVA algorithm to this two-class problem. Note that the number of CVs provided by the CVA is the number of classes minus 1; that is, in a two-class problem, only one CV is calculated by the CVA algorithm. Figure 7 shows both the training and prediction sets plotted in the one-dimensional space defined by the one CV arising from the CVA algorithm. Note that to achieve good classification results it is highly desirable that the samples in classes 1 and 2 be as far apart as possible.

Training and prediction samples plotted in the space defined by the only CV arising from the PCA (with 10 PCs and mean centering) + CVA algorithms.
Finally, we applied the KNN (K = 3, 4, 5) classifier to the output data of PCA + CVA algorithms. The classification results attained using this method are summarized in Table III and show that in all cases (i.e., with a k of three, four, or five neighbors) all the samples were correctly classified according to their recovered-fiber content.
PCA + CVA with KNN results summary. a
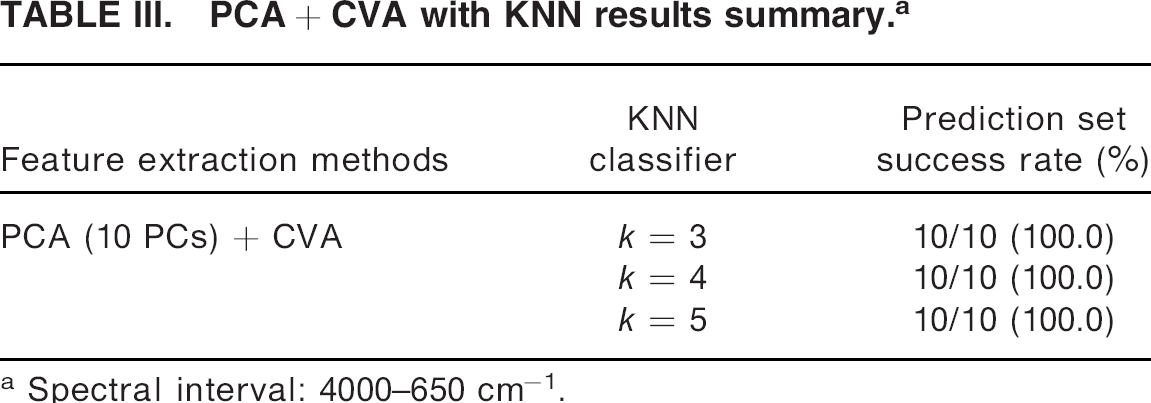
Spectral interval: 4000–650 cm−1
The quantification approach, the second approach to determine the recovered-fiber content of the analyzed paperboard samples, is based on the PLS regression algorithm. As in the case of the PCA algorithm, the researcher is required to select the appropriate number of latent variables to avoid overfitting the prediction model. To this end, we calculated the mean squared error of cross-validation (MSECV) of the calibration sample set as a function of the number of PLS components retained, which is shown in Fig. 8. The MSECV was calculated as:

Leave-one-out cross-validation MSECV of the training data as a function of the number of PLS components retained for the overall 4000–650 cm−1 spectral interval.
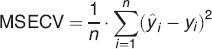
where ŷi and Yi are the PLS predictions of the ith sample and the reference value in per unit, respectively, and n is the number of samples evaluated. The Yi values are known a priori because the samples were prepared expressly for this study. After analyzing the values surrounding the minimum of the MSECV, we retained the first seven PLS components.
To evaluate the accuracy of the PLS result, we calculated the root mean square error of calibration (RMSEC) or root mean square error of prediction (RMSEP) as:
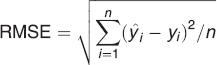
Table IV shows a summary of the results attained by applying this method.
Prediction data set PLS results with seven components.
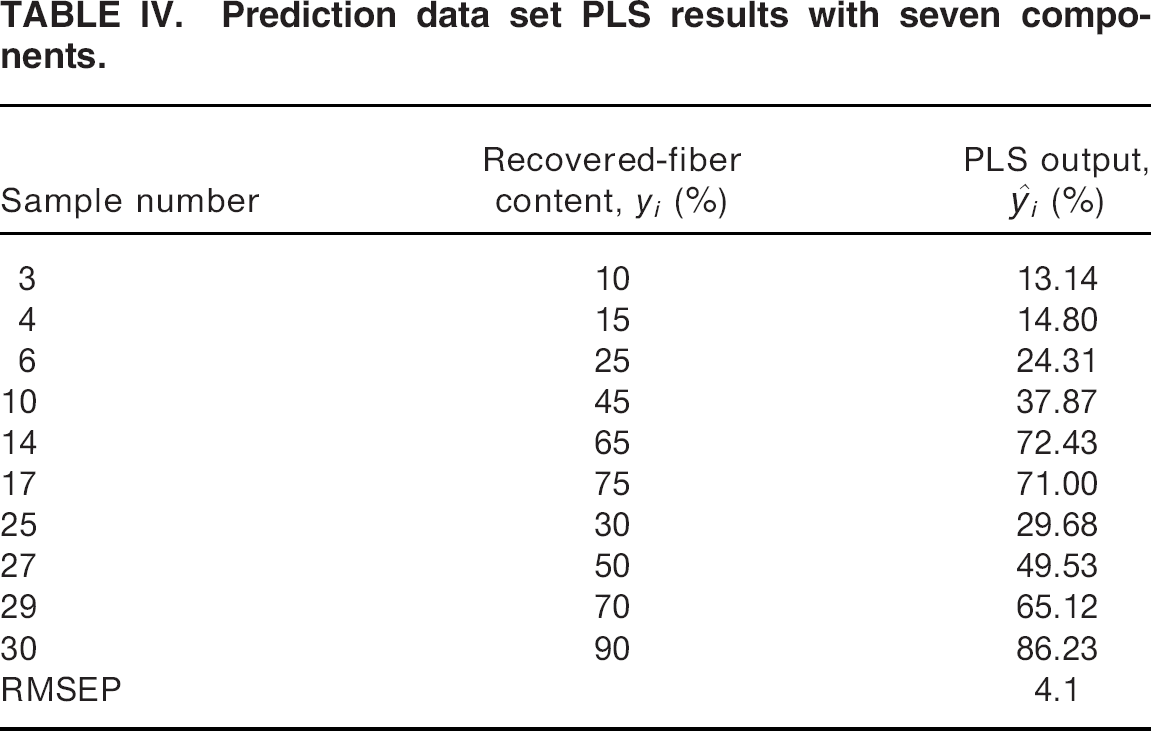
Figure 9 plots the recovered-fiber content predicted by the PLS model versus the results provided by the paperboard manufacturer for both the calibration and the prediction data sets. The results in Fig. 9 show a strong correlation (high R 2 values) between the manufacturer's data and the results predicted by the PLS algorithm.

Generalized correlations for calibration and prediction sets when applying seven-component PLS with mean-centered preprocessing.
CONCLUSION
In this article, the recovered-fiber content of paper-board samples was determined from the ATR spectral information by applying two approaches. Under the first approach, unknown incoming paperboard samples were classified into two classes (low and high recovered-fiber content) by applying the feature extraction methods PCA + CVA in combination with the KNN classifier. Under the second approach, the recovered-fiber content of unknown paperboard samples was estimated using the PLS algorithm, achieving a RMSEP of 4.1. Therefore, these promising results show the potential of this method in determining the recovered-fiber content in paperboard samples.
Appealing features of the proposed system include that it is quick, easy to use, and avoids the need for laboratory-grade facilities. Therefore, it may be very useful in the paperboard and packaging industries because it allows a very fast and nondestructive method of testing the quality of incoming stock.
Footnotes
ACKNOWLEDGMENT
The authors thank Mr. Miquel Figuera from Reno de Medici Iberica for his helpful support during the preparation of this article.