
Abstract
The synergistic effect produced by metallic nanoparticles when incorporated into different systems empowers a research field that is growing rapidly. In addition, organometallic materials are at the center of intensive research with diverse applications such as light-emitting devices, transistors, solar cells, and sensors. The Langmuir-Blodgett (LB) technique has proven to be suitable to address challenges inherent to organic devices, since the film properties can be tuned at the molecular level. Here we report a strategy to incorporate gold nanoparticles (AuNPs) into the LB film by co-deposition in order to achieve surface-enhanced Raman scattering (SERS) of the zinc(II)-protoporphyrin (IX) dimethyl ester (ZnPPIX-DME). Prior to the LB co-deposition, the properties of the Langmuir monolayer of ZnPPIX-DME at the air-water interface, containing AuNPs in the subphase, are studied through the surface-pressure versus mean molecular area (π-A) isotherms. The ZnPPIX-DME+AuNPs π-A isotherm presented a significant shift to higher molecular area, suggesting an interaction between both ZnPPIX-DME molecules and AuNPs. Those interactions are a key factor allowing the co-deposition of both AuNPs and ZnPPIX-DME molecules onto a solid substrate, thus forming the LB film. SERS of ZnPPIX-DME was successfully attained, ensuring the spatial distribution of the AuNPs. Higher enhancement factors were found at AuNP aggregates, as a result of the intense local electromagnetic field found in the metal nanoparticle aggregates. The main vibrational bands observed in the SERS spectra suggest a physical adsorption of the ZnPPIX-DME onto the surface of AuNPs. The latter is not only in agreement with the interactions pointed out by the π-A isotherms but also suggests that this interaction is kept upon LB film co-deposition.
INTRODUCTION
Porphyrins are macrocyclic molecules that can bind to several metals to form metalloporphyrins. In general, a strong absorption band in the ultraviolet-visible (UV–Vis) region is seen due to their highly conjugated π-electron systems. 1 Metalloporphyrins have been widely used in catalysis 2 and sensors. 3 Most of these applications are based on techniques for the preparation of thin films,4–8 especially Langmuir and Langmuir–Blodgett (LB).9–11 Langmuir films 12 are fabricated by spreading a solution of the target material, solubilized in volatile organic solvent, onto an ultrapure water subphase. After evaporation of the solvent, the molecules are compressed by mobile barriers forming a monolayer at the air-water interface.13,14 By depositing this film from the air-water interface to a solid substrate, we obtain the so-called LB film. 15 With successive immersions and withdrawals of the solid substrate into and out of the subphase it is possible to grow multilayers of the LB film. The importance of these techniques is the possibility of controlling the film thickness, its supramolecular architecture, and the spatial distribution of the target molecules onto the substrate. 16
Recently, there have been several reports on the surface-enhanced Raman scattering (SERS) of porphyrins.7,17 The metal nanoparticles provide an efficient technique to overcome the high fluorescence of porphyrins, inducing fluorescence quenching to obtain Raman spectra. 5
Raman vibrational scattering is broadly applied to materials characterization providing molecular fingerprint information with minimum sample preparation combined with its capacity to obtain spectra for nontransparent solids or aqueous solutions. 18 However, the use of conventional Raman scattering either for trace analysis or for the study of highly fluorescent samples is not straightforward 18 due to the extremely low cross-section of the inelastic scattering. SERS is a plasmon enhancement technique that makes it possible to go beyond this limitation.19,20 This optical enhancement is achievable due to the localized surface plasmon resonances that can be excited on some metallic nanostructures onto which target molecules are adsorbed.19,21 The magnitude of the local field created by the plasmonic nanostructure depends on parameters such as dielectric function, size, morphology, and local environment of the nanostructure. 22 For instance, many SERS-active substrates prepared by physical vapor deposition, 23 electrodeposition 24 , oblique angle vapor deposition, 25 and the self-assembled layer-by-layer technique 26 have been reported. However, in all these cases at least two steps are required: (i) design the SERS-active substrate and (ii) bring the target molecule to the surface of the nanostructures.
Here we develop a strategy based on co-deposition of both gold nanoparticles (AuNPs) and zinc(II)-protoporphyrin (IX) dimethyl ester (ZnPPIX-DME) into the LB film headed for SERS. The main advantages of this one-step strategy are its simplicity and the possibility to probe film properties with a small amount of AuNPs embedded into the LB films. The key factor is the interaction between AuNPs and ZnPPIX-DME molecules allowing the co-deposition in a solid substrate when forming LB films. The latter was probed via surface pressure versus mean molecular area (p-A) Langmuir isotherms containing AuNPs in the subphase. The plasmon absorption of AuNPs colloid and the co-deposition of the LB monolayer containing both AuNPs and ZnPPIX-DME were monitored using UV-Vis absorption spectroscopy. The morphology was investigated at micrometer scale via micro-Raman imaging, and the spatial distribution of the AuNPs and ZnPPIX-DME within the LB films was examined by SERS mapping.
EXPERIMENTAL
The UV–Vis absorption spectra of AuNPs colloids, ZnPPIX-DME, and ZnPPIX-DME+AuNPs LB films were measured using a Varian spectrophotometer, model Cary 50, from 190 to 1100 nm. Raman analysis and optical microscopy were carried out using a Renishaw in-Via micro-Raman system equipped with a Leica microscope and a 50× objective lens allowing the collection of spectra with a spatial resolution of approximately 1 μm2 and CCD detection. Laser lines at 514.5 and 633 nm with 1800 groove/mm gratings, edge filters, and a computer-controlled three-axis-encoded (XYZ) motorized stage recorded Raman spectra with a minimum step of 0.1 μm.
RESULTS AND DISCUSSION
(
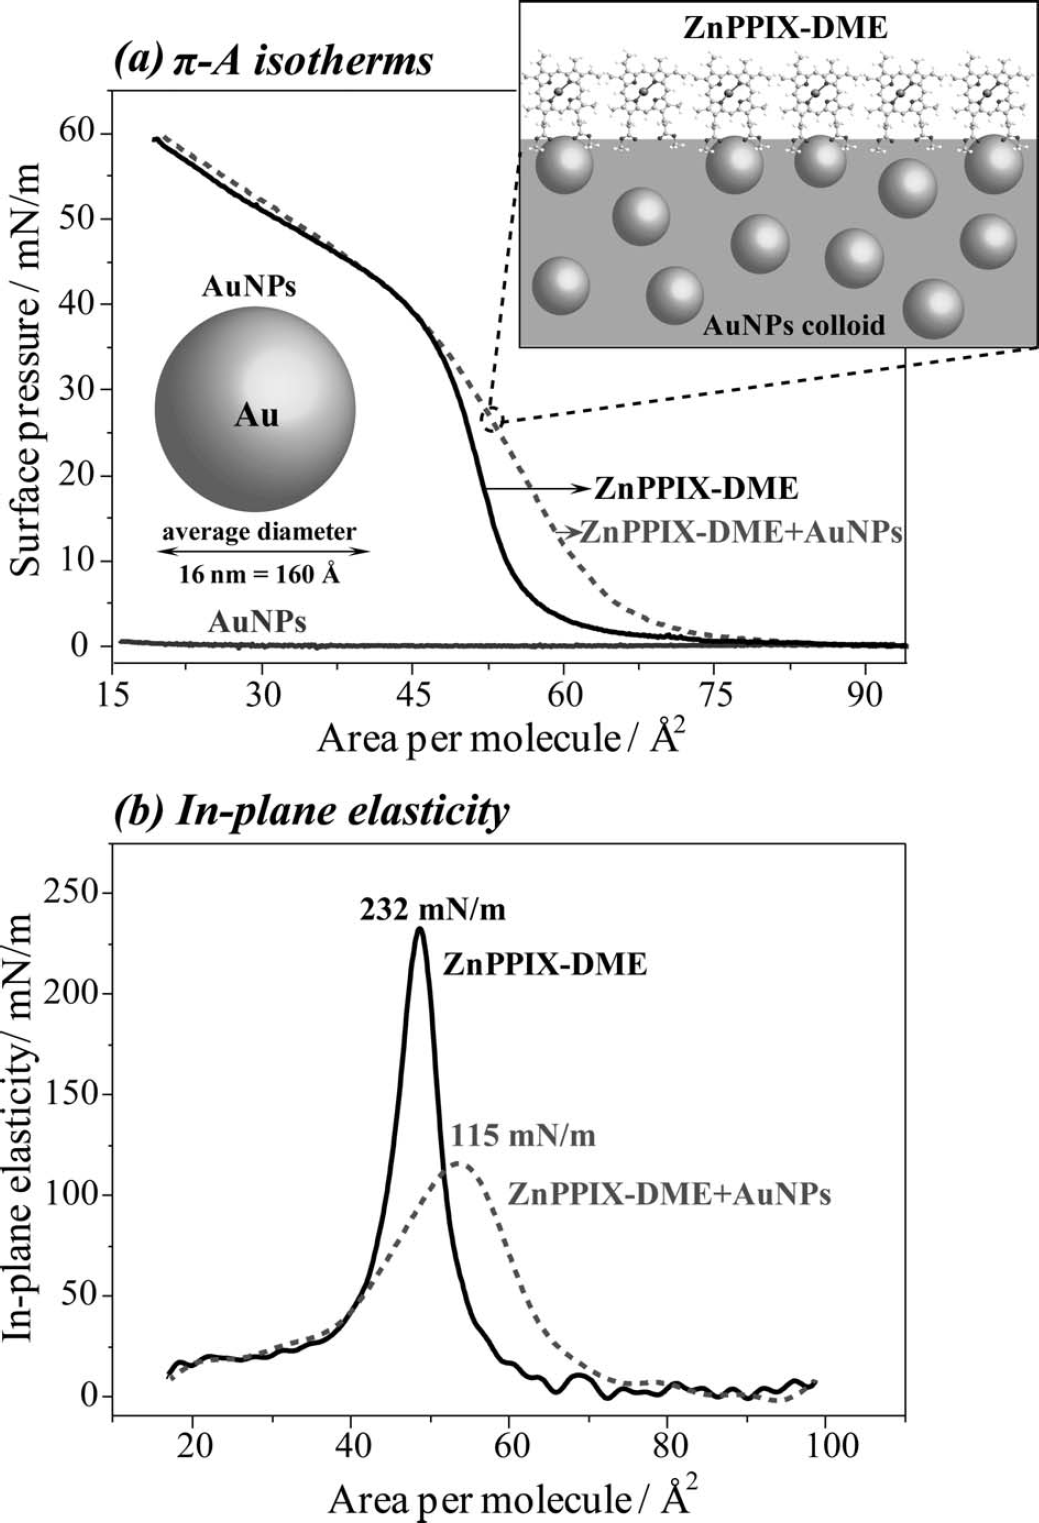
The elasticity of the monolayers was evaluated by the surface compressional modulus (Cs−1), or in-plane elasticity, calculated from the π-A isotherms data plotted in Fig. 1a using the expression Cs−1 = -A(∂π/∂A). 31 The latter approach is performed once the incorporation of AuNPs has affected the mechanical properties of the monolayers. For instance, a drastic decrease of elasticity is seen when AuNPs are incorporated to the ZnPPIX-DME monolayer, as shown in Fig. 1b. The maximum values of elasticity decrease from approximately 232 to 115 mN m−1 considering ZnPPIX-DME and ZnPPIX-DME+AuNPs Langmuir films, respectively. In addition, the maximum of elasticity displacement toward larger areas also reflects the expansion imposed by the incorporation of the AuNPs into the ZnPPIX-DME Langmuir film. The latter is also a result of the interaction between AuNPs and ZnPPIX-DME molecules, as already discussed in Fig. 1a. Torrano et al. 32 have shown that electrostatic interactions between charged AuNPs and Langmuir films of the anionic DPPG phospholipid display remarkable effects. Significantly, the effects were larger for the positively charged AuNPs functionalized with the cationic polyelectrolyte poly(allylamine hydrochloride), but the negatively charged ones also affected the monolayer properties owing to the influence of secondary interactions. Electrostatic interactions are not evident in our system considering that ZnPPIX-DME molecules do not show positive sites. Therefore, secondary interactions may play a role on ZnPPIX-DME+AuNPs Langmuir films.
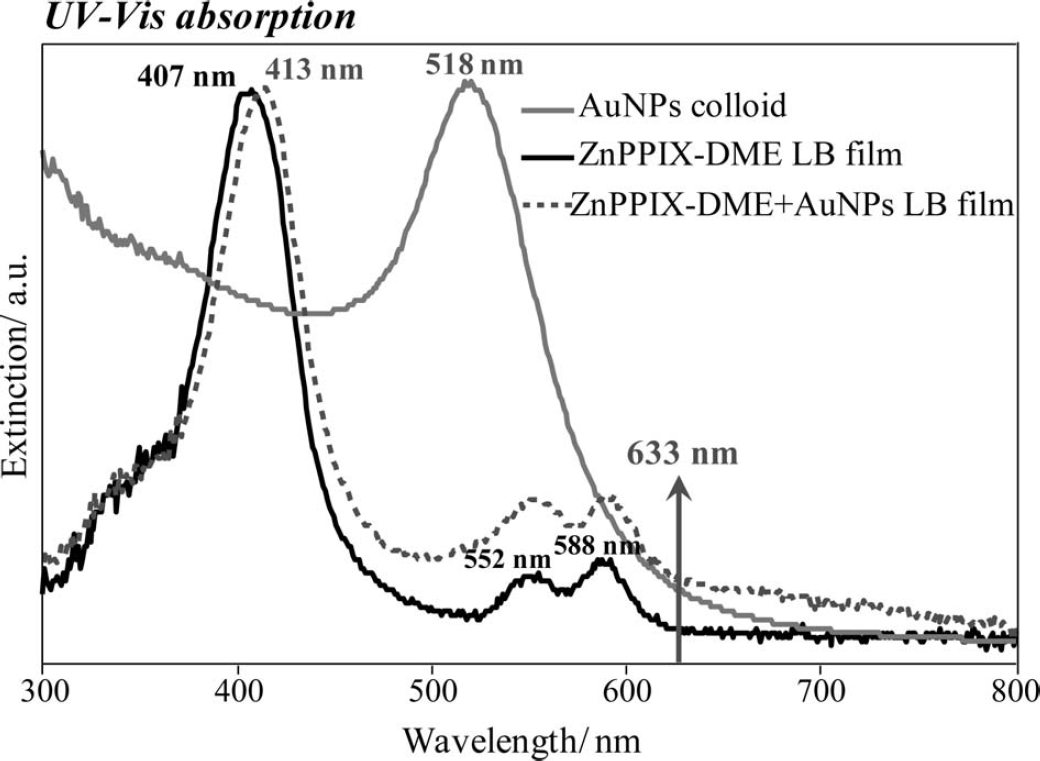
UV-Vis extinction absorption spectra for AuNP colloids and the corresponding surface plasmon absorption (518 nm), ZnPPIX-DME, and ZnPPIX-DMEpAuNPs LB films. The arrow corresponds to the excitation Raman laser line (633 nm).
The spatial distribution of the ZnPPIX-DME and AuNPs in the LB monolayer at micrometer-scale resolution is surveyed using the micro-Raman technique, combining morphological and chemical information with an optical microscope coupled to a Raman spectrograph. Figure 3 shows optical images, normal Raman spectra, and the surface-enhanced Raman scattering (SERS) spectra taken from both ZnPPIX-DME and ZnPPIX-DME+AuNPs LB monolayers. In addition, normal Raman spectra from ZnPPIX-DME powder, of ZnPPIX-DME LB film (nine monolayers), and LB-SERS spectrum for ZnPPIX-DME-AuNPs LB film are shown in Fig. S1 (see Supplemental Material). The vibrational assignments for the main Raman bands in the spectra shown in Fig. 3 are noted in Table I.4,5,37–39 The optical images shown in the inset in Fig. 3 reveal some degree of AuNP aggregation scattered throughout the ZnPPIX-DME+AuNPs LB film. Because the AuNPs do not form a homogeneous SERS substrate, examining the spectra (from 300 to 1800 cm−1) recorded individually from several spots, discloses that average SERS spectra are observed with variable absolute intensity. It may be expected that a SERS intensity maximum corresponds to regions on the surface with a higher concentration of AuNPs. It is known that the intense electromagnetic field found in metal nanoparticles aggregates can lead to the highest enhancement factors of SERS signal 19 and is probably the reason why ZnPPIX-DME SERS spectra are seen with variable intensity. An empirical estimation of the enhancement factor can be made, considering the intensity ratio between the SERS and Raman spectra for a certain band.19,40 In our case, the estimation of the enhancement factor could be made considering the intensity ratio SERS and Raman, where the SERS intensity is recorded for the LB monolayer deposited from the AuNPs colloid subphase and the Raman intensity is recorded for the LB monolayer deposited from the ultrapure water subphase. However, a single LB monolayer did not provide a signal above the noise level, under the same experimental conditions of SERS. Therefore, if the SERS intensity is divided by the noise level, a maximum enhancement factor of ∼103 would be seen. However, using the LB film with nine monolayers as a reference (Fig. S1), an approximate EF = 400 is obtained. This is in agreement with the enhancement factors predict for average SERS considering the electromagnetic mechanism, where the enhancement is basically produced by the electromagnetic field amplified surrounding the metal nanoparticles surface.19,40
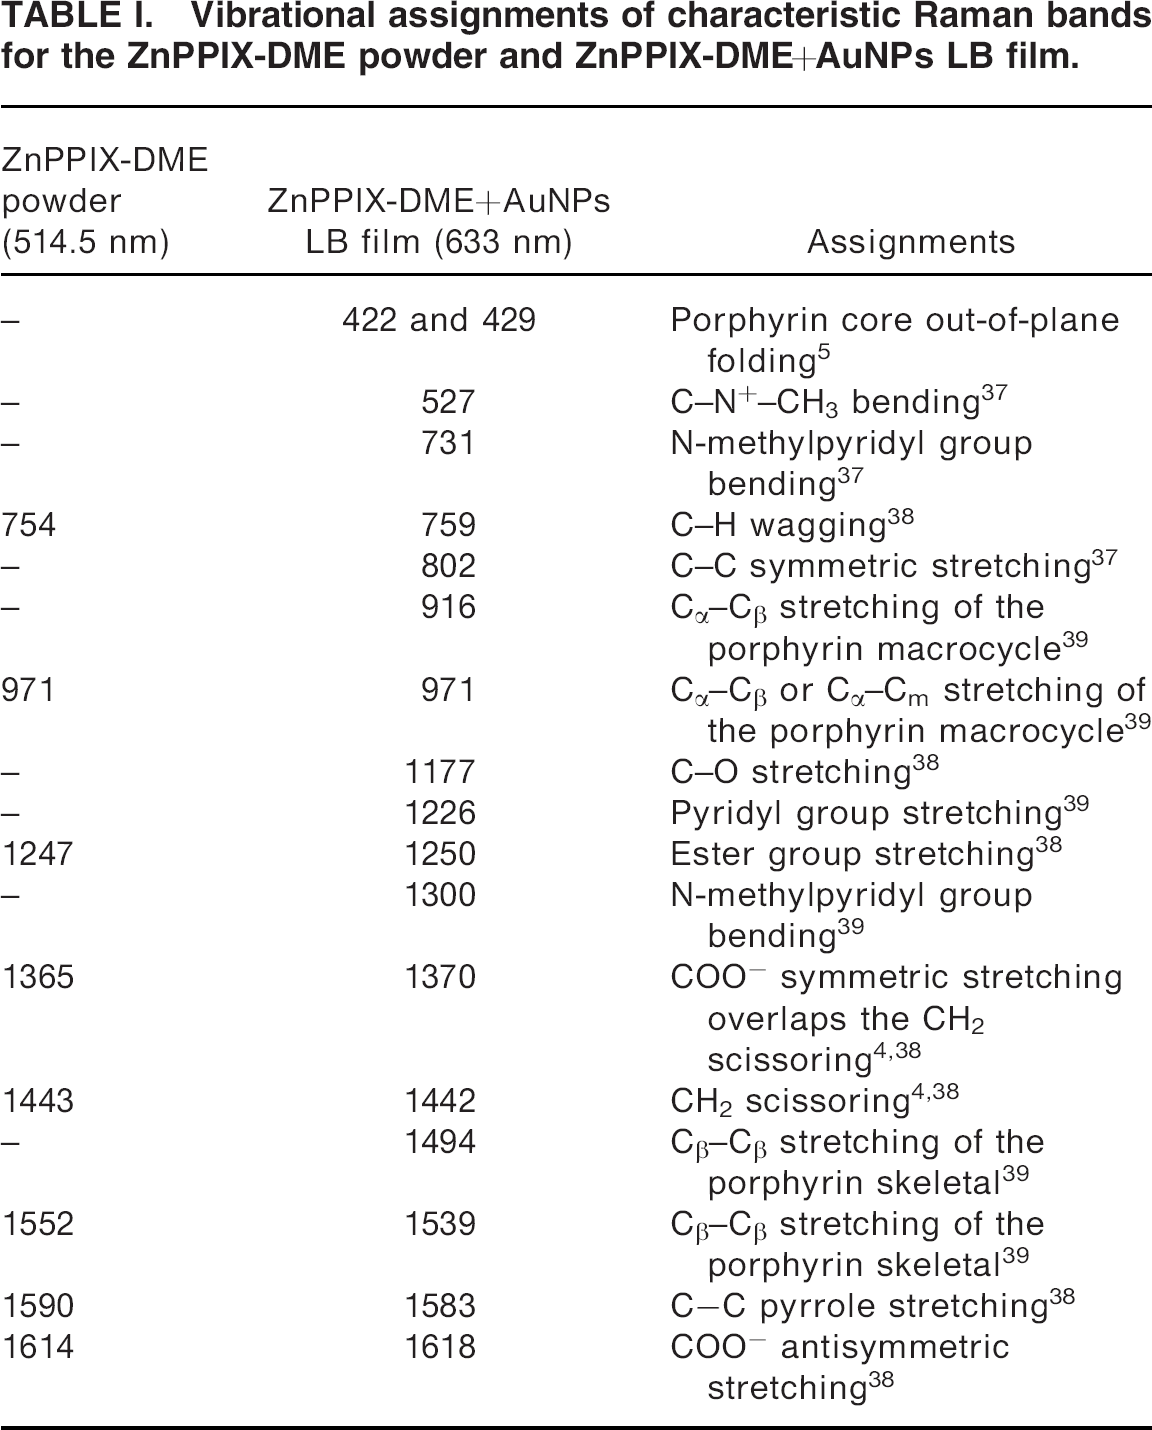
Vibrational assignments of characteristic Raman bands for the ZnPPIX-DME powder and ZnPPIX-DME+AuNPs LB film.
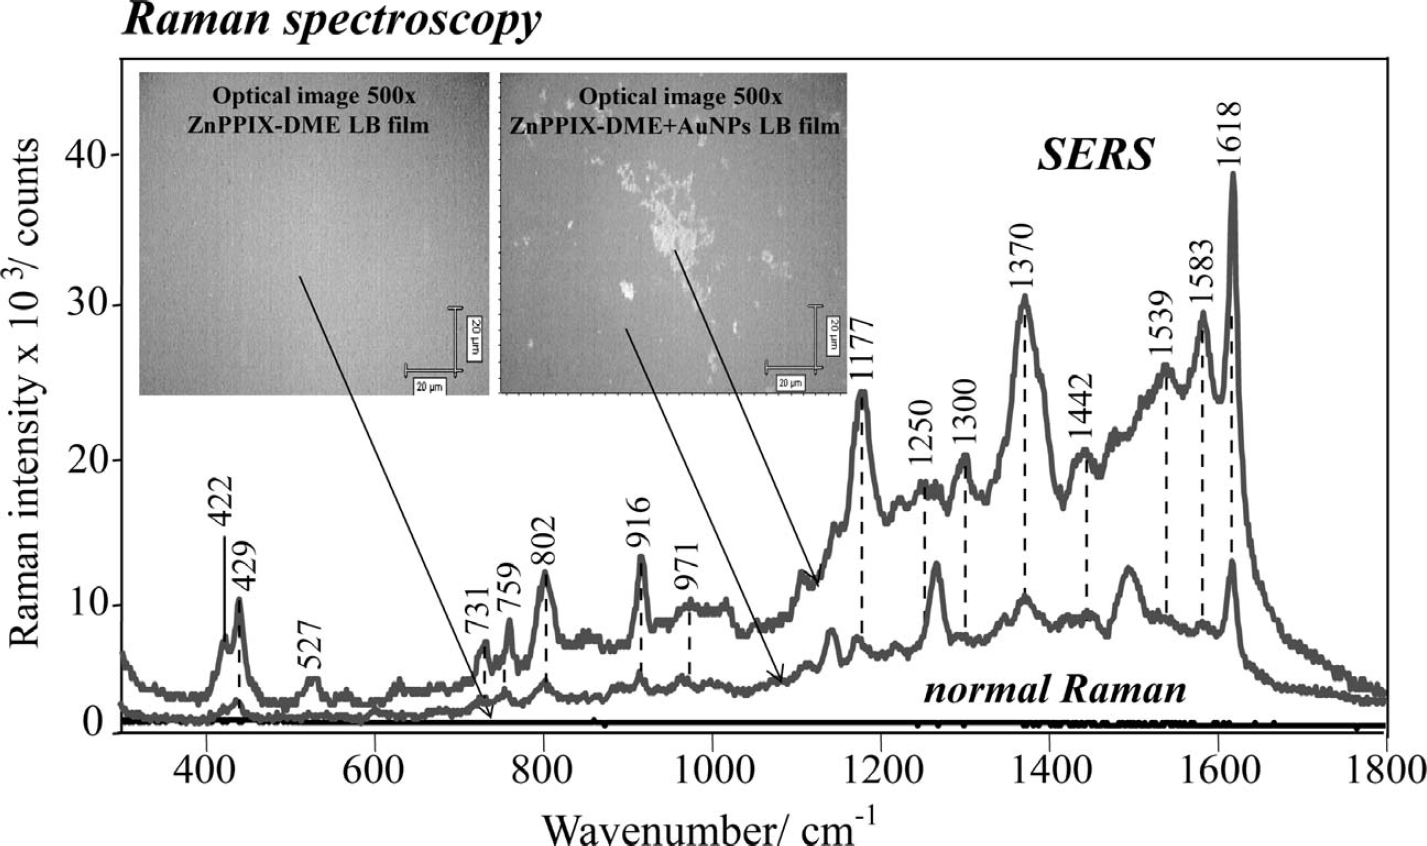
Normal Raman scattering and SERS spectra collected for ZnPPIX-DME and ZnPPIX-DME+AuNPs LB films using the excitation laser line at 633 nm. The insets show optical images recorded for both ZnPPIX-DME and ZnPPIX-DME+AuNPs LB films, and the arrows indicate the spots from where the SERS and Raman were recorded.
Figure 4 shows the optical image for a micrometer domain of AuNPs at the surface of the ZnPPIX-DME-AuNPs LB film. Overlaid with the optical image is Raman mapping that was recorded for an area of 60 μ × 60 μm and a step of 2 μm leading to a total of 961 spectra. The area mapping was built plotting the intensity of the band at 1618 cm−1, where brighter spots refer to more intense Raman bands. The band at approximately 1618 cm−1 is attributed to COO− stretching. 38 It is seen that the intensity of this band varies significantly from spot to spot, which is a direct consequence of the spatial distribution of the AuNPs 41 , as pointed out in Fig. 3.
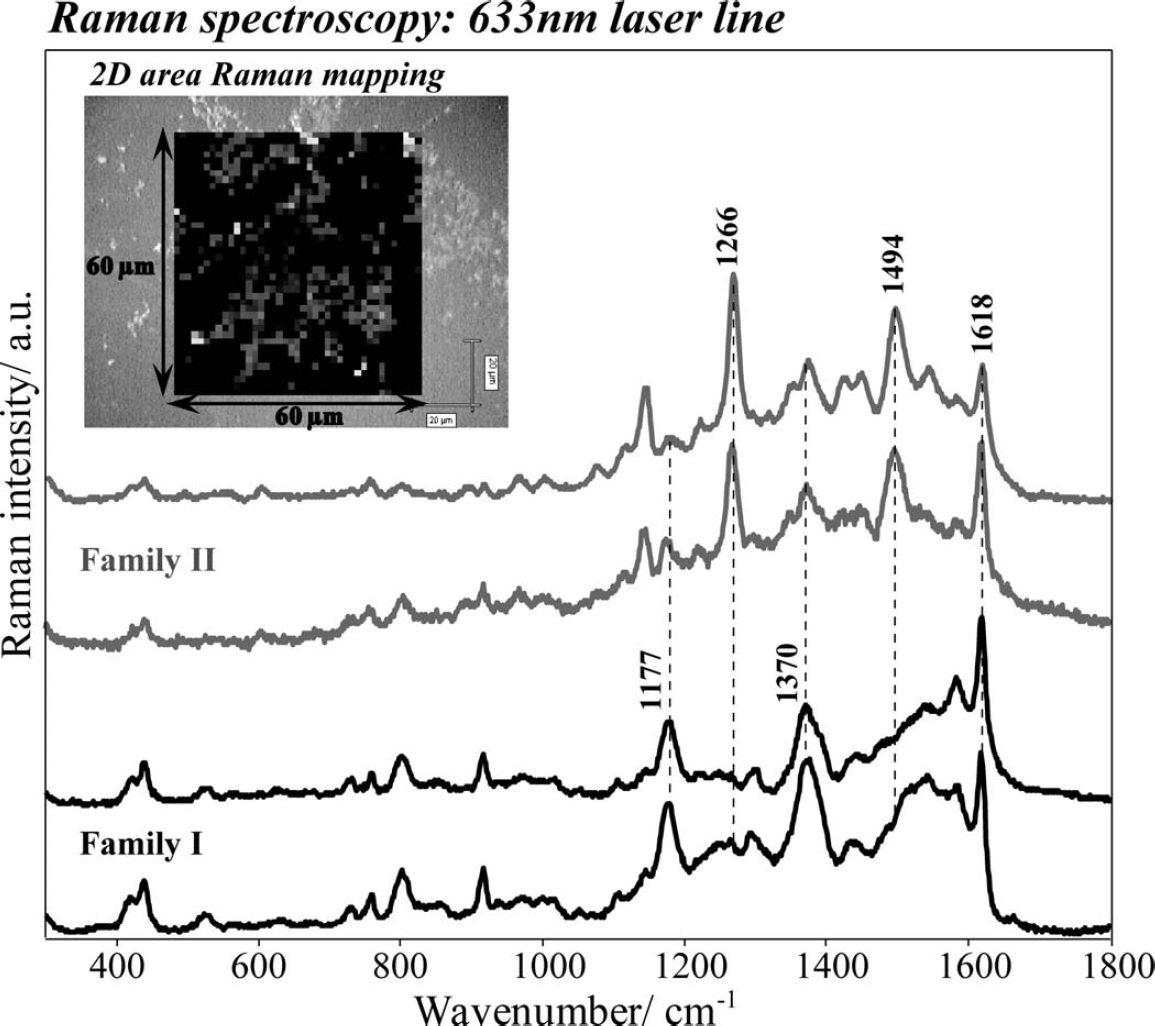
Optical image and Raman mapping (superposed) recorded for the ZnPPIX-DME+AuNPs LB film for an area containing micrometer domains of AuNPs. It is also shown a collection of SERS spectra collected in different regions.
Figure 4 also displays a collection of SERS spectra taken in different regions. Two families of spectra can be identified, represented by gray and black lines. The spectra recorded correspond to similar vibrational Raman bands. However, slight differences in terms of relative intensity are observed from one family to another that could be due to different selection rules for two predominant molecular orientations near the metal surface. 42
The three main bands of greater enhancement shown in the SERS spectrum of family I are found at 1177, 1370, and 1618 cm−1, assigned to C-O stretching, 38 COO− symmetric stretching4,38, and COO− antisymmetric stretching, 38 respectively. The same effect of enhancement is seen in family II for the bands at 1266, 1494, and 1618 cm−1, assigned to pyridyl group stretching, 39 Cβ-Cβ of the porphyrin skeletal stretching, 39 and COO− antisymmetric stretching 38 , respectively. These vibrational modes belong to the ester moiety for family I, and the ester moiety plus porphyrin skeletal for family II. Considering that the enhanced signal is highly dependent on molecular orientation and the distance between the molecular groups and nanoparticles19,42, one can assume that the physically adsorbed ZnPPIX-DME molecules on the surface of AuNPs aggregates leads to two predominant molecule-surface orientations. Bearing in mind the surface selection rules and the enhanced bands in families I and II, we could speculate that the family I spectra suggests the molecules are vertically oriented and adsorbed onto the AuNPs through the ester groups. The latter is not only in agreement with the interaction model proposed by the Langmuir film properties (Fig. 1a), but also suggests that this interaction is kept upon LB film fabrication. Conversely, the family II spectra suggest the molecules are also vertically oriented and are adsorbed onto the AuNPs through both ester group and porphyrin skeleton. Figure 5 represents the two molecular orientations supposed for the ZnPPIX-DME adsorbed onto the AuNPs.
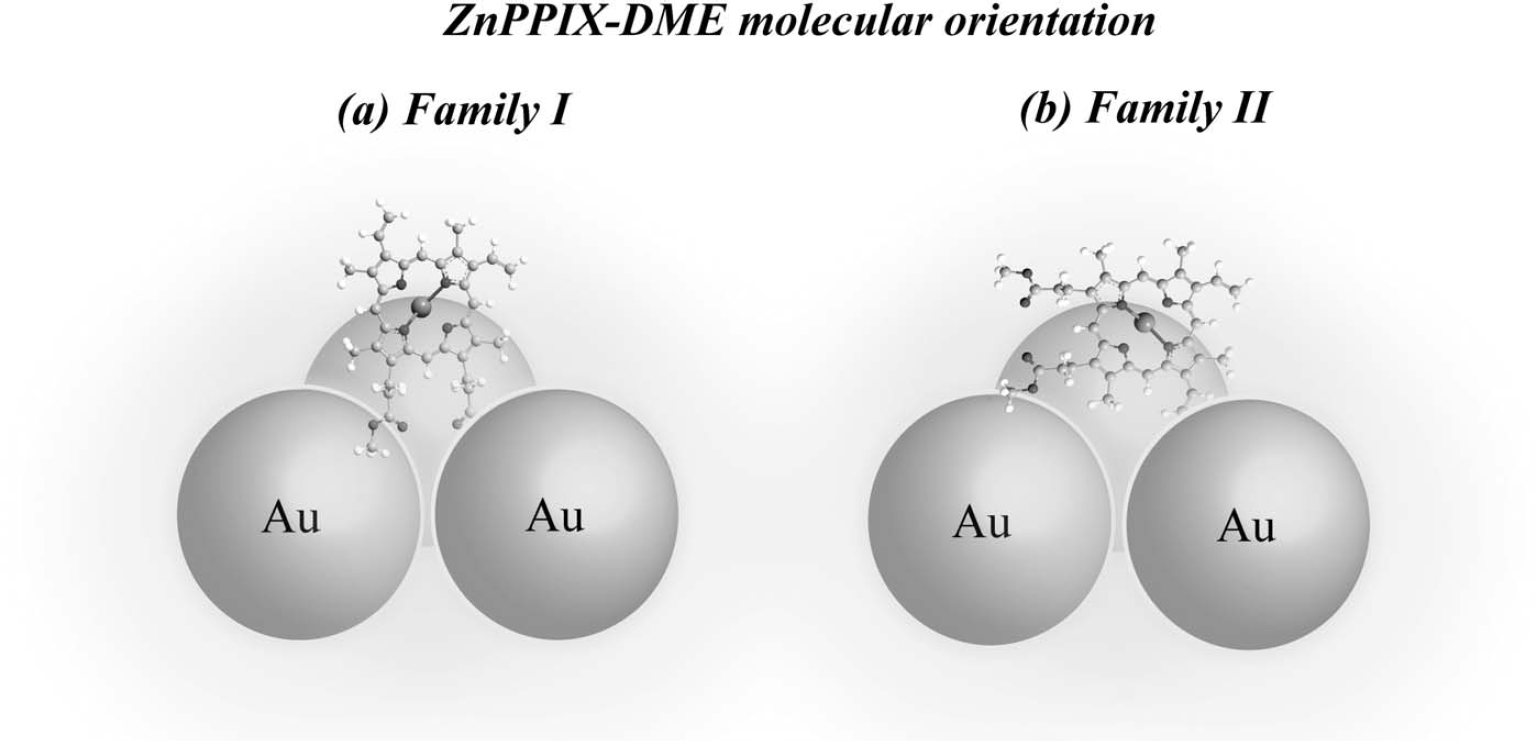
ZnPPIX-DME molecular orientation supposed for the ZnPPIX-DME adsorbed onto the AuNPs considering the surface selection rules and the enhanced bands in the SERS spectra for families I and II.
CONCLUSIONS
A strategy based on LB films co-deposited with metal nanostructures to obtain SERS is reported here. Gold nanoparticles added into the water subphase interact with ZnPPIX-DME as can be inferred from changes observed in the properties of the Langmuir film. The π-A isotherms are shifted to larger molecular areas as a result of the interaction between AuNPs and ZnPPIX-DME molecules. The physical interactions are a key factor that allows the co-deposition of LB films containing both AuNPs and ZnPPIX-DME. The SERS of ZnPPIX-DME is successfully observed, suggesting that ZnPPIX-DME molecules are physically adsorbed onto AuNPs through both the ester group and the molecular skeleton. Because the distribution of the AuNPs is not homogeneous, the SERS spectra follow the spatial distribution of the AuNPs; this is evidence that higher enhancement factors are likely found at AuNP aggregates. This strategy is an important addition to well-established SERS methods due to its capacity for dealing with different molecules that can be assembled into LB films and its simplicity.
Footnotes
ACKNOWLEDGMENTS
This work was supported by the Brazilian agencies Fundação de Amparo à Pesquisa do Estado de São Paulo (FAPESP), Conselho Nacional de Desenvolvimento Cientifico e Tecnologico (CNPq), and Coordenacao de Aperfeicoamento de Pessoal de Nivel Superior (CAPES).