
Abstract
To solve the low detection efficiency of the present hyperspectral detection method based on adaptive coherence estimator (ACE), an improved detection method based on white Gaussian noise (WGN) is proposed in this paper. Primarily the method uses the spectral angle mapping (SAM) method to adaptively set an optimal signal-to-noise (SNR) parameter based on the hyperspectral image. Then, a corresponding white Gaussian noise is generated according to this SNR parameter and is added to the original image to get a new image data. Finally, based on the new image data, a better target detection result can be obtained by using the ACE detection algorithm. The image data, added to the white Gaussian noise, are more consistent with the theoretical hypotheses of the ACE algorithm. Therefore the detection performance of the algorithm can be efficiently improved. Meanwhile, the adaptivity of setting the optimum SNR parameter in various images can make the method more universal. Experimental results of real world hyperspectral data show that the proposed ACE-WGN method can effectively improve detection performance.
INTRODUCTION
Hyperspectral remote sensing technology is a new technology for earth observation. It can simultaneously acquire the spatial information, radiation information, and spectral information specific to ground objects. It shows a unique advantage in target detection and recognition and has become one of the focuses for research in the field of image processing. 1
The hyperspectral detection method is mainly divided into three categories: 2
Spectral characteristics-based target detection, e.g., spectral angle mapping (SAM) 3 , Euclidean distance. 4
Probability and statistics modeling-based target detection, e.g., adaptive coherence estimator (ACE) 5 , adaptive matched filter (AMF) 6 , constrained energy minimization (CEM). 7
Subspace projection-based target detection, e.g., orthogonal subspace projection 8 , oblique subspace projection (OBSP). 9
Among these, spectral characteristics-based target detection is simple and straightforward. But its detection performance is easily affected by the noise, and detection performance is very poor when the target spectrum is similar to the background spectrum.
Subspace projection-based target detection is a kind of supervised detection algorithm. Before target detection, prior knowledge of the background spectrum must be obtained. But generally, prior knowledge about the background is obtained with difficulty. The usual approach is to estimate the background spectrum from the obtained hyperspectral image. The detection performance of the algorithm is affected significantly by the estimation accuracy of the background spectrum. Therefore, such a method has poor adaptability.
Probability and statistics modeling-based target detection is performed in the hyperspectral images based on the traditional statistical pattern recognition method. This kind of method has a clear mathematical theory model and has stronger adaptability. The CEM algorithm is derived from the linearly constrained minimum variance beamformer, and the advantage of CEM is that it is a simple structure. The disadvantage is detection performance significantly degrades when the target pixels are increased. ACE and AMF are two adaptive generalized likelihood ratio detection algorithms, and their detection results have a high signal-to-noise ratio (SNR). The false target suppression of ACE is more effective than of AMF. But the practically obtained hyperspectral image is not completely consistent with its mathematical and statistical modeling assumption. This deviation largely degrades the detection performance of ACE. Therefore, an improved ACE detection method based on white Gaussian noise (ACE-WGN) is proposed in this paper. In this method, the image data can be made more in line with the theoretical hypotheses of the ACE algorithm by adding the white Gaussian noise to the original hyperspectral data, so the detection performance of the algorithm can be further improved. Moreover, the adaptivity of setting the SNR parameter in different images makes the algorithm universal.
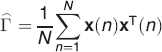
ADAPTIVE COHERENCE ESTIMATOR
If the spectra are treated as random vectors with specific probability distributions, given an observed spectrum x, there will be two competing hypotheses: H0, target absent, and H1, target present.
If P(x|H0) and P(x|H1) are the conditional probability density functions of
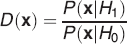
If D(
Suppose the background
Then,
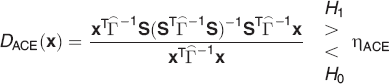
where
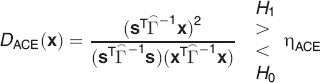
If the target subspace is specified by the direction of a single vector
ADAPTIVE COHERENCE ESTIMATOR DETECTION METHOD BASED ON WHITE GAUSSIAN NOISE
From the above theoretical analysis, we can see two key assumptions in ACE algorithm: (1) the background follows a normal distribution and (2) the background has the same covariance structure under the two hypotheses. However, some deviations in the above assumptions depart from reality and restrict the detection performance of the algorithm. Therefore, this paper proposes an improved ACE-WGN. The main idea of the method is that, based on the hyperspectral data, we generate the white Gaussian noise with appropriate magnitude and add the noise to the original image. In this way, the image data can be made much closer to normal, and the covariance structure of the background under two assumptions is more similar, so that the data are closer to the theoretical model. Then we apply the ACE algorithm to the image data, and a better detection result can be obtained. Figure 1 is block diagram of the ACE-WGN detector.
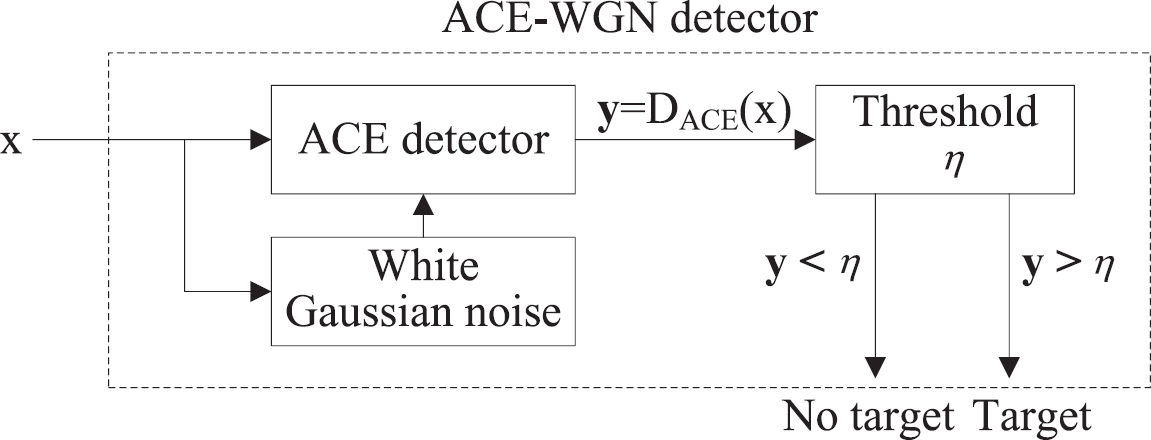
Block diagram of ACE-WGN detector.
In general, noise is any undesired information that contaminates an image. Noise reduction processing is often required to improve image quality and get a good result in application. However, when using the ACE algorithm to detect the target in a hyperspectral image, the denoised image may produce a worse quality result image than that of the original image. Based on the analysis, we draw a counterintuitive conclusion that if the original image data are not identical to the normal distribution, the ACE detector could get a better target detection result by adding some amount of white Gaussian noise to the image. The reasons are probably twofold: First, the ACE algorithm is based on a probability model, and the image data are treated as random vectors. Adding white Gaussian noise to the image does not change the randomness of the data. Moreover, the noise and spectral mutation in the original image can be canceled or reduced on some level, the trends of the spectral curves in the same class are more similar to each other, and the distribution of the data approaches the normal distribution. Second, one of the assumptions of ACE is that the mean value of the data is different under the two hypotheses. As long as this difference still exists in the noisy image, the target could be detected.
Therefore, the key to the ACE-WGN algorithm is the determination of the amplitude of the desired adaptive white Gaussian noise that will be added into the different hyperspectral images. If the amplitude of added noise is too large, the SNR will be very low, and the target will almost be submerged by noise. There will be no differences of the mean data between the target absent and present. Then it will bring enormous difficulty to detection as well as bad performance. If the amplitude of added noise is too small, the data distribution will not be changed much, and the covariance structure of background under two assumptions will not be similar enough to improve the detection performance of the algorithm.
Therefore, we must ensure that the added noise can make the image data much closer to normal and the covariance structure of the background under the two assumptions as much as similar before the target signal is submerged in the noise.
The specific steps can be summarized as follows:
Step 1: Select a target vector s and set the initial values of the SNR parameter, e.g., SNRn = 100 dB, where n = 1.
Step 2: Use s as a benchmark to generate the white Gaussian noise
Step 3: Calculate the spectrum angle between
Step 4: Set n = n + 1, SNRn = SNRn−1−2 dB and do the condition judgment. If SNRn < −50 dB, then go to Step 5. Otherwise, go to Step 2.
Step 5: Draw the curve of the calculated SAn, and find the inflection point SAm of the curve. Set the threshold SA = 0.5 × SAm and find the closest point SAt from SA, i.e., SAt = arcmin(SAn − SA). Then the corresponding SNRt is set as the optimum SNR parameter, i.e., SNR = SNRt.
The purpose of this step is to find a maximum critical threshold of similarity based on the curve of SAn, and then according to this threshold to set the optimum SNR parameter. If the similarity value is below the threshold, it means the difference between
It is difficult to design a formula of general applicability to set the threshold. But we know that at the inflection point of the curve, the rate of change reaches a maximum. So, through experiments and experience, we set half of the corresponding inflection point similarity value as the maximum critical threshold of similarity to indicate whether the change of similarity is significant or not. Then we set the corresponding minimum critical threshold of the SNR as the optimum SNR parameter. Relevant experiments show that the critical threshold set in this step may be not the true optimum value, but it can be guaranteed in the interval of the optimum. So it ensures the robustness of the method to some extent.
Step 6: Use the image data
EXPERIMENTAL VALIDATION
In this section, the real hyperspectral image data are used to validate the effectiveness of the proposed method, and the experiments are conducted to compare the proposed method with four classic detection methods: ACE, OBSP, CEM, and SAM. The receiver operating characteristic (ROC) curve is adopted to quantitatively measure the effect of target detection. 10 If the target is more similar to the background and difficult to detect, the ROC curve will become straighter, and the area under the curve (AUC) will be smaller. If the target is less similar to the background, that is, the target is more easily detected, the curve will bend to the left, and the AUC will be larger.
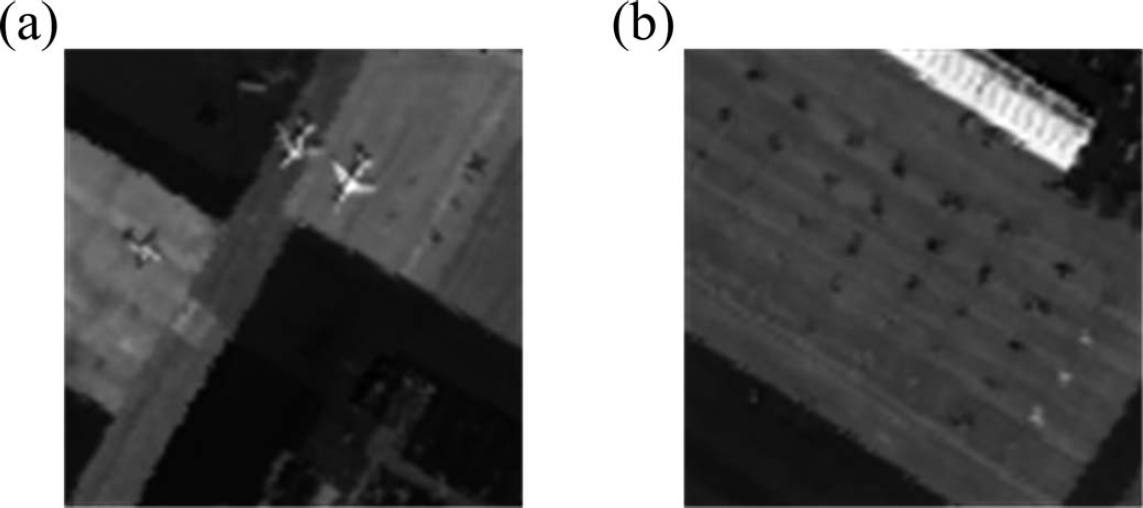
Experimental image of AVIRIS data: (
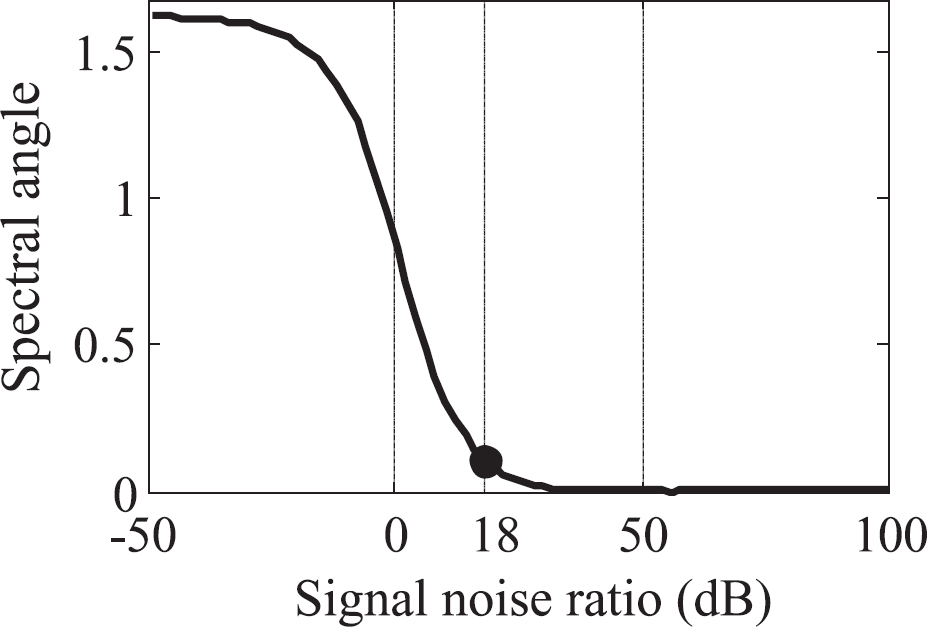
Figures 3a and 3b, respectively, show the spectral angle curve between
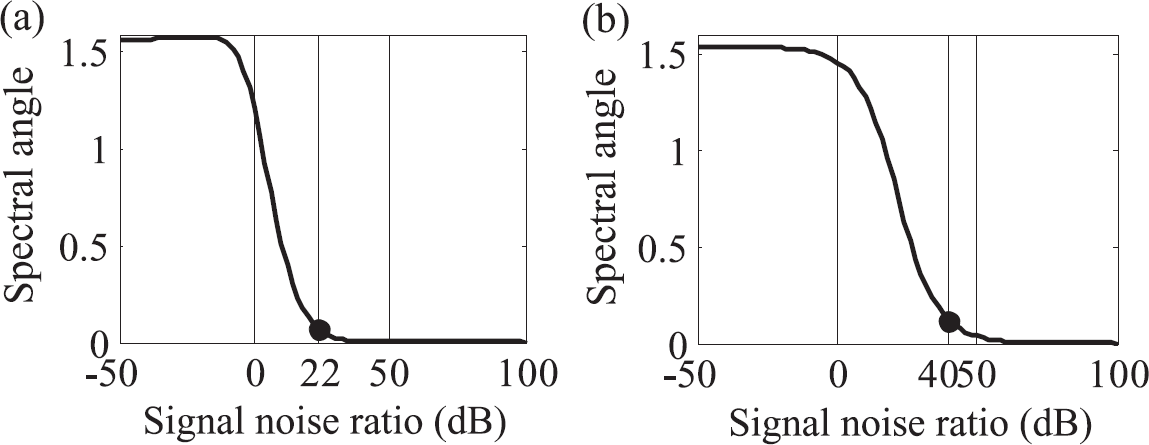
The curve of SAn for the SNR parameter setting: (
As can be seen from Fig. 3, the optimum SNR parameter of sub-image I is 22 dB. The optimum SNR parameter of sub-image II is 40 dB.
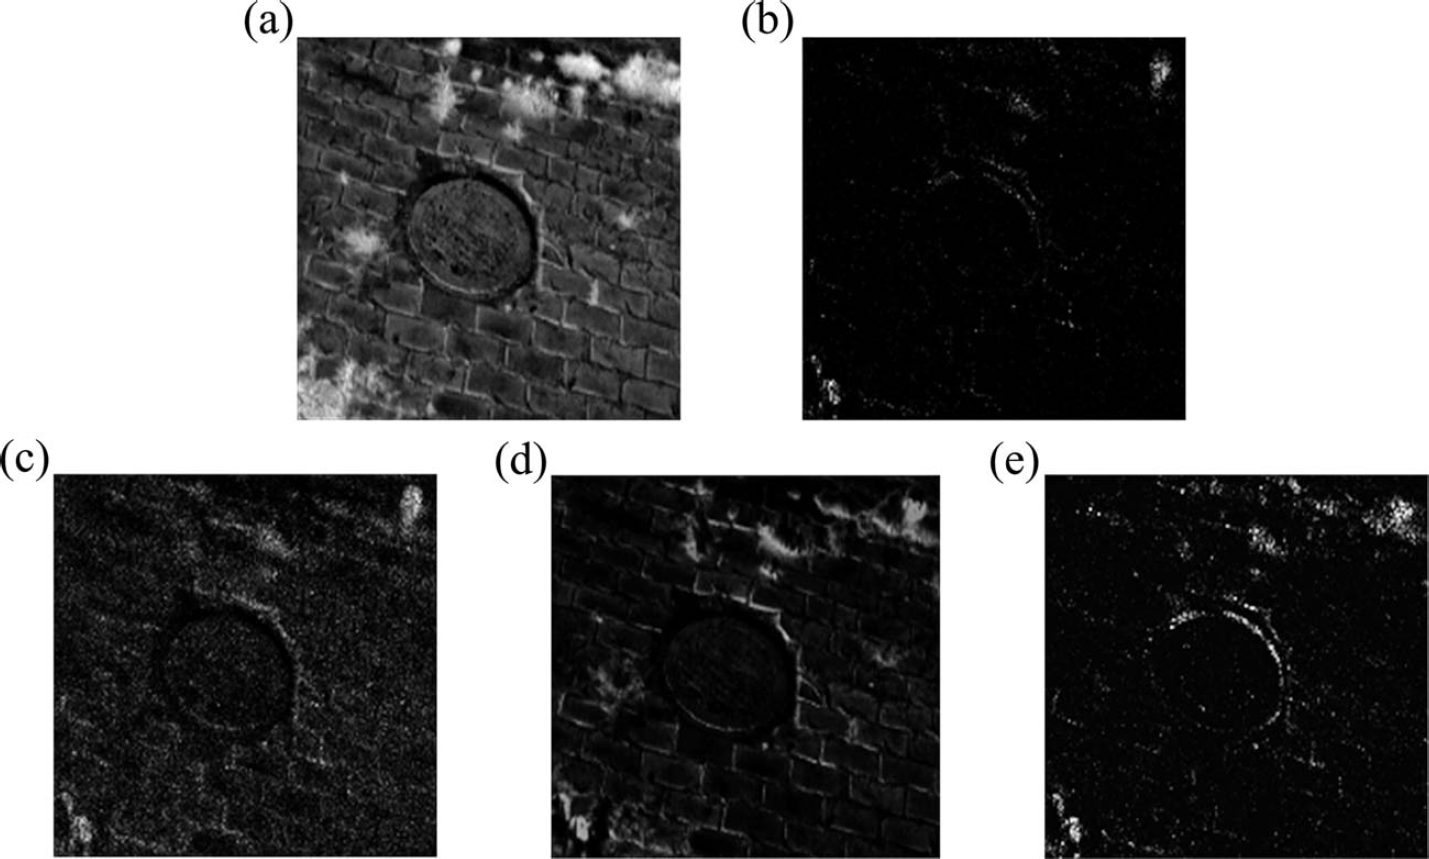
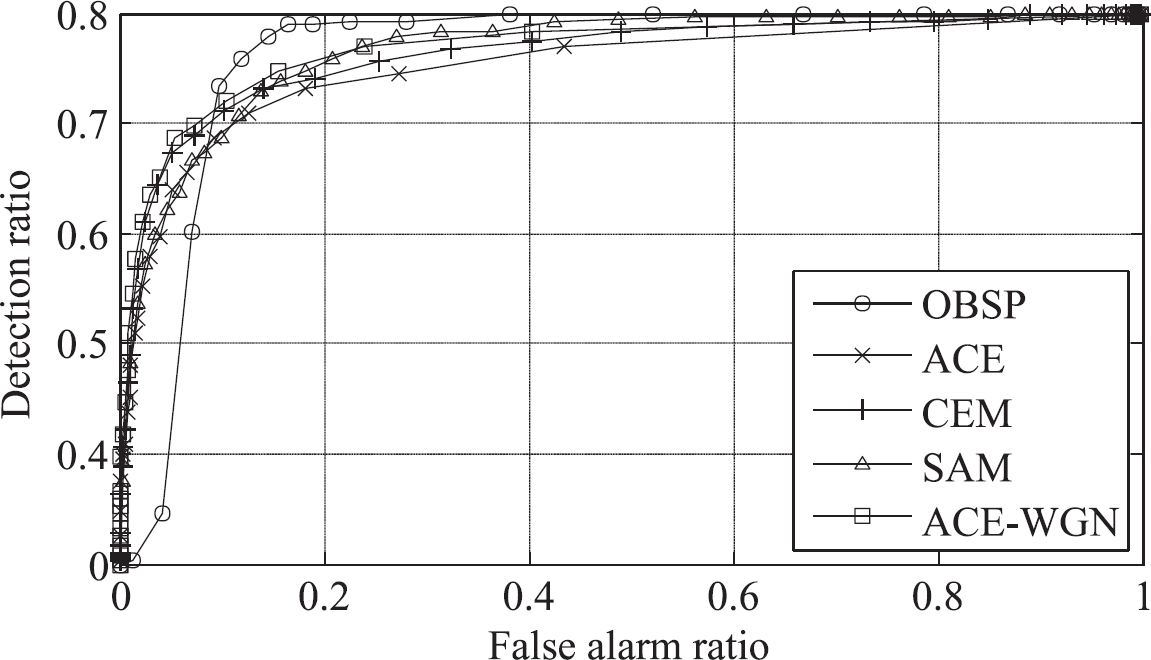
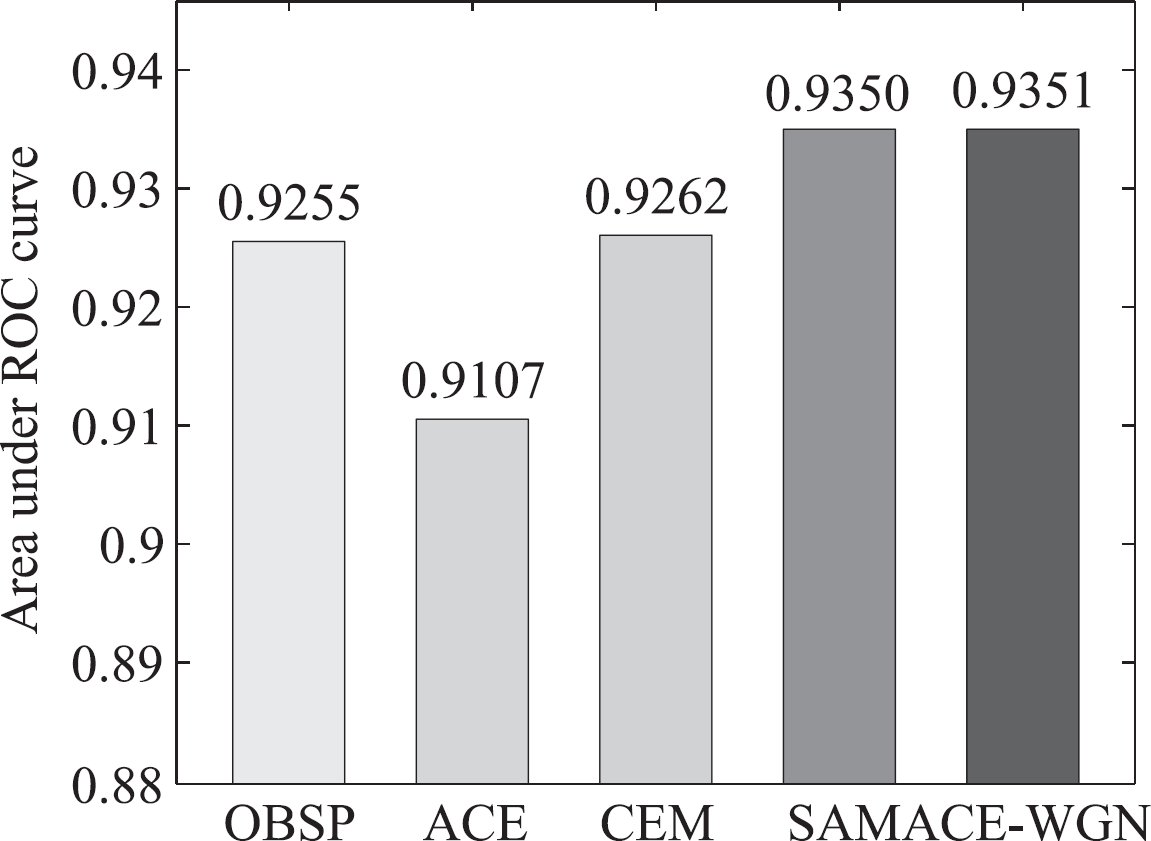
Figures 4a–4e show the detection results obtained from sub-image I by using OBSP, ACE, CEM, SAM, and ACE-WGN. Figures 5a–5e show the corresponding result obtained from sub-image II. Figures 6a and 6b show the ROC comparison figure of the two sub-images. Figures 7a and 7b show the corresponding AUC value of the ROC curve.
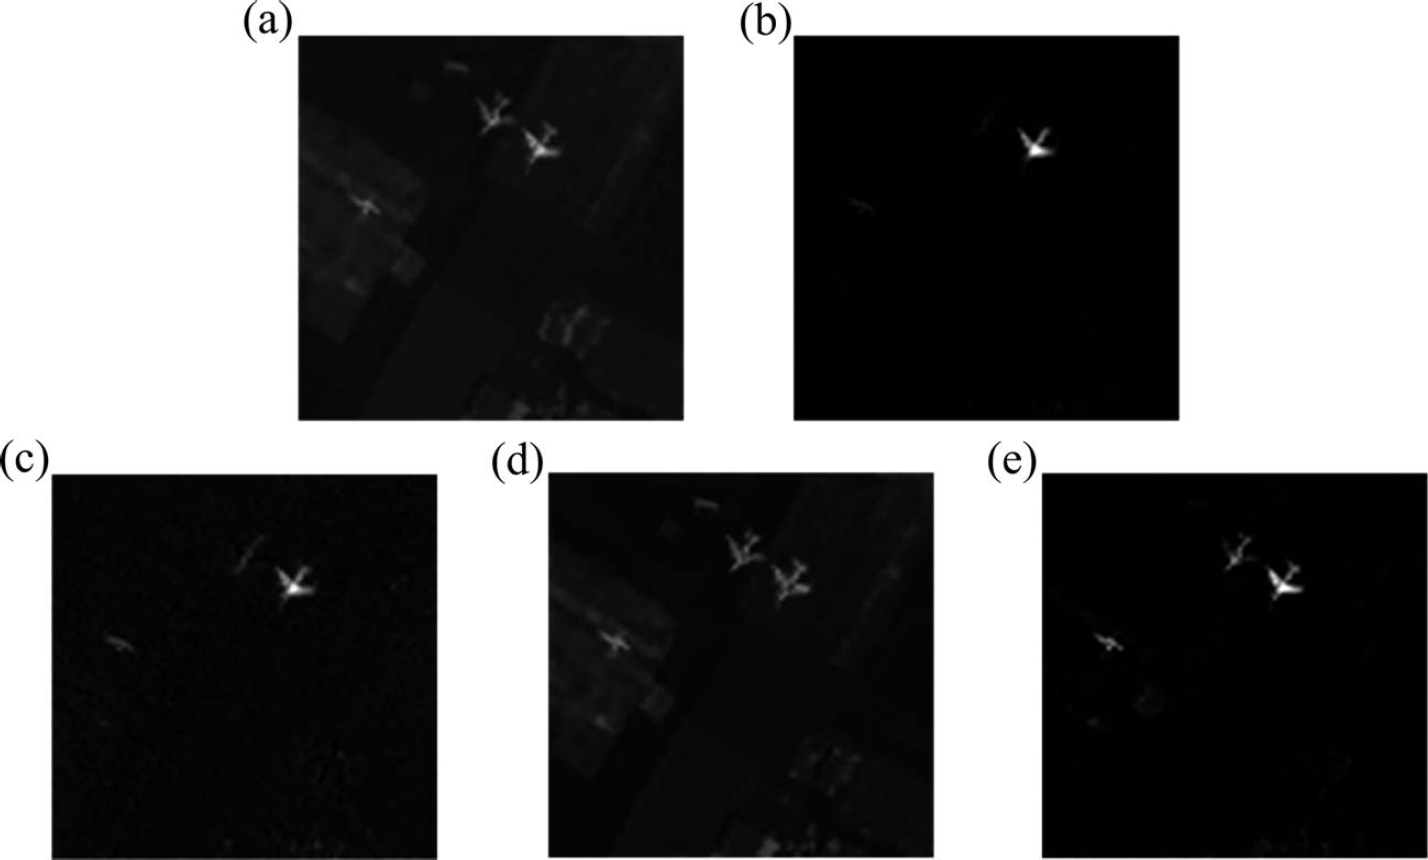
Detection result obtained from sub-image I of AVIRIS data by using (
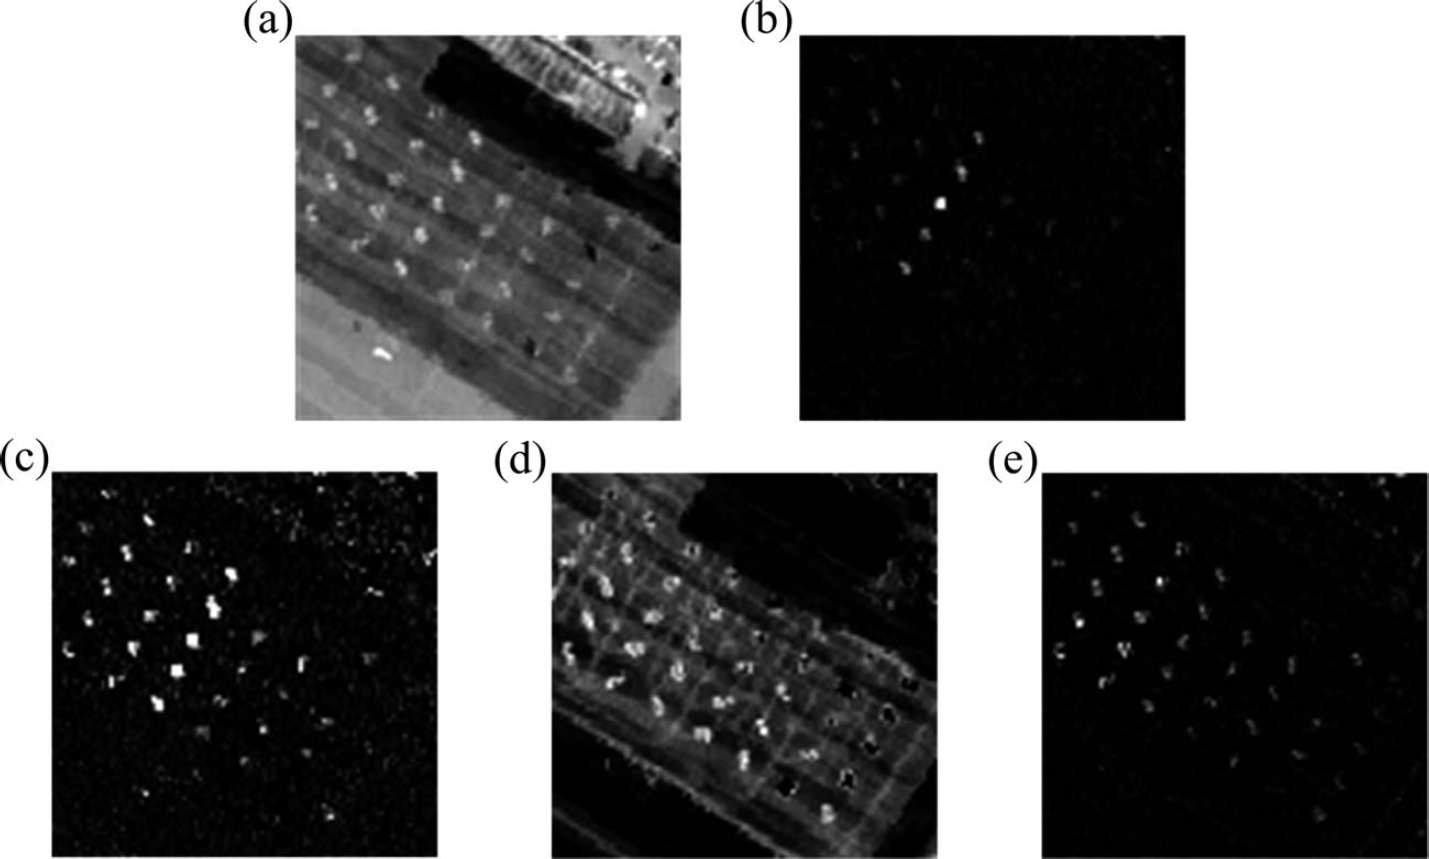
Detection result obtained from sub-image II of AVIRIS data by using (
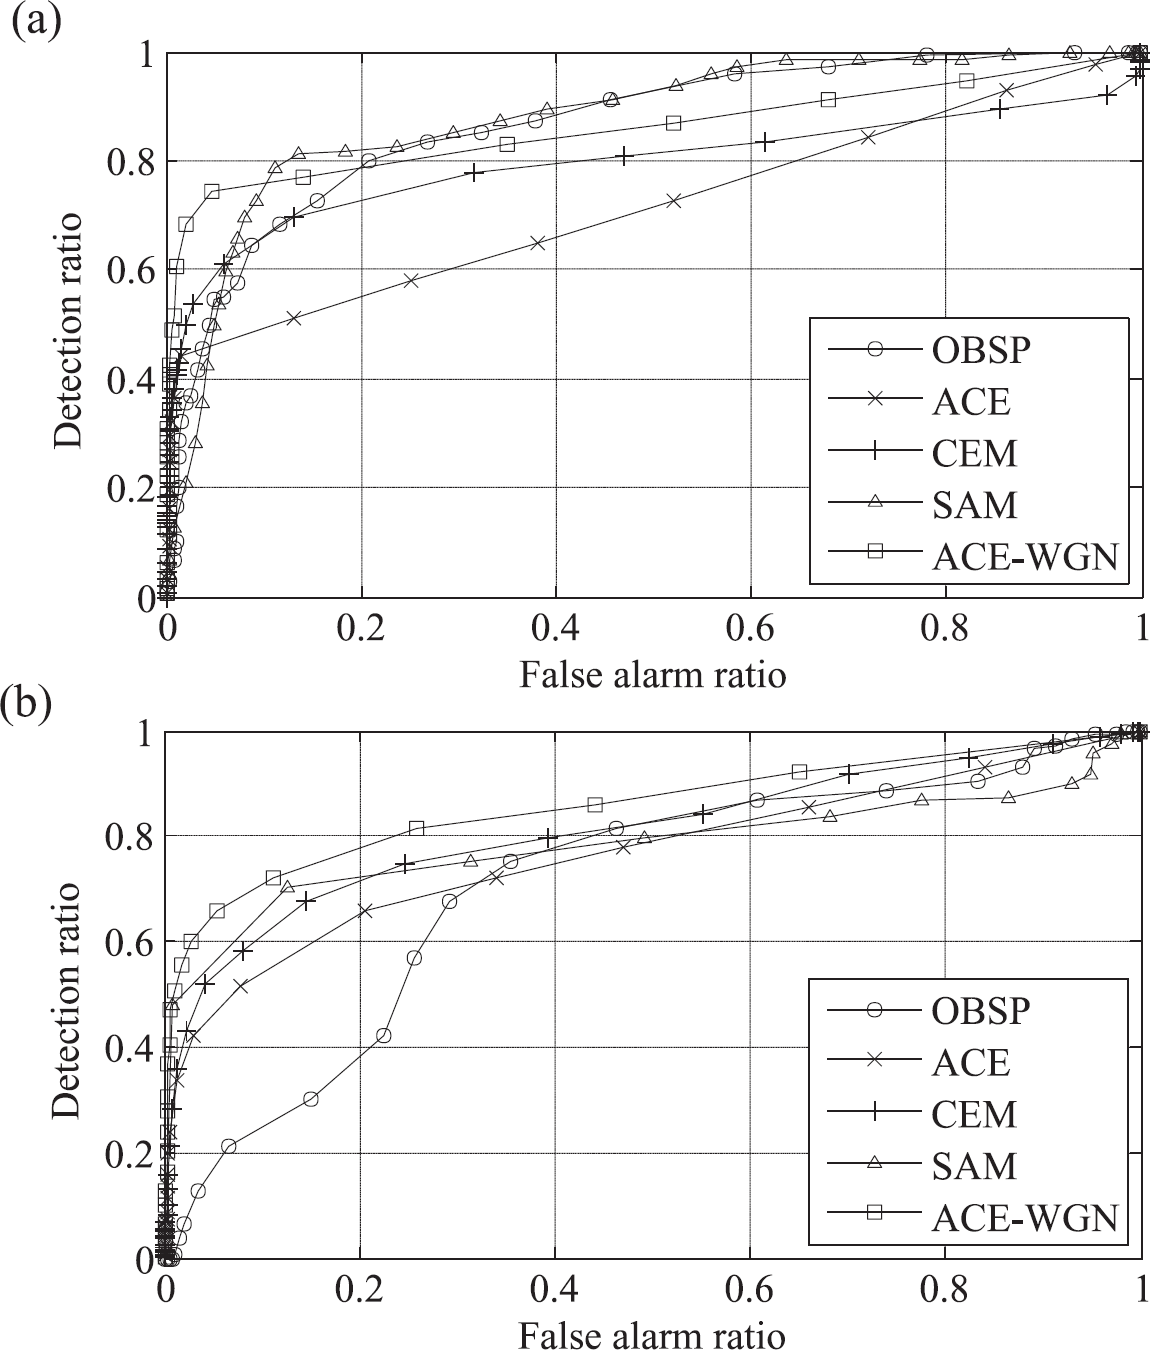
ROC comparison between ACE and ACE-WGN obtained from AVIRIS data: (
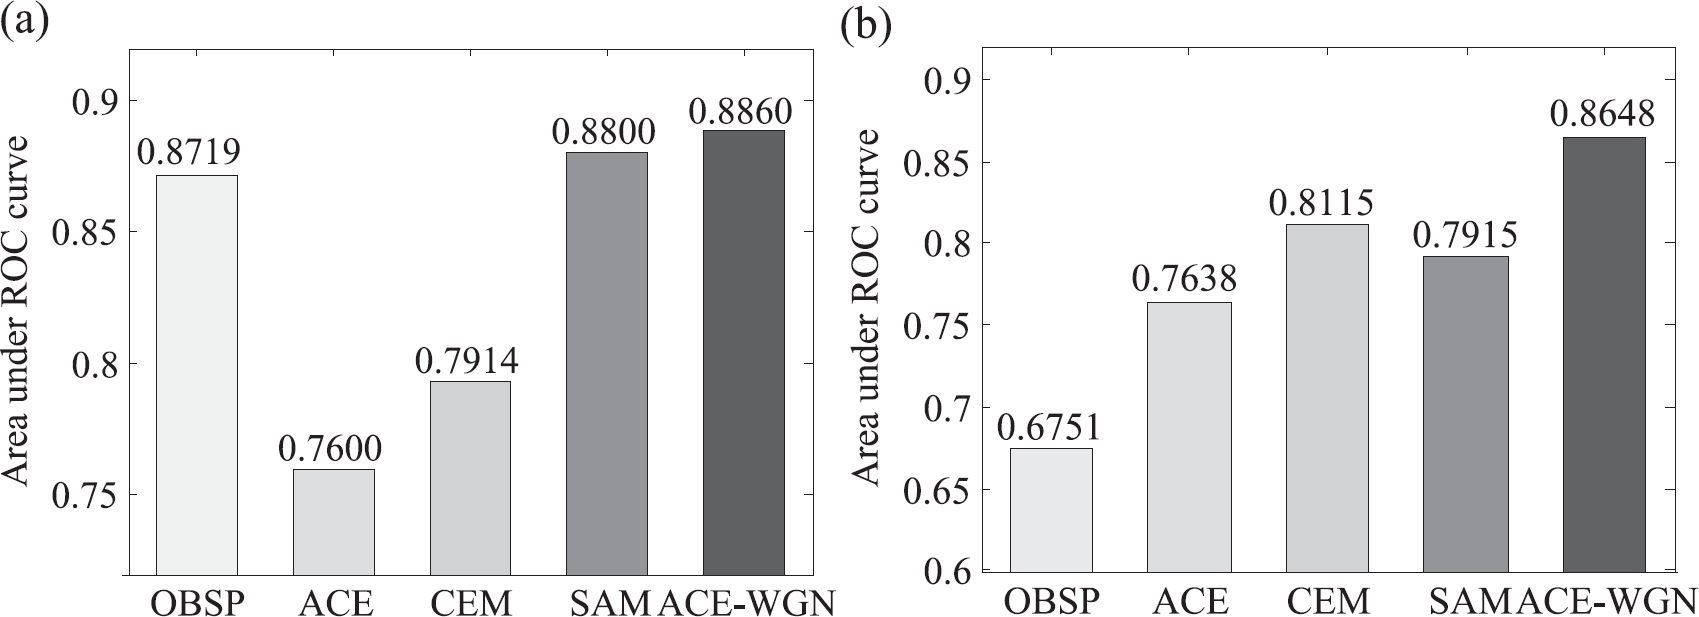
AUC value of ROC curve obtained from AVIRIS data: (
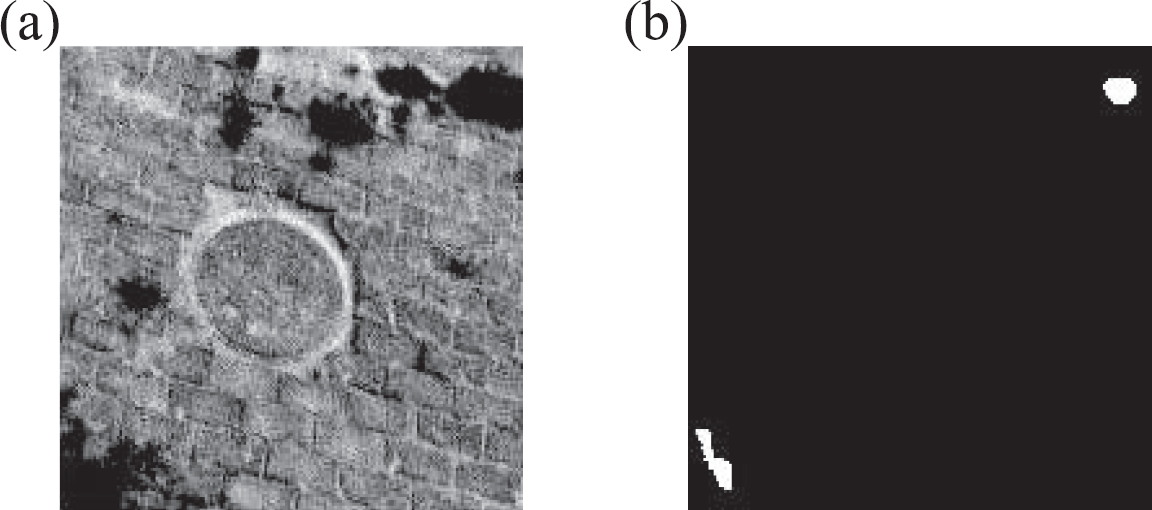
It can be seen from Fig. 4 that the ACE algorithm detected only one of the three planes. CEM detected one of the three planes and two partial planes. OBSP and SAM detected all three planes, but the background information is not suppressed enough, having a high false alarm rate, The ACE-WGN algorithm not only detected all of the three planes, but also got good background suppression having a low false alarm rate. Figure 5 shows that a row of planes were detected significantly by ACE. The detection results obtained by SAM and OBSP also have significant background interference information. Compared to the three algorithms, CEM detected more planes, and ACE-WGN detected the largest numbers of planes.
It can be seen from Figs. 6 and 7, in sub-image I, that ACE-WGN performs the best, followed by SAM and OBSP. The ACE performs poorly. In sub-image II, the ACE-WGN algorithm still leads to the best performance, and the CEM outperforms the other three algorithms. The OBSP yields a poor performance. Compared to the ACE, the target detection performance of ACE-WGN increases significantly, and the AUC rises by approximately 11%.
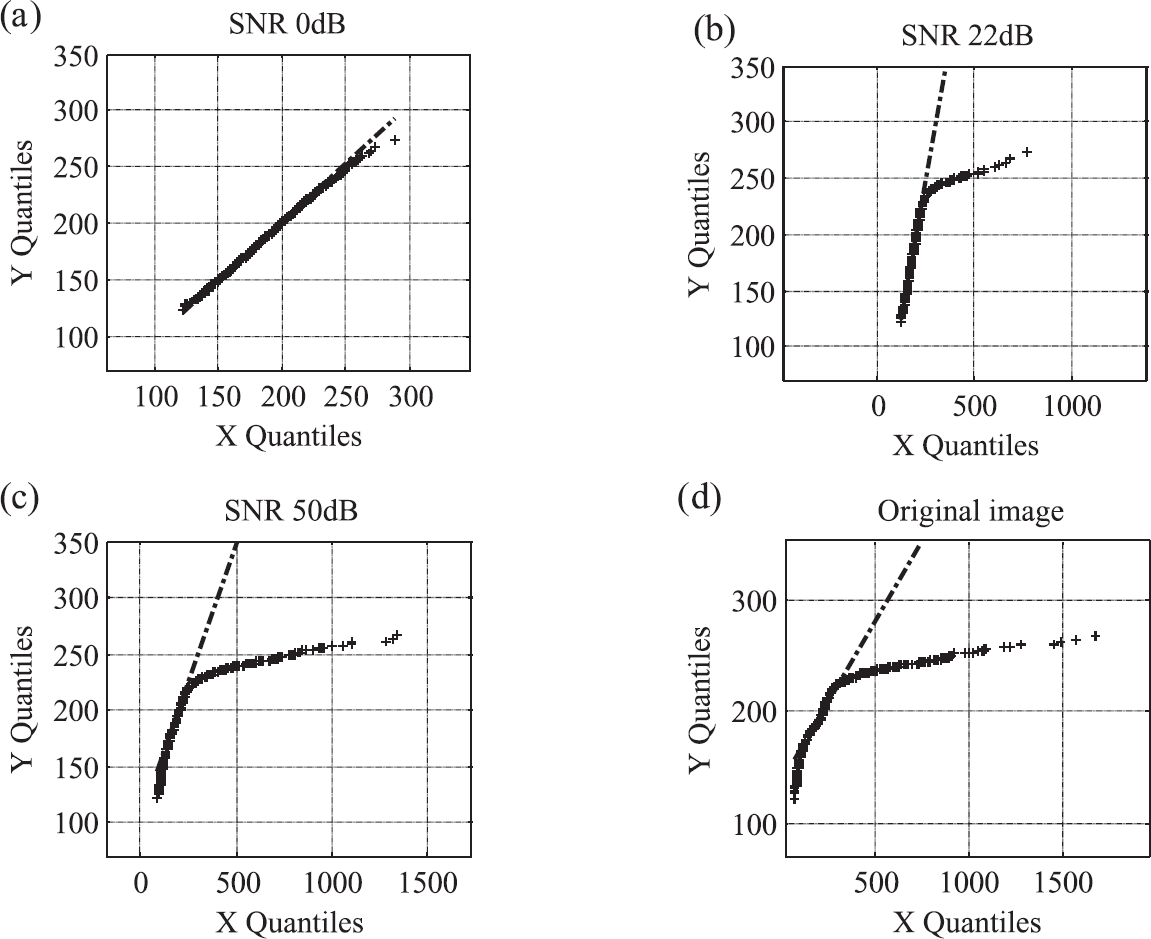
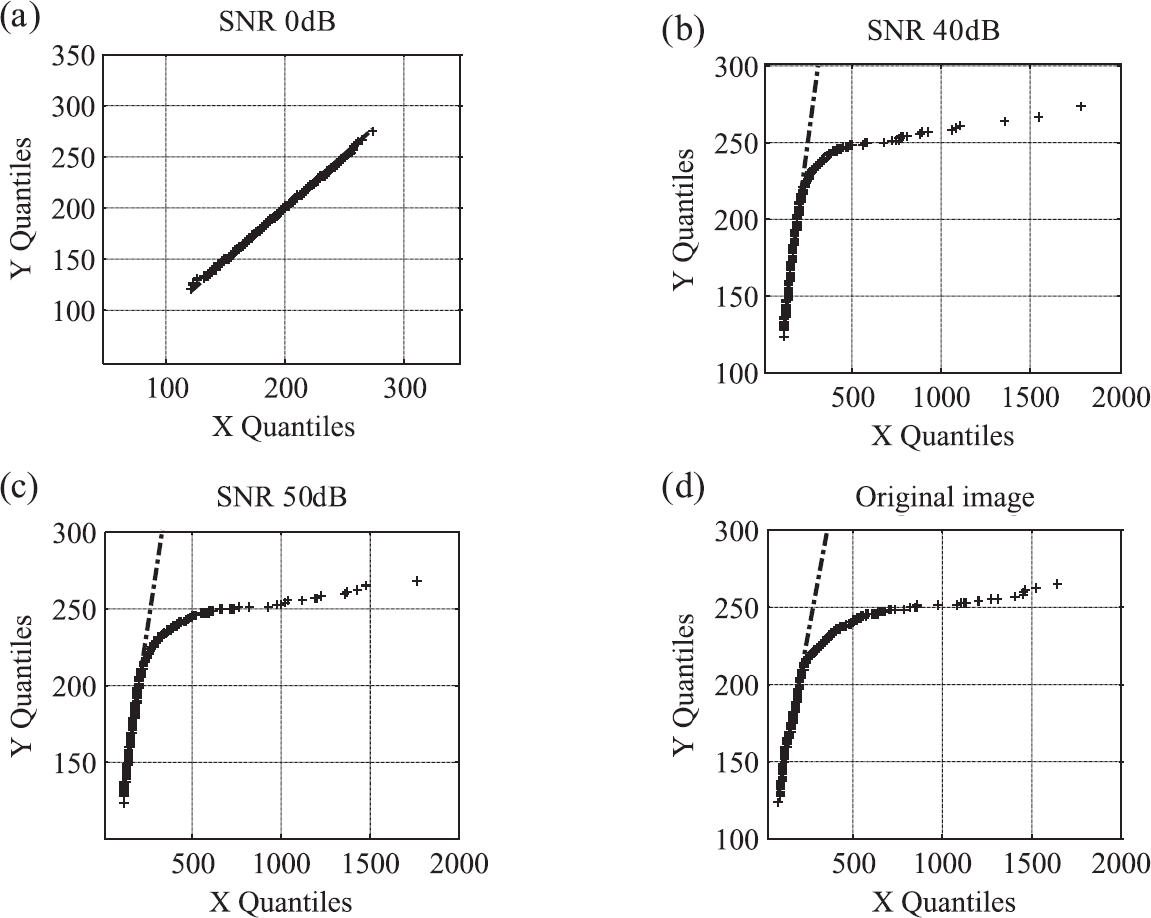
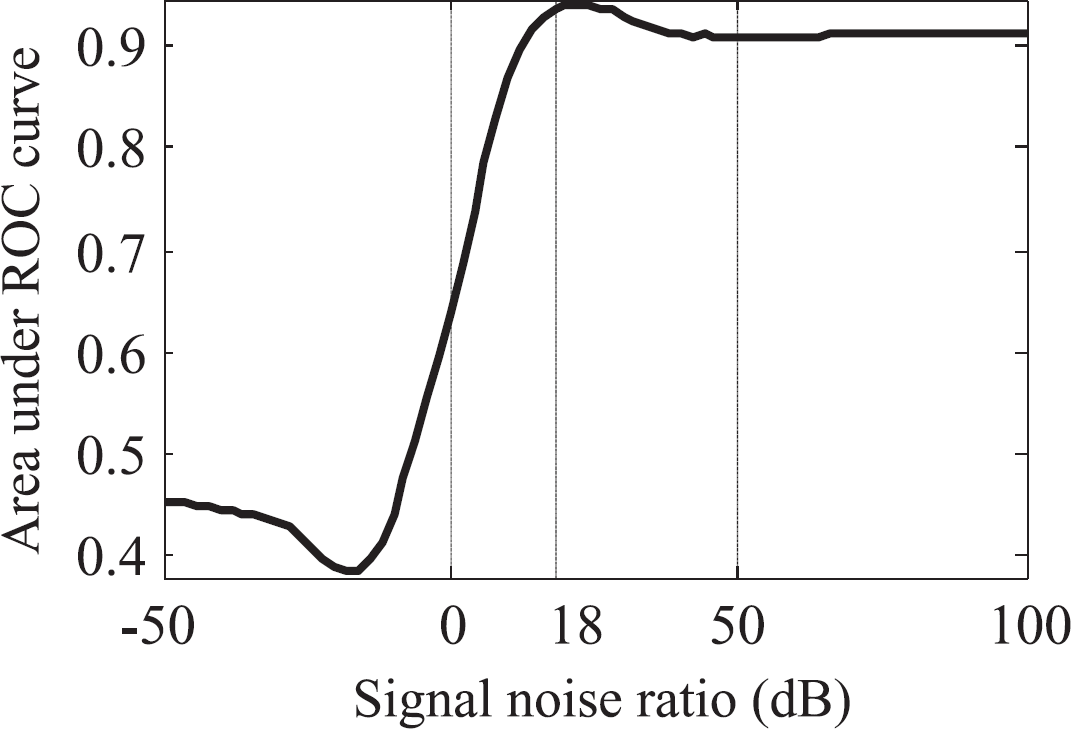
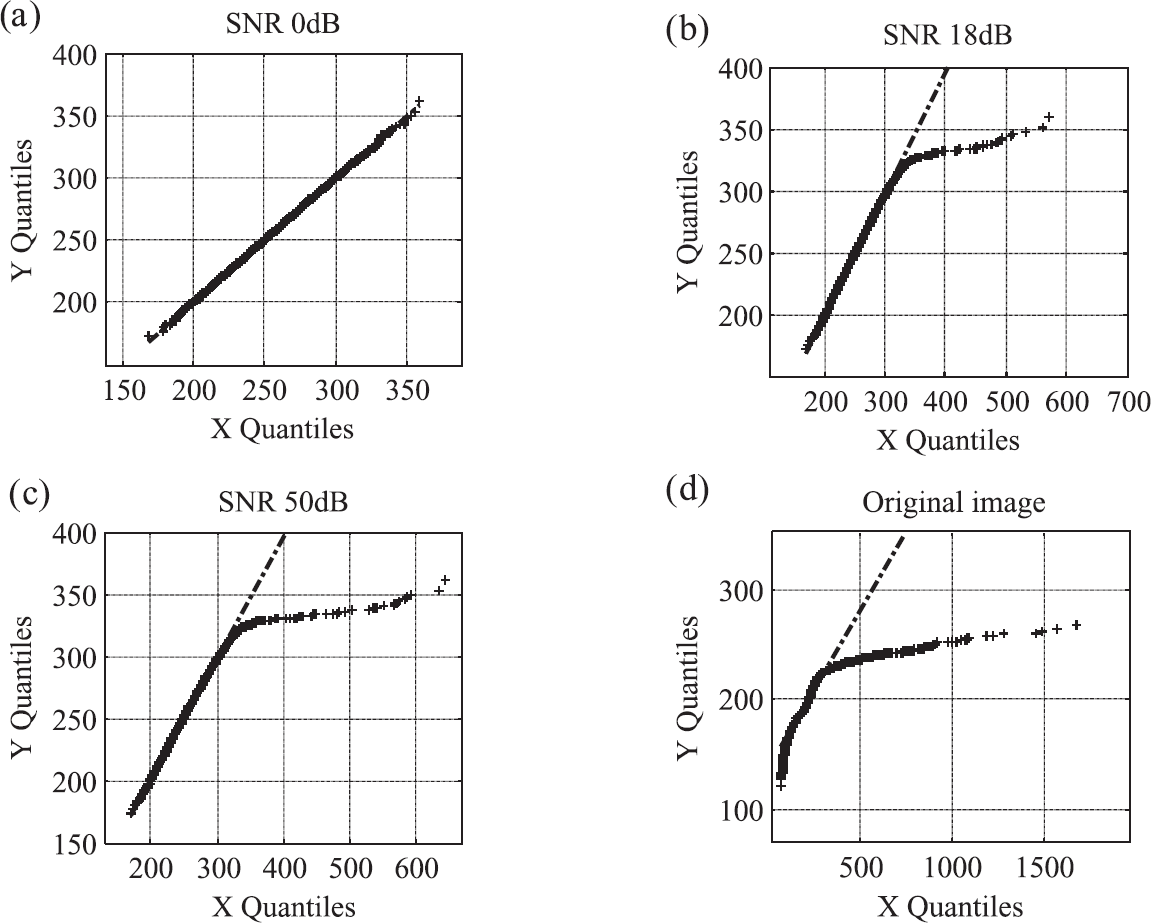
To further illustrate the effectiveness of the method, this paper compares the detection performance of the ACE algorithm applied in the images with different SNRs and using the AUC of the ROC curve to do the quantitative evaluation. The corresponding result is shown in Fig. 8. At the same time, a chi-square test is performed to test the multivariate normal characteristics of the image data. 11 Then a quantile–quantile (Q–Q) plot can be obtained. If the points in the Q–Q plot approximately lie on the line y = x, it suggests that the data are normally distributed. If the points follow a strongly nonlinear pattern, this suggests that the data are not distributed as a multivariate normal. Figures 9 and 10, respectively, show the Q-Q plot of the two sub-images at various SNRs.
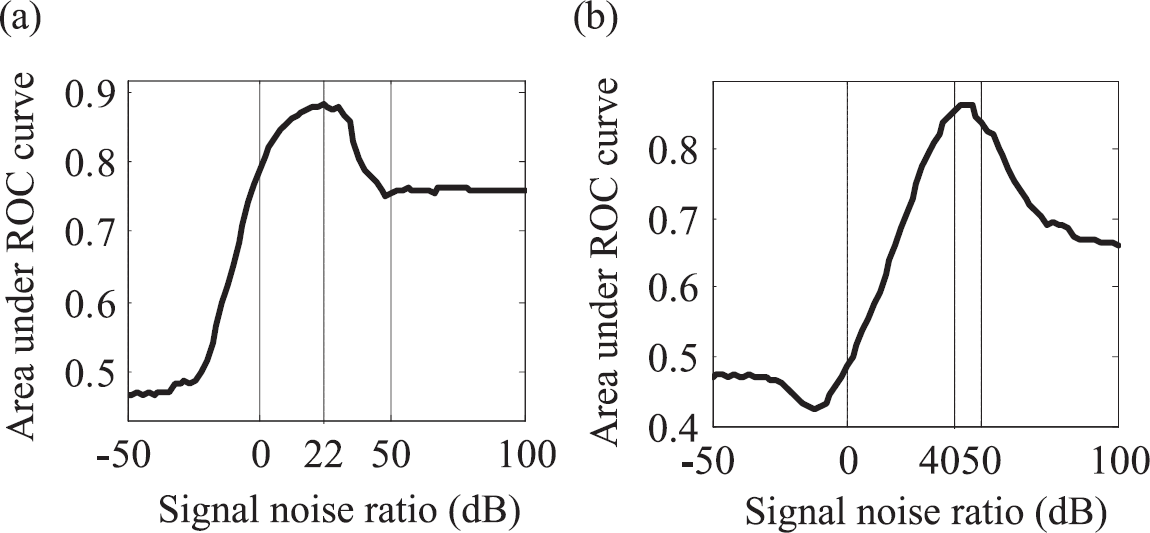
Varied curve of the AUC value along with the different SNR for AVIRIS data: (
Q–Q plot of sub-image I: (
Q–Q plot of sub-image II: (
Figure 8 shows that the AUC value increased first and then decreased as the SNR decreased. In other words, the detection performance of ACE was improved with increasing the amplitude of white Gaussian noise added to the original image but decreased sharply when the amplitude increased to a certain extent. This experimental result is consistent with our previous theoretical analysis. On the one hand, when white Gaussian noise with a certain amplitude is added to the image data, the experimental data will tend to be the normal distribution, and the covariance structure of the background is more similar under the two hypotheses. More importantly, the target and background after adding noise still have a certain separability. Thus, the detection performance of ACE can be significantly improved. On the other hand, when the amplitude of the added white Gaussian noise is too large, although the image data tend to be more normal, the target and background are inseparable. In this case, the useful signals are submerged in the noise. Accordingly, the target detection performance will decline sharply and even lose the ability to detect targets. As can be seen in Fig. 8 the proposed method can improve the detection performance in a maximum range in both sub-images. From Figs. 9 and 10, one can observe that the number of the points that do not lie on the line decrease with increasing the added noise amplitude and with the decrease of the SNR. When the SNR of the image is 0 dB, all points lie on the straight line. This indicates that adding white Gaussian noise can make the image data closer to the normal. This test result also validates the previous theoretical analysis. So the validity and adaptability of the proposed method is effectively verified.
Experimental image of MSHyperSIS data: (
Figure 12 shows the spectral angle curve of between
The curve of SAn for the SNR parameter setting in the MSHyperSIS data.
Figures 13a–13e show the detection results obtained from the MSHyperSIS image by using OBSP, ACE, CEM, SAM, and ACE-WGN. Figure 14 shows the ROC comparison figure of the MSHyperSIS image. Figure 15 shows the corresponding AUC value of the ROC curve.
Detection result obtained from the MSHyperSIS data by using (
ROC comparison between ACE and ACE-WGN obtained from the MSHyperSIS data.
AUC value of ROC curve obtained from the MSHyperSIS data.
As can be seen from Fig. 13a–e, when we adopt the OBSP to detect the target, the grass was regarded as the target to be detected, hence increasing the number of false alarms. CEM, SAM, and ACE-WGN show similar detection performance. From Figs. 14 and 15, one can observe that SAM and ACE-WGN show the better detection performance than other algorithms in terms of AUC. The AUC of ACE-WGN increased by approximately 3% compared with the ACE.
Next, the white Gaussian noise with different amplitude was sequentially added to the original image. Then we applied the ACE algorithm to these images and compared the detection performance using the AUC of the ROC curve; the corresponding result is shown in Fig. 16. Figure 17 is the Q-Q plot of the MSHyperSIS image at various SNRs.
Varied curve of the AUC value along with the different SNR for the MSHyperSIS data.
Q–Q plot of the MSHyperSIS image: (
From Fig. 16 we can see that the AUC value shows the same tendency as that of the AVIRIS data. The proposed method can also keep the detection performance in a maximum range increase in the MSHyper-SIS data. From Fig. 17, we can see that adding white Gaussian noise also makes the MSHyperSIS data closer to the normal. This experimental result further verifies the validity and adaptability of the proposed method.
CONCLUSION
This paper presents an improved ACE detection method based on white Gaussian noise (ACE-WGN), and we use experiments to demonstrate its detection effectiveness in terms of both qualitative and quantitative measures. When the image data do not satisfy the ACE assumption, adding white Gaussian noise to the original hyperspectral image can make the image data more in line with the theoretical assumptions, and the performance of target detection is greatly improved. The experimental results show that the classical hyper-spectral target detection algorithms, including ACE, CEM, SAM, and OBSP, showed a different target detection performance for different image data. The proposed ACE-WGN method, which can adaptively determine the optimal SNR parameters, has a stronger universality and outperforms the classical detection algorithms.
Footnotes
ACKNOWLEDGMENT
This work was supported by the National Natural Science Foundation of China under Project No. 41174093.