






Abstract
Attenuated total reflection Fourier transform infrared (FT-IR) spectroscopy was used to characterize 40 commercial tannins, including condensed and hydrolyzable chemical classes, provided as powder extracts from suppliers. Spectral data were processed to detect typical molecular vibrations of tannins bearing different chemical groups and of varying botanical origin (univariate qualitative analysis). The mid-infrared region between 4000 and 520 cm−1 was analyzed, with a particular emphasis on the vibrational modes in the fingerprint region (1800-520 cm−1), which provide detailed information about skeletal structures and specific substituents. The region 1800–1500 cm−1 contained signals due to hydrolyzable structures, while bands due to condensed tannins appeared at 1300–900 cm−1 and exhibited specific hydroxylation patterns useful to elucidate the structure of the flavonoid monomeric units. The spectra were investigated further using principal component analysis for discriminative purposes, to enhance the ability of infrared spectroscopy in the classification and quality control of commercial dried extracts and to enhance their industrial exploitation.
Keywords
INTRODUCTION
Tannins are naturally occurring bioactive compounds, produced as secondary metabolites by plants. According to their botanical origin, tannins can be divided into two main classes: (1) hydrolyzable tannins, further divided in ellagitannins (lactones of ellagic acid) and gallotannins (natural polymers of gallic acid esters), which are mainly derived from woody part of plants and fruits, and (2) condensed tannins, commonly known as proanthocyanidins, composed of flavanol monomeric units (catechins) containing galloyl moieties (prodelphinidins) or catechols (procyanidins), which are mainly derived from grape, stone fruits, cocoa, coffee, mimosa, and quebracho tree species.1,2 Figures 1 and 2 show the molecular structures of monomeric units and related polymers cited in this work.
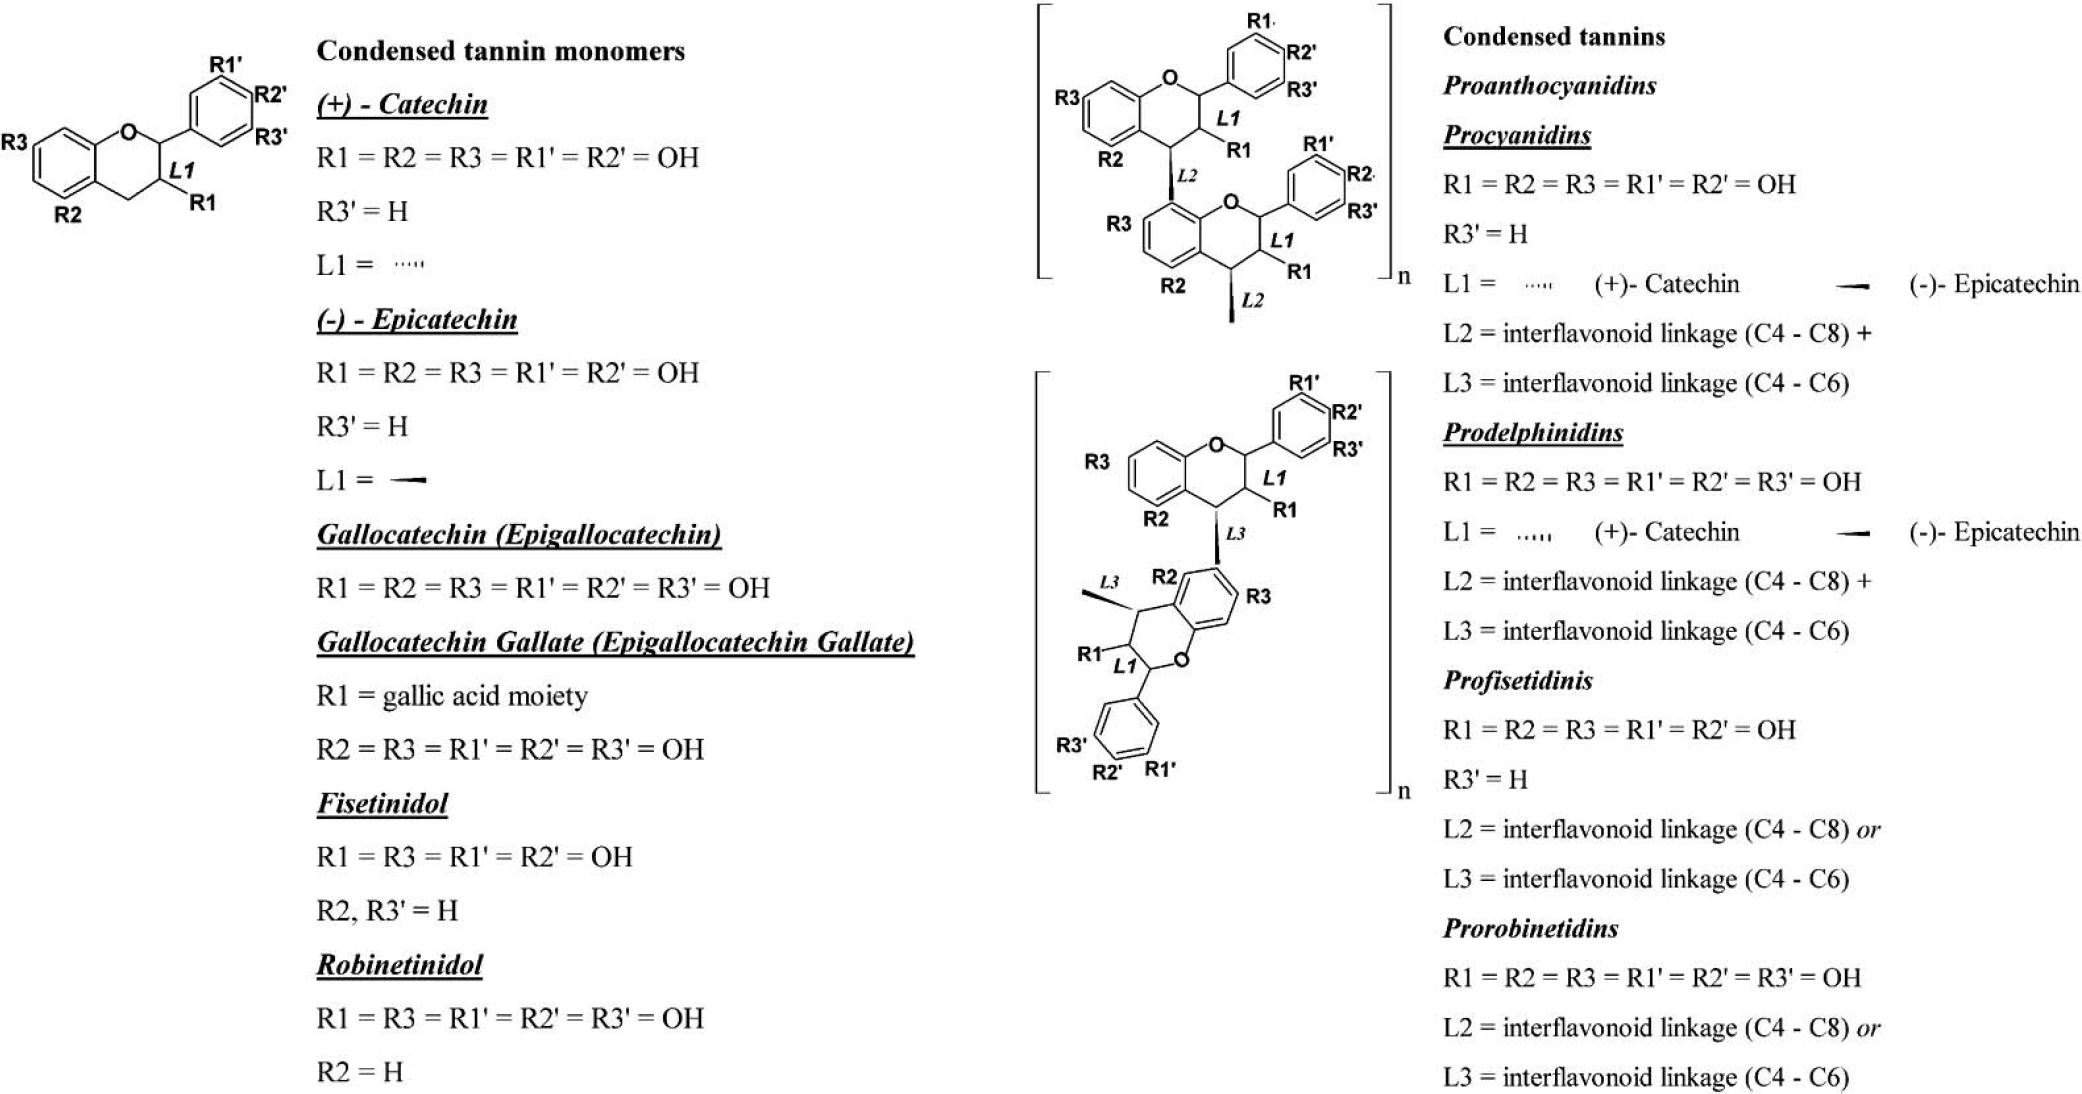
Condensed tannins and their monomeric units.
Tannins find application in different industry settings, including wine making, 3 water purification, 4 ink manufacture, leather and dye industries, 5 synthesis of metal nanoparticles, 6 and manufacture of adhesives, surface coatings7,8 and plastic resins. 9 In particular, tannins act as natural preservatives, and blending them with adhesives and plastics enhances the technological properties of innovative polymers doped with these natural extracts.10–12 For example, proanthocyanidins from the common grape (Vitis vinifera) were shown to be particularly effective in providing antioxidant activity while not affecting the mechanical properties of ethyl cellulose films. 13
In addition to their multiple functional properties, a further advantage of tannins is their large availability due to the widespread use of traditional agricultural practices and an increasing interest in the recovery of agro-wastes for the production of “green” derivatives.14,15 Despite the large availability of different commercial formulations, there is a need for (1) further information on their chemical composition and (2) rapid analytical techniques for effective discrimination between tannins derived from different botanical sources to further enhance and tailor industrial applications of tannins. Alternative analytical methods, both for hydrolyzable as well as for condensed tannins, such as matrix-assisted laser desorption-ionization time-of-flight mass spectrometer16–19 (MALDI-TOF), 13C nuclear magnetic resonance 20 (NMR), and 31P NMR21,22 are widely used to get further chemical information on the structure of tannins.
In this context, attenuated total reflectance (ATR) Fourier transform infrared (FT-IR) spectroscopy, being a simple and sensitive technique, has been widely applied in the field of quality control in industry. The versatility of this technique is also improved by its ability to operate with different matrices (both solid and liquid) without the need for sample pretreatments. 23 Furthermore, ATR infrared (IR) spectroscopy allows analysis of powders directly over the internal reflection element, without dilution in an IR-transparent medium (KBr, Nujol, etc.). The product as provided by suppliers can be directly analyzed in a few seconds.
The data elaboration of a single sample in molecular spectroscopy can be considered as a univariate approach to the study of chemical differences between tannins belonging to different botanical species. This is expensive in terms of time compared with fast and efficient methods required for industrial processes. On the other hand, FT-IR analysis is very effective for discriminative purposes when coupled with multivariate chemometric approaches.24,25
The aim of this work is to identify IR spectral patterns that typify representative commercial tannins used in industrial applications (univariate approach) and to evaluate the performance of classification algorithms across the selected samples. The effectiveness of spectral and statistical analyses provides a valid contribution in evaluating the authenticity and the degree of purity of these compounds in a fast, reliable, and nondestructive way.
EXPERIMENTAL
Summary of commercial tannins classified according with chemical and botanical origin.
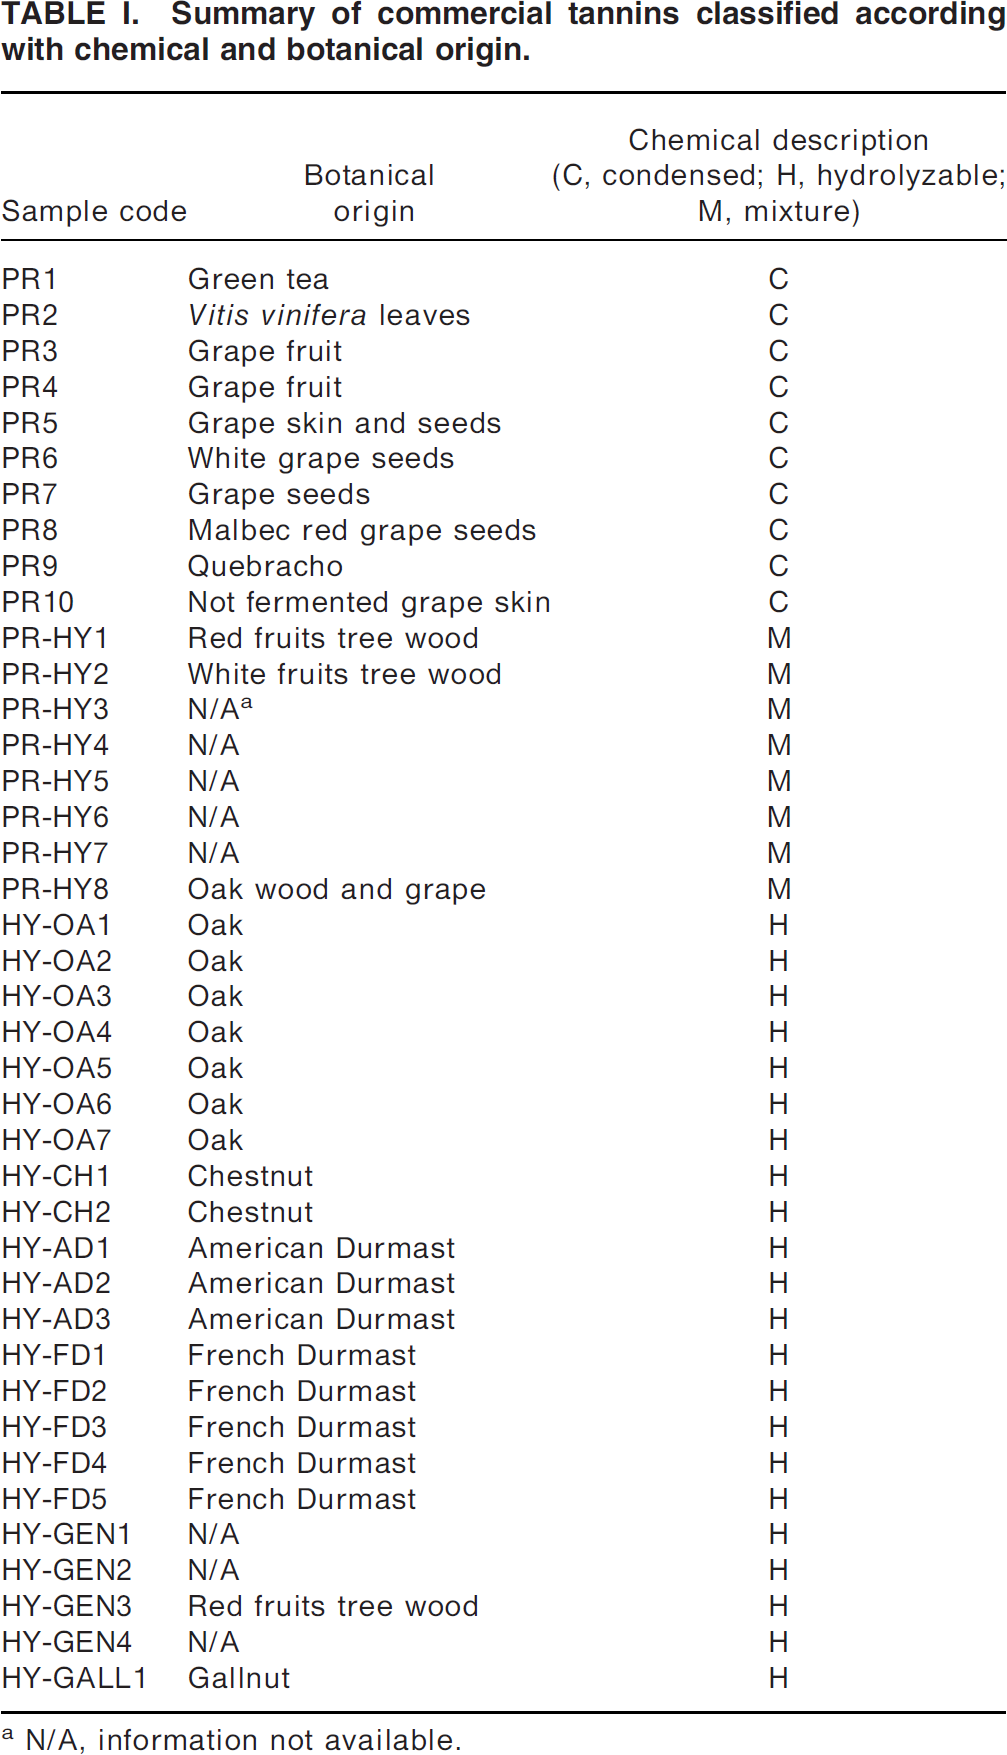
N/A, information not available.
The averaged spectra were subjected to multivariate analysis using the The Unscrambler 9.7 software (Camo Software AS). The different spectral regions were tested for chemometric elaboration, and ultimately the whole spectral region was found to be the best option to maximize the information.
The validation method selected for PCA was the leverage correction on a full model size. The cluster analysis was performed using the correlation algorithm over the vector-normalized spectra. According with the similarity between data, the optimal number of clusters was six, with a satisfactory sum of distances value of 0.24.
RESULTS AND DISCUSSION
Figure 3 shows the spectral profiles in the MIR region for the basic monomeric unit of tannins: (+)-catechin, gallic acid, and ellagic acid. Some differences due to the typical structure of these compounds were found.
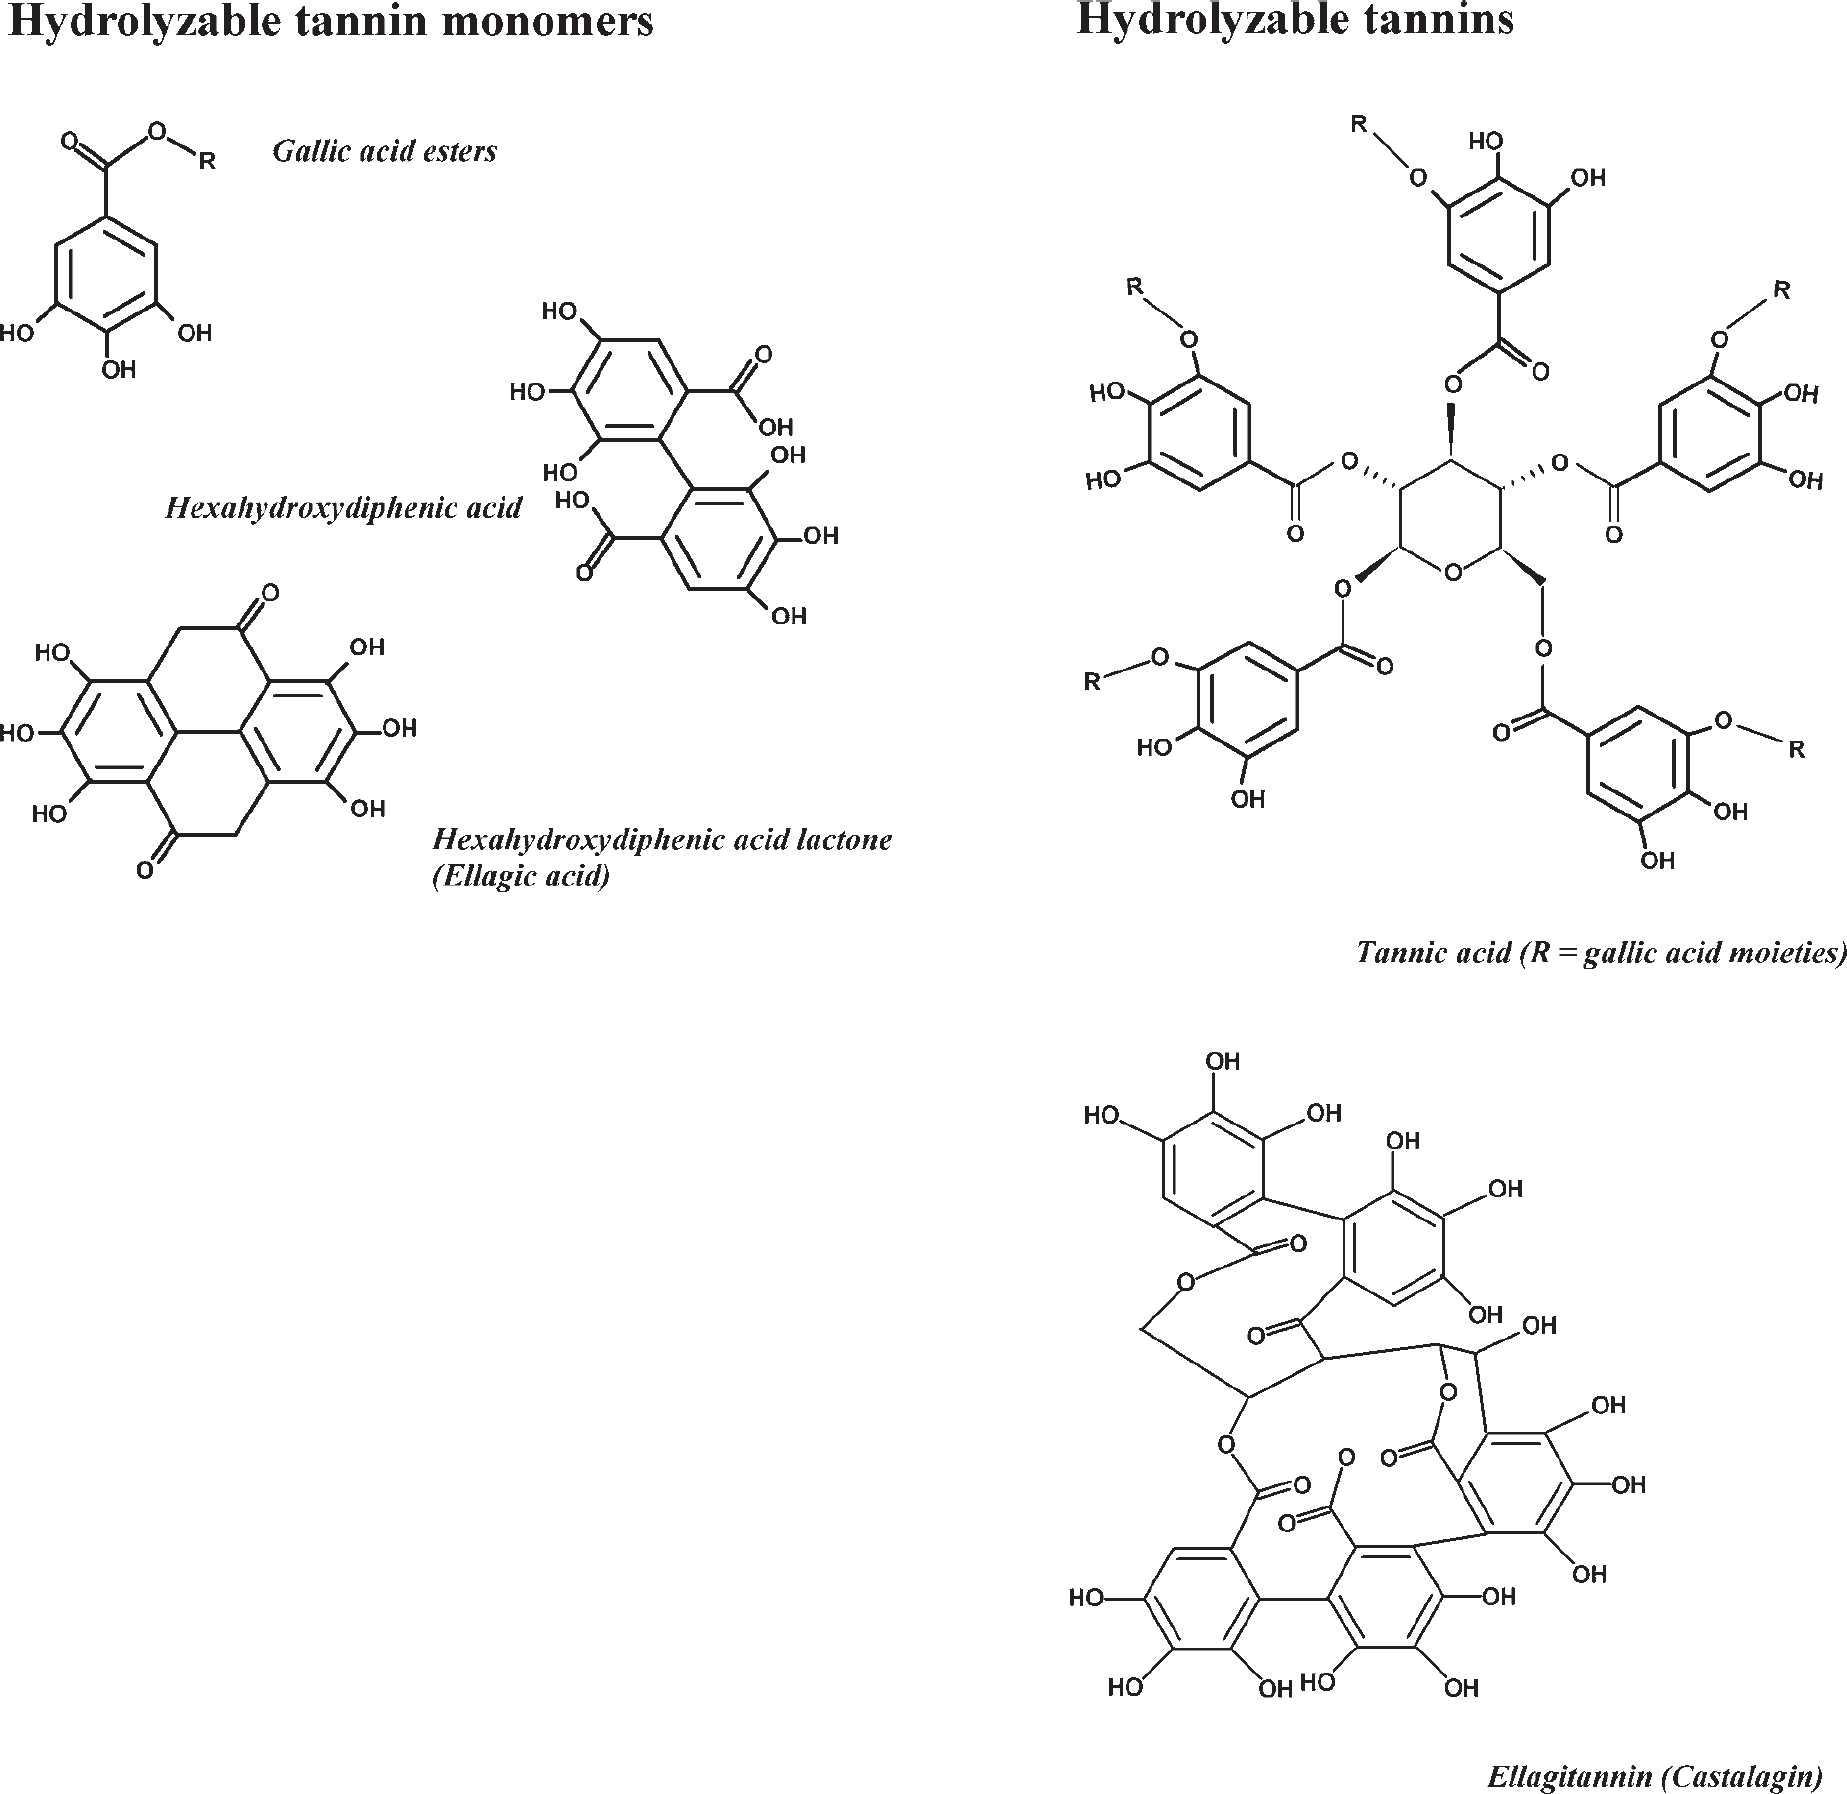
Hydrolyzable tannins and their monomeric units.
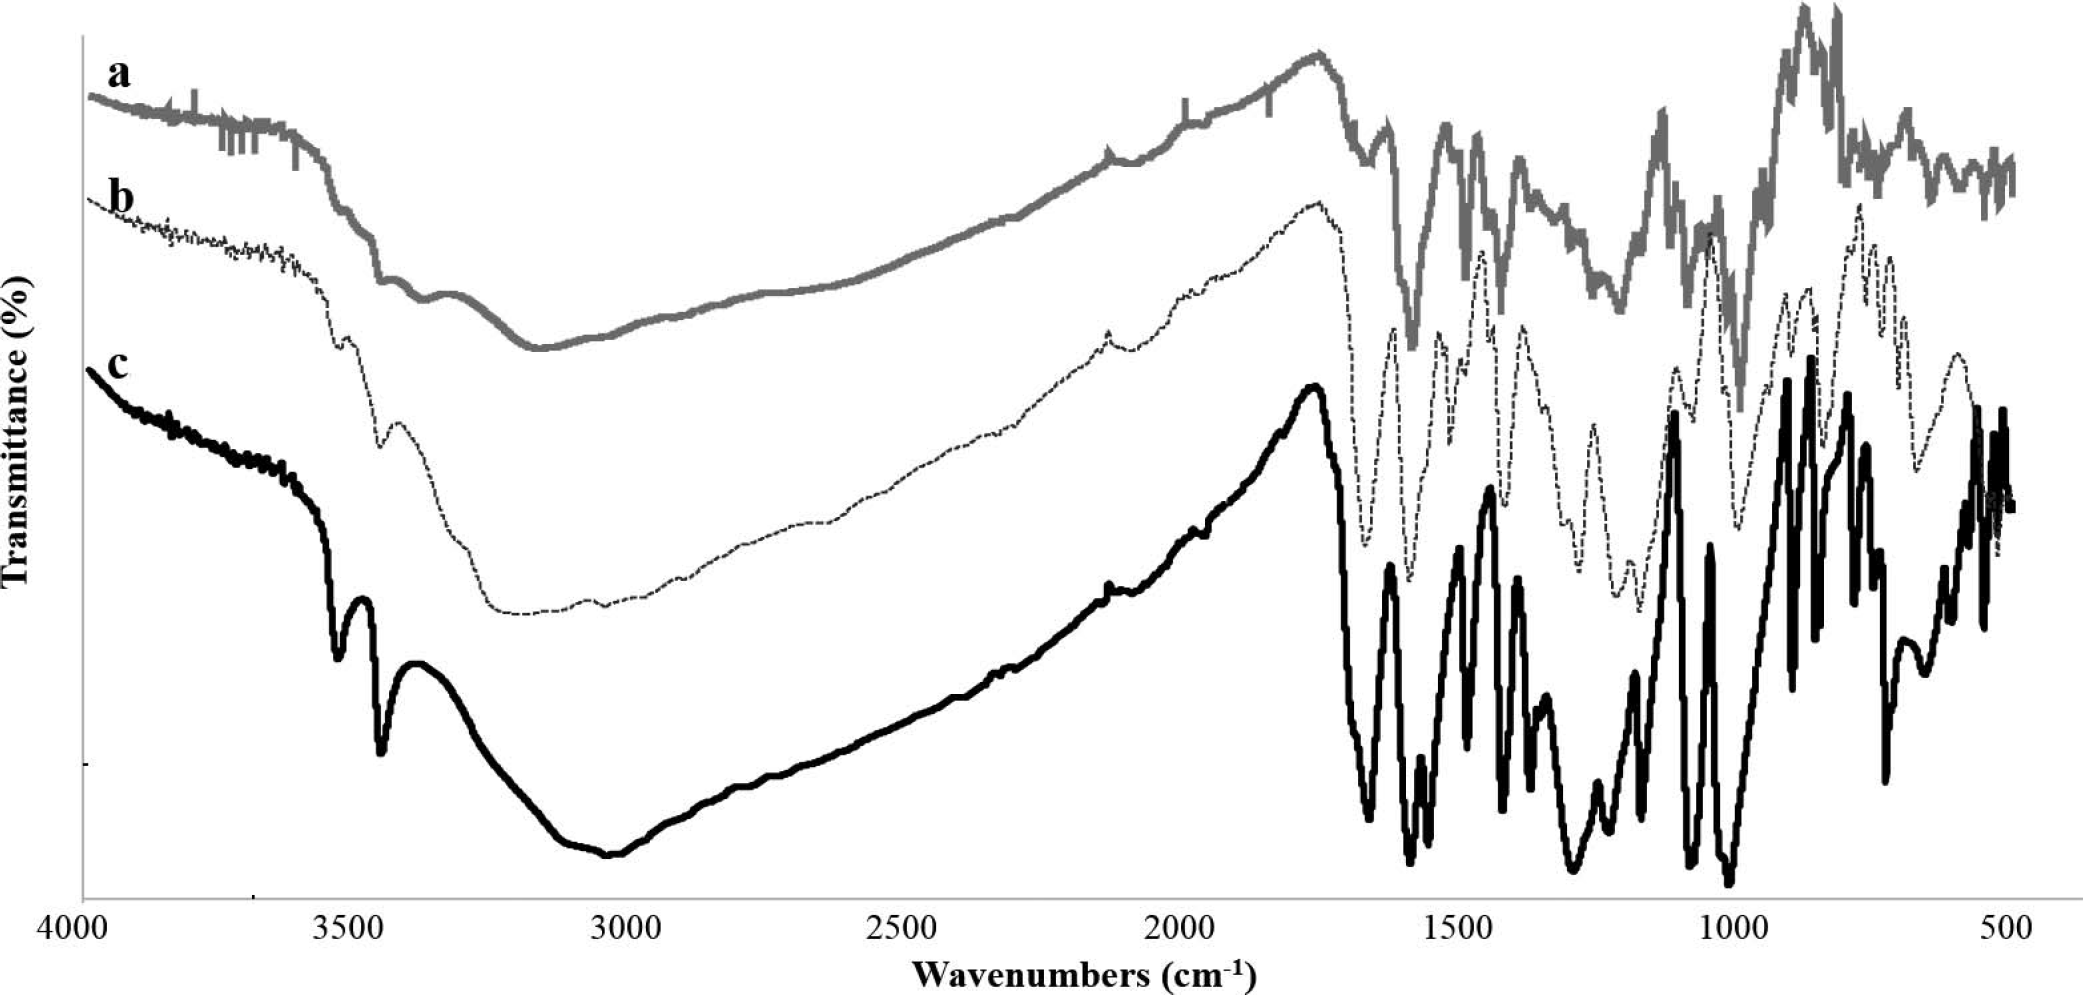
ATR FT-IR spectra of the most common monomeric units of tannins, (a) (+)-catechin; (b) gallic acid; (c) ellagic acid.
The vibrational spectrum of catechin-based tannins showed a complex envelope of strong signals in the region 1250–900 cm−1, where band occurrence and intensity is sensitive to the number and position of -OH aromatic substituents (Fig. 3a). Additional information on galloyl moieties and galloylation of monomers could be derived especially from this spectral region. In particular, flavan-3-ol-based structures have a strong peak around 1610–1620 cm−1 as a doublet, due to in-plane bending of the benzene ring for the catechol moieties (ring B) and to the same combination in the resorcinol moieties.26,27 The relative intensity of this spectral feature is sensitive to elongation of the C4-C8 or C4-C6 interflavonoid linkages, so that it could be used as an index of the degree of polymerization. 28
The MIR spectra of gallic acid (Fig. 3b) and ellagic acid (Fig. 3c) showed some similarities, because they belong to the same class of compounds. At the same time, there were some slight differences that can be used to discriminate the subclasses, as follows. A diagnostic region for hydrolyzable tannins is within 1750–1680 cm−1, where the stretching of the C=0 group of the carbonyl moiety occurs, giving a strong peak.29,30 This band is usually quite weak in condensed tannins, except if oxidation and rearrangement of OH group occurs as a consequence of extraction processes with proanthocyanidins. 31 A specific peak around 1717 cm−1 was assigned to the interaction of condensed tannins with some additives, usually cellulose. 32
A strong peak was present at around 1318 cm−1 for the spectrum related to ellagic acid (Fig. 3c), and there is a strong doublet for gallic acid in the same spectral region. This signal could be considered a fingerprint band of the phenolic ring, and several authors have observed that it is a typical feature for hydrolyzable tannins.33,34 This finding is also highlighted in Fig. 4, where the spectra of a mixture of ellagitannins (Fig. 4c), a gallnut extract (Fig. 4b), and a proanthocyanidin extract from grape seed (Fig. 4a) are compared. By contrast, there are few signals of interest in this region for the spectrum of flavonoids, with only weak to very weak bands for catechin (Fig. 3a).
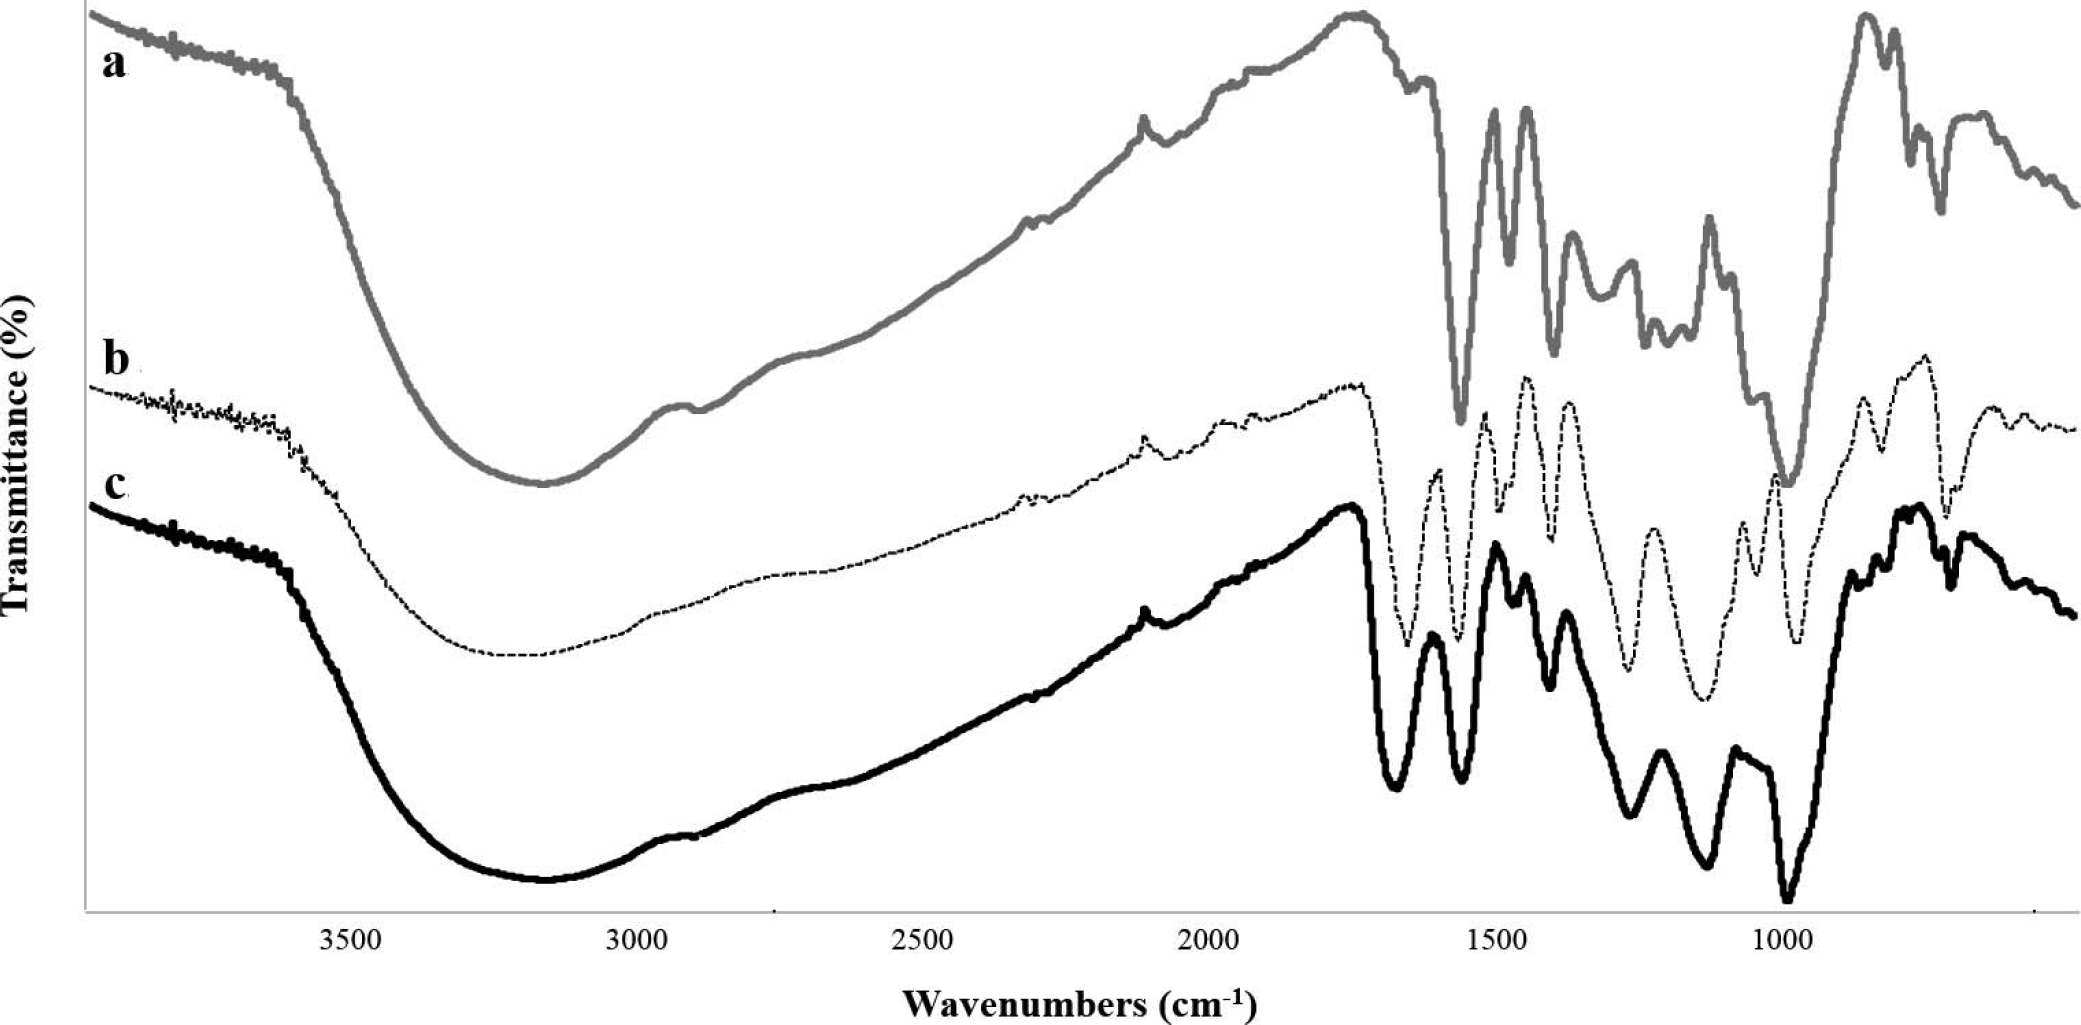
ATR FT-IR spectra of three industrial tannins, (a) Proanthocyanidins from grape; (b) gallnut extract; (c) ellagitannins from red fruit tree wood.
The region 1250–900 cm−1 showed diagnostic bands related to the hydroxylation patterns of aromatic rings present in tannins; the analysis of these spectral features confirms the information reported in the literature. A strong band around 1037 cm−1 is diagnostic for the chestnut tannin extracts (C–O stretch of phenolic O–H groups) and is often present in oak tannins at a strong intensity. The 1145–1150 cm−1 band is common to hydrolyzable compounds and is attributable to a combination of C–O stretching and -OH deformation motions of the carboxyl group. Quebracho tannin exhibits typical bands at 1160, 1114, and 1032 cm−1, which allows it to be distinguished from the resorcinol group in grape tannins. Here the change in the monomeric unit, single OH substituent on the A ring in quebracho, produces a slight change in the hydroxylation pattern.35,36 Condensed tannins also contain an oxygenated heterocyclic ring (ring C) that produces characteristic vibrations: a peak around 1280 cm−1 due to the asymmetric stretching vibration of the pyran ring. When this signal is coupled with strong bands at 1162-1155, 1116-1110, 976, and 844–842 cm−1 the extract can be unambiguously assigned to the condensed tannins group.35,36
The univariate detection of diagnostic spectral features for industrial extracts was followed by a multivariate analysis of vibrational frequencies in the mid-infrared region. The PC1 component shows the highest explanation of differences between the chemical composition of the extract (78%), followed by PC2 (10%), and so these two variables were taken into account for clustering. Figure 5 shows the PCA-CA diagram with the recognition of the six obtained clusters. The first cluster contained six samples, including all tannins derived from American oak, together with one French oak extract and two hydrolyzable tannins derived from oak. The commercial denomination of European oak concerns two botanical species, Quercus petraea and Quercus robur, whereas American oak generally refers to the white oak (Quercus ssp. and Quercus alba). It is noticeable that from the botanical point of view, American and European oaks exhibit different MIR properties, which reflects their technological applications. American oak is richer in aromatic precursors such as the cis-trans isomers of 13-methyl-γ-octalactone, but the quantity of extractable polyphenols is very low compared with the European variety. Furthermore, the European variety Quercus robur is particularly high in ellagitannin content, and the quality could be considered higher according with the specific technological application. 37 From this perspective, the ability of the multivariate model to discriminate the two species could be useful to avoid adulteration or dilution in the extracts.
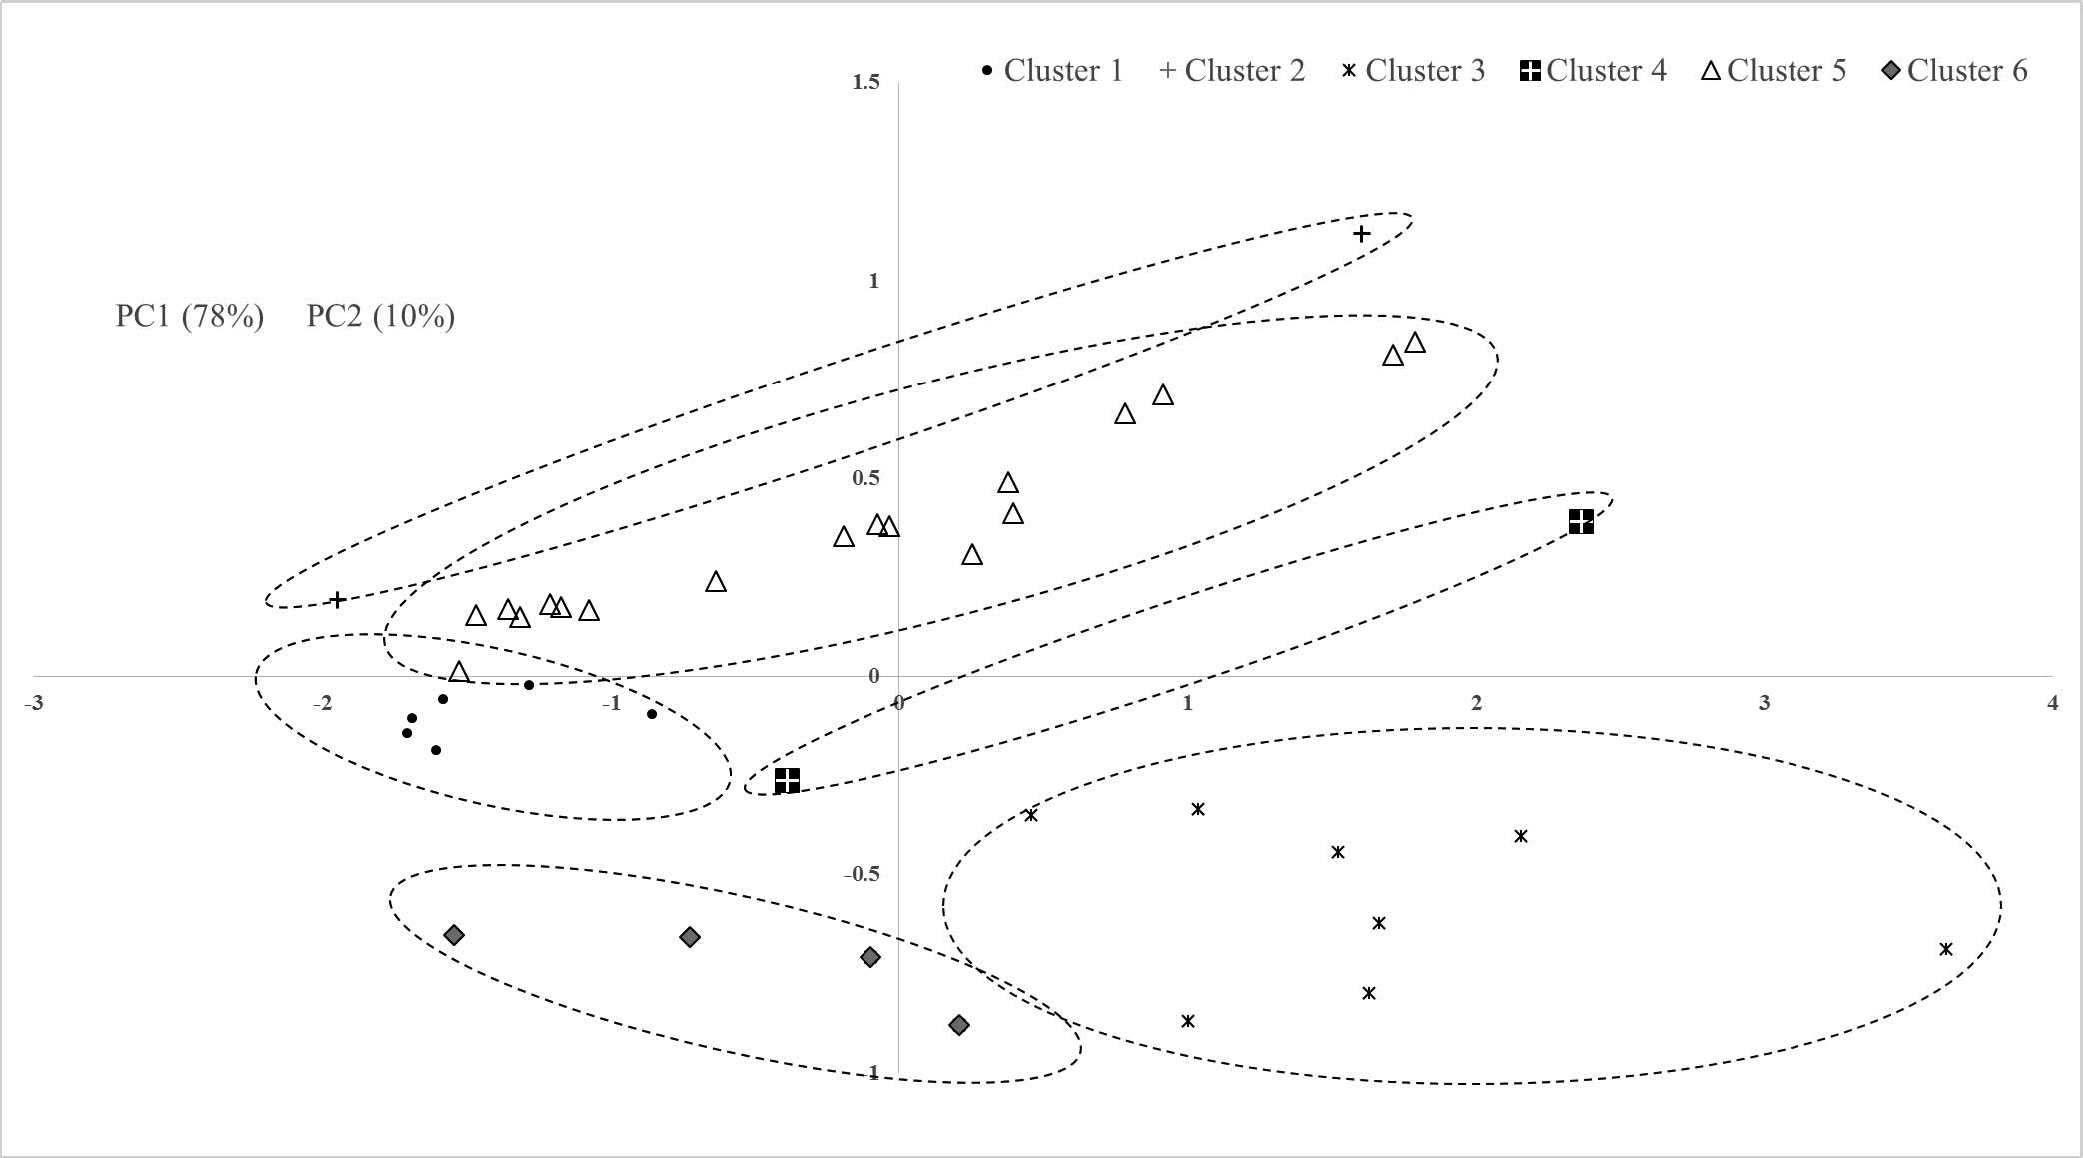
PC1/PC2 score plot using PCA analysis and sample grouping based on cluster analysis.
The second cluster (Fig. 5) grouped the gallnut tannins coupled with a hydrolyzable tannin of undeclared origin (sample HY-GEN2), a vegetable extract with high antioxidant activity, most probably with gallic acid monomers arranged around a simple sugar (tannic acid–like structure). Figure 6 shows how the ATR FT-IR spectra of these two extracts overlapped in the fingertip region (1820-520 cm−1), confirming a perfect match for the two spectral profiles.
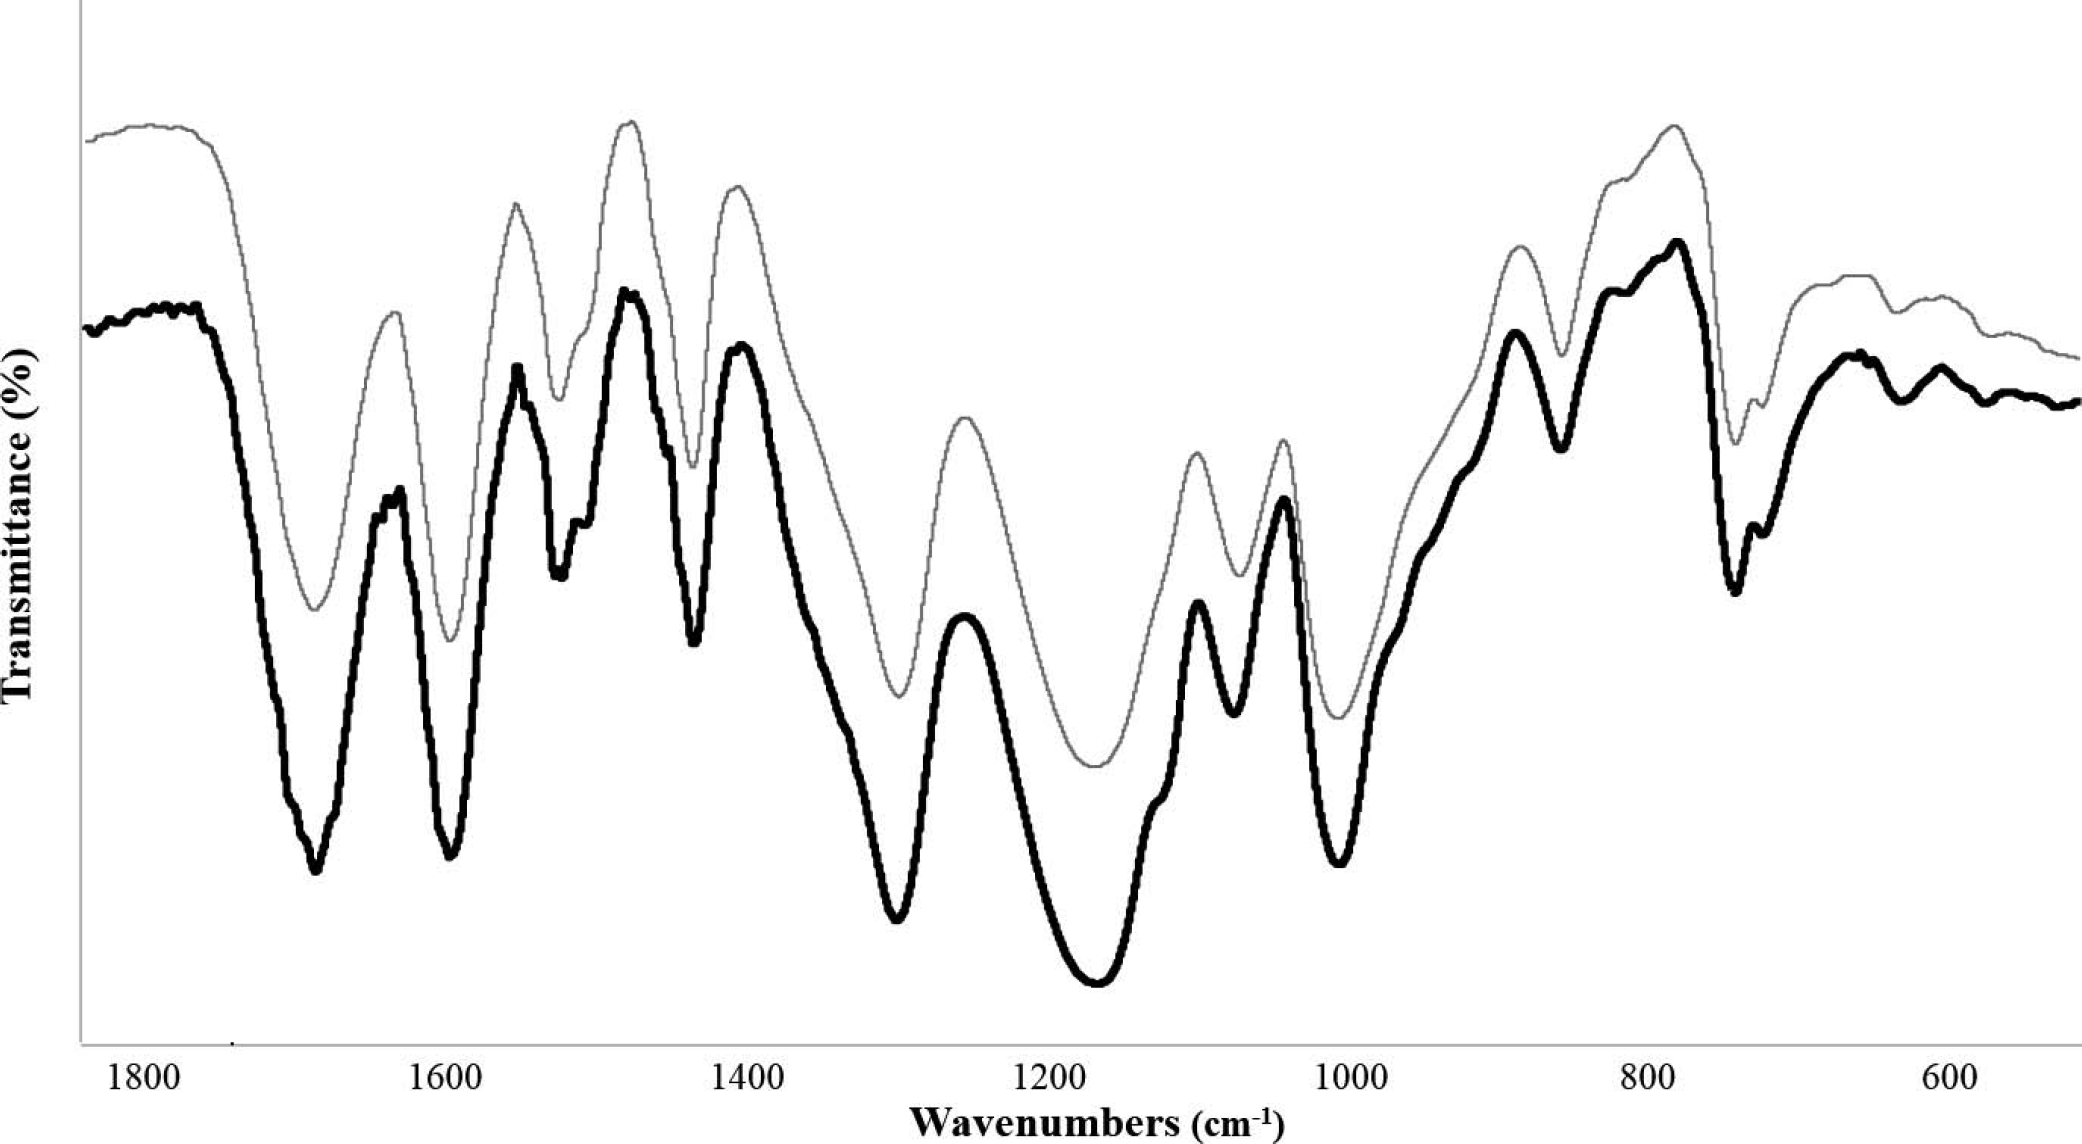
Comparison between gallnut extract (gray line) and sample HY-GEN2, a hydrolyzable tannin (black line).
The CA approach was particularly effective for the discrimination of condensed tannins. All procyanidins derived from Vitis vinifera (fruit pulp, seed, skin) were grouped in cluster 3, together with a sample described as a mixture of ellagic and catechin tannins (Fig. 5), of unknown purity and ratio of the two components. The robustness of the CA model was further confirmed by its ability to distinguish in a group, namely, cluster 6, the condensed tannins derived from exotic botanical sources, such as green tea (PR1) and quebracho (PR9). It is well known that the extent of polymerization and spatial arrangement of condensed tannins are strongly sensitive to the botanical source. 38 The most common condensed tannins are procyanidins and prodelphinidins from Vitis vinifera, and profisetinidins and prorobinetinidins for quebracho. The content and relative ratios of these compounds provide useful information about the botanical origin of commercial tannins. Procyanidins are found in grape skins and seeds, whereas prodelphinidins are present in grape skins only. 39 In particular, the fisetinidol and robinetinidol subunits of quebracho polymers differ from grape monomers, since they are missing a phenolic group in the C5 position of the resorcinol ring. 40
Quebracho tannin is mainly composed of profisetinidin, a linear polymer resulting from a combination of catechins and gallocatechins, namely, a proanthocyanidin blended with hydrolyzable tannins, as observed through MALDI-TOF analyses. 41 Therefore, quebracho also contains some gallic acid, which could explain the inclusion in cluster 6 of the samples PR-HY1 and PR-HY7.
Grape tannins are random polymers mainly composed of procyanidins and galloylated procyanidins, having an average degree of polymerization of up to five for seeds and higher for skin extracts.42,43 Polymerization usually follows a linear C4-8 sequence (interflavonoid linkage), but branching of monomeric units through the lateral moieties (usually C4-6) can occur. 44
Green tea is mainly composed of monomeric units of epigallocatechin gallate (EGCG), followed by epicatechin-3-gallate, epigallocatechin, epicatechin, and catechin.45,46 Based on the chemical structures, the grouping of tea tannins with quebracho tannins was unexpected and supports the idea that gallic acid, galloyl, and gallate structures were present in both quebracho and tea. The spectral similarities between the quebracho and the green tea tannins over the region 1300–1000 cm−1 could then be related to the hydroxylation patterns of aromatic molecules. At the same time, the absence of tannic acidlike structures in green teas makes the above hypothesis somewhat controversial. 46
Cluster 4 included two odd tannins: a catechin-based extract from Vitis vinifera leaves coupled with an ellagitannin from toasted oak (Fig. 5). Since there is no clear link between clustering and available information, the two tannins of cluster 4 should presently be considered as outliers.
Cluster 5 was the most abundant, including eight ellagitannins, three French oak tannins (HY-FD2, 3, 4), two chestnut tannins (HY-CH1 and 2), and six mixtures of condensed and hydrolyzable tannins. Grouping of these samples indicates that hydrolyzable are the prominent tannins.
CONCLUSIONS
Forty commercial powder tannins were analyzed with ATR FT-IR spectroscopy, and the resulting MIR spectra provided valuable chemical information on tannin composition. This analysis was effective as a univariate approach, with the detection of typical vibrational bands related to specific molecular features, and multivariate analysis, for classification purposes. The univariate approach focused mainly on the fingertip region (1800-520 cm−1), where diagnostic peaks were identified for discriminative purposes. The spectral region 1750–1680 cm−1 contains strong bands that are unambiguously attributable to stretching vibrations of carbonyl moieties that are typical of hydrolyzable tannins. Condensed tannins do not show significant bands in this region, while they exhibit a typical doublet around 1610–1620 cm−1, related to catechol and resorcinol moieties. The region around 1250 to 900 cm−1 provides information about hydroxylation patterns, so that it could be used both to discriminate between hydrolyzable and condensed tannins and to obtain further discrimination between catechins and gallate catechins. principal component and clustering analyses were found to be effective tools for the classification of tannins based on chemical and botanical sources, especially in the case of proanthocyanidins from Vitis vinifera, profisetinidin from quebracho, and ellagitannins from white oak. The minor concerns about the nature of green tea tannins and the presence of a few outliers that were not properly described by the model would require additional samples of known origin to further improve this preliminary dataset.
Footnotes
ACKNOWLEDGMENTS
We gratefully acknowledge Enologica Vason, HTS enologia, Laffort and AEB group for providing tannins for this research. Authors Arianna Ricci, Giuseppina Parpinello, and Andrea Versari also acknowledge the School of Chemical Sciences of the University of Auckland, where they were guest scientists, and Arianna Ricci for the support of a Ph.D. fellowship from University of Bologna.