
Abstract
Therapy-induced senescence (TIS) is a component of breast cancer (BC) treatment. Tetraspanins have emerging roles in cancer biology. Tetraspanin 4 (TSPAN4 [NAG2]) has been implicated in tumor progression, however, its association with TIS remains unexplored. We investigated TSPAN4 expression in BC samples from patients who received neoadjuvant chemotherapy (NAC) and its association with TIS markers. Thirty-eight paired pre- and post-NAC BC samples were analyzed using immunohistochemistry (IHC) staining for TSPAN4 and TIS-associated biomarkers (Lamin B1 and Ki67). Pairwise analysis of senescence-related gene expression (LMNB1, MKI67, CDKN1A, ATM, IGFBP7, MMP2, CXCL14, and CCL5) was performed in an independent geneset of 68 paired pre- and post-NAC BC patient samples. NAC reduced the expression of senescence-associated proliferation markers Ki67 and Lamin B1 in BC samples, with 84% and 76% of patients showing decreased expression, respectively (p<0.001). Senescence-associated gene expression analysis revealed consistent upregulation of CDKN1A, ATM, IGFBP7, MMP2, CXCL14, and CCL5 post-NAC (p<0.001), while LMNB1 and MKI67 were significantly downregulated (p<0.0001 and p=0.007, respectively). A subset (15/38; 39%) of samples demonstrated upregulation of the TSPAN4 expression post-NAC (p<0.01). NAG2 was upregulated in 54/68 patients post-NAC (p<0.00001) and its expression correlated positively with senescence-associated genes. An association between TSPAN4 and TIS post-NAC was identified.
Keywords
Background
Cellular senescence is a dynamic process that culminates into durable cessation of cell proliferation. 1 Senescent cells exhibit distinct phenotypic and morphological characteristics such as enlarged, flattened morphology and upregulation of senescence-associated β-galactosidase (SA-β-gal). 2 In addition, they display signs of DNA damage, including telomere-associated foci (TAFs) and actively secrete a variety of proinflammatory cytokines, chemokines, growth factors, and proteases, which are key components of the Senescence-Associated Secretory Phenotype (SASP). 3 Cellular senescence can be triggered by various internal or external stressors, including DNA-damaging events precipitated by the exposure to chemotherapeutic agents and radiation, often named therapy-induced senescence (TIS).4,5 Through both cell-intrinsic and extrinsic mechanisms, senescence plays a role in cancer development, 6 as TIS is now identified as a cardinal component of tumor biology and a critical feature of therapeutic responses in various cancers. 7 However, the exact role of TIS in dictating the overall response to treatment remains undefined. Moreover, the development of relevant TIS signatures in vivo is required to design TIS-based tools to predict the effect of TIS on treatment outcomes, although the development of TIS in breast cancer (BC) is an expected outcome.
Tetraspanins typically associate laterally with other membrane proteins to form tetraspanin-enriched microdomains. 8 As part of these microdomains, they play crucial roles in cell adhesion, migration, invasion, signaling and proliferation, which are all implicated in cancer progression. 9 Recent reports have linked several tetraspanin family members to cellular senescence. For example, CD9, a tetraspanin known for its role in cancer progression and metastasis, is also a potential component of endothelial cell senescence. 10 Similarly, CD82 suppresses metastasis through various mechanisms, including induction of cellular senescence and apoptosis in response to extracellular signals. 11 Despite being widely and abundantly expressed, 12 tetraspanins have not been extensively studied, and their functional contributions are not readily categorized.
Tetraspanin 4 (TSPAN4), also known as NAG-2, is a member of the transmembrane 4 family of proteins with highly conserved integral membrane proteins characterized by four transmembrane domains.13,14 TSPAN4 has been involved in various cancers and is closely linked to tumor invasion and migration. 15 Furthermore, TSPAN4 is implicated in migrasomes formation, which are newly discovered cellular organelles produced during cell migration that facilitate signal exchange between migrating cells.16,17 Migrasomes enriched with TSPAN4 have been found to play a role in transferring senescence-associated signals to neighboring cells. 18 Migrasomes generated from senescent cells can be taken up by adjacent cells in a paracrine manner, allowing for the transfer of senescence-related signals to non-senescent cells. 18 However, TSPAN4’s connection to senescence, particularly TIS, remains unclear and understudied, especially in vivo. Moreover, the investigation of TSPAN’s expression in BC, especially in response to conventional therapy, has not been conducted before.
In the present study, we investigated the expression of TSPAN4 in BC samples of patients exposed to senescence-inducing neoadjuvant chemotherapy (NAC) relative to a TIS protein signature (combined downregulation of Lamin B1 and Ki67). Moreover, a similar analysis of a senescence-related gene expression signature (combined CDKN1A, LMNB1, MKI67, ATM, IGFBP7, MMP2, CXCL14, and CCL5) in response to NAC in BC was conducted in comparison to changes in TSPAN4 gene expression in an independent set. Our work contributes to ongoing research focused on identifying potential biomarkers that can predict BC treatment response to chemotherapy.
Methods
Study Design and Collection of Patient Samples
The study included 38 female patients diagnosed with early-stage invasive breast carcinoma who received NAC and underwent surgical resection at King Abdullah University Hospital (KAUH) (Appendix Table A1). Paired (matched) formalin-fixed, paraffin-embedded (FFPE) tissue blocks, consisting of pre-NAC core-needle biopsies and post-NAC mastectomy samples (~2 cm) for each patient, were collected from the KAUH Pathology Department between 2018 and 2024. Eligible patients were aged 18–90 years and diagnosed with either invasive ductal carcinoma (IDC) or invasive lobular carcinoma (ILC). Received NAC regimens included doxorubicin plus cyclophosphamide followed by paclitaxel or docetaxel (AC+P/D), docetaxel plus cyclophosphamide (TC), docetaxel plus carboplatin followed by trastuzumab (TCH) ± pertuzumab, docetaxel/cyclophosphamide+ trastuzumab, or paclitaxel/trastuzumab/pertuzumab. Patients were included regardless of molecular subtype (Luminal A, Luminal B, HER2-positive, or triple-negative BC [TNBC]), grade, or stage as long as NAC was utilized for their treatment. Exclusion criteria included complete pathological response (pCR) to NAC, ductal carcinoma in situ (DCIS) or lobular carcinoma in situ (LCIS), and insufficient or unavailable FFPE tissue for analysis. Clinical and pathological data, including tumor histology, grade, and response to NAC, were documented. Tumor staging followed the AJCC 8th edition TNM classification, 19 and estrogen receptor (ER), progesterone receptor (PR), and HER2 status were assessed via immunohistochemistry (IHC) on core-needle biopsy samples. A subset of Stage IV BC patients was treated with NAC and underwent surgery and thus was included in this study because paired pre- and post-treatment tumor samples were available, allowing for immunohistochemical analysis (Appendix Table A1). The pathological response to NAC was measured based on the changes in tumor size and nodal involvement, where a partial response was identified as any reduction in either tumor size or nodal involvement status following NAC, whereas cases with no change in both aspects were classified as no response. 20 In the sample cohort, 56% of the patients exhibited partial response while only 23% showed no response or could not be assessed due to missing data (Appendix Table A2). This study was conducted using archived specimens and clinical data without direct patient interaction or the need for individual consent. All data collection and analyses adhered to the ethical principles of the Declaration of Helsinki and were approved by the Institutional Review Board (IRB) at KAUH (protocol: 35/170/2024).
Hematoxylin and Eosin (H&E) Staining
All 38 paired tissue samples were cut into 5 µm sections using a rotary microtome, dried at 60C for ~30 min, and processed for H&E staining. Sections were deparaffinized in xylene (two 10-min changes), rehydrated through graded ethanol (100%, 95%, 70%; 2 min each), and rinsed in distilled water. Nuclear staining was performed with hematoxylin (15 min), followed by water rinsing and brief bluing in lithium carbonate. Eosin (8 min) was used for cytoplasmic counterstaining. Finally, sections were dehydrated through ascending ethanol, cleared in xylene, and mounted with DPX medium. Representative bright-field images were captured using a light microscope (Cytation 5; BioTek, Agilent Technologies, Santa Clara, CA, USA) at 200× magnification (Appendix Fig. A1).
Immunohistochemical Staining
Sections of 4 µm thickness were obtained from FFPE blocks and dried in an oven, followed by deparaffinization using xylene and rehydration in ethanol. Subsequently, they were rinsed with deionized water, and antigen retrieval was performed using citrate or ethylenediaminetetraacetic acid (EDTA) buffers through the heat-induced epitope retrieval (HIER) method. To block endogenous peroxidase activity, 3% hydrogen peroxide was applied, and non-specific binding was minimized using a 5% BSA protein-blocking agent. The sections were then incubated with primary antibodies targeting the proteins of interest (Lamin B1, Ki67, and TSPAN4) (Appendix Table A3). After extensive washing, the sections were treated with a secondary antibody and incubated with Polymer-HRP Reagent (HRP-Polymer anti-Mouse/Rabbit reagent, Mouse/Rabbit ImmunoDetector DAB HRP Brown; BioSB, Santa Barbara, CA, USA). Slides were dehydrated and rinsed in Phosphate-buffered saline (PBS), counterstained with Mayer hematoxylin, lithium carbonate solution, and dehydrated with ethanol, then cleared and coverslipped. Further details of immunohistochemical staining procedures were reported previously.21 –23 Each staining batch had positive and negative control sections. Representative bright-field histopathological images for each protein marker were captured using a light microscope (Cytation 5; BioTek, Agilent Technologies, Santa Clara, USA) at 200× magnification.
Pathological Scoring of TSPAN4, Lamin B1, and Ki67
Five pathologists (co-authors: AAM, SBA, MM, NAS, and SD) independently assessed the mean positively stained tumor cells within tumor regions using a scale from 1% to 100% using light microscopy with 20× and 40× objective lenses (ZEISS Axio Observer; Zeiss, Germany). A change exceeding 10% in the expression of either biomarker post-NAC was considered significant. The evaluation of senescence-associated biomarkers (Lamin B1 and Ki67) involved the analysis of the mean percentage of tumor cells positively stained for each marker, using light microscopy with 20× and 40× objective lenses (ZEISS Axio Observer; Zeiss, Germany), as described previously.21 –24 To the best of our knowledge, there is a notable absence of studies employing IHC to examine TSPAN4 expression in BC, and thus, its expression was evaluated based on approaches used for other tetraspanins.25,26
Data Acquisition and Preprocessing for Gene Expression Sets
Gene expression data set (GSE123845) was obtained from the GEO database as normalized processed data.27,28 This data set consisted of 227 BC samples obtained from 136 patients as following: 112 samples were obtained before the exposure to any treatment as a diagnostic core biopsy (pre-NAC: T1), 88 samples were obtained as second core biopsies after 1 month treatment (T2) with doxorubicin + cyclophosphamide + docetaxel, and 27 samples were taken as resection samples after 6 months of treatment (T3). 27 A total of 27 samples were excluded from further analysis as they were obtained after 6 months of NAC treatment. Within this set, 68 patients provided paired pre-NAC (T1) and post-NAC (1 month, T2) samples (n=132 samples).
Gene Set Enrichment Analysis (GSEA)
A pre-ranked gene list was generated using the limma framework in R. Briefly, raw TPM values were transformed as log2(TPM+1). Genes with non-finite values in most samples or zero variance across samples were removed. A linear model with a single factor for timepoint (T1 vs. T2) was fit, and empirical-Bayes moderated t-statistics were obtained for the contrast T2 versus T1. The resulting two-column RNK file contained the gene identifier and the moderated t-statistic; by construction, positive ranks indicate higher expression in post-NAC (T2) and negative ranks indicate higher expression in pre-NAC (T1). Ties in the ranking (≈1% of genes) were left as is and handled by GSEApy’s default tie-breaking.
Gene Set Enrichment Analysis (GSEA) was performed using the pre-ranked routine in GSEApy (Python version 3.12.3) with 1000 permutations and FDR control for multiple testing. Gene sets were supplied as GMT files from MSigDB,29,30 including the senescence-related collections FRIDMAN_SENESCENCE_UP (77 genes collection), REACTOME_CELLULAR_SENESCENCE (197 genes collection), and REACTOME_SENESCENCE_ASSOCIATED_SECRETORY_PHENOTYPE_SASP (111 genes collection). 31 For interpretation, a positive normalized enrichment score (NES) denotes enrichment among genes up in T2, whereas a negative NES denotes enrichment among genes up in T1.
Correlation Analysis
We calculated the correlation for every gene–gene pair using the Pearson correlation function in Spyder environment (version 5.5.1) in Python (version 3.12.3). For graphical representation, we plotted the lower triangular portion of this matrix as a heatmap with matplotlib (v3.x) and seaborn (v0.11+), and we employed a divergent “coolwarm” colormap fixed to the range –1 to +1. Each cell was annotated with its Pearson r value (formatted to two decimal places).
Statistical Analysis
Data analyses were performed using Python (version 3.12.3) in Spyder environment (version 5.5.1) using pandas and SciPy libraries. Firstly, we used Shapiro–Wilk and Kolmogorov–Smirnov tests to check whether the data were normally distributed. Given that the data do not appear to be normally distributed, non-parametric tests were used as following: Mann–Whitney U test was used to compare the differential expression of pre-NAC versus post-NAC samples as bulk groups while Wilcoxon signed rank test was used to compare the differences between paired samples from same patients (pre- and post-NAC). All reported p values were two-tailed, and p≤0.05 was considered statistically significant.
Results
Measurement of the Protein Expression of the Senescence-Associated Biomarkers in BC Samples After NAC Treatment
We first evaluated the effect of NAC on Lamin B1 protein expression in matched pre-NAC biopsies versus post-NAC surgical resections obtained from the same patients (n=38). Lamin B1 is a key protein of the nuclear envelope that plays a crucial role in the formation of nuclear structures, nuclear stability, and facilitation of DNA replication and transcription. 32 The downregulation of Lamin B1 is a well-known marker for identifying senescent cells both in vitro and in vivo.33,34 Our analysis showed a notable reduction in the percentage of Lamin B1 positively stained cells following NAC (Fig. 1A). In addition, the quantification of the overall mean of Lamin B1 positive cells revealed a significant decrease in the post-NAC group compared with the pre-NAC group (p<0.001) (Fig. 1B). These findings were further supported by the analysis of Lamin B1 for each patient individually (comparing paired pre-NAC vs. post-NAC expression for the same patient), which indicated that 76% (29/38) of patients exhibited a significant decrease in Lamin B1 expression following NAC (Fig. 1C).
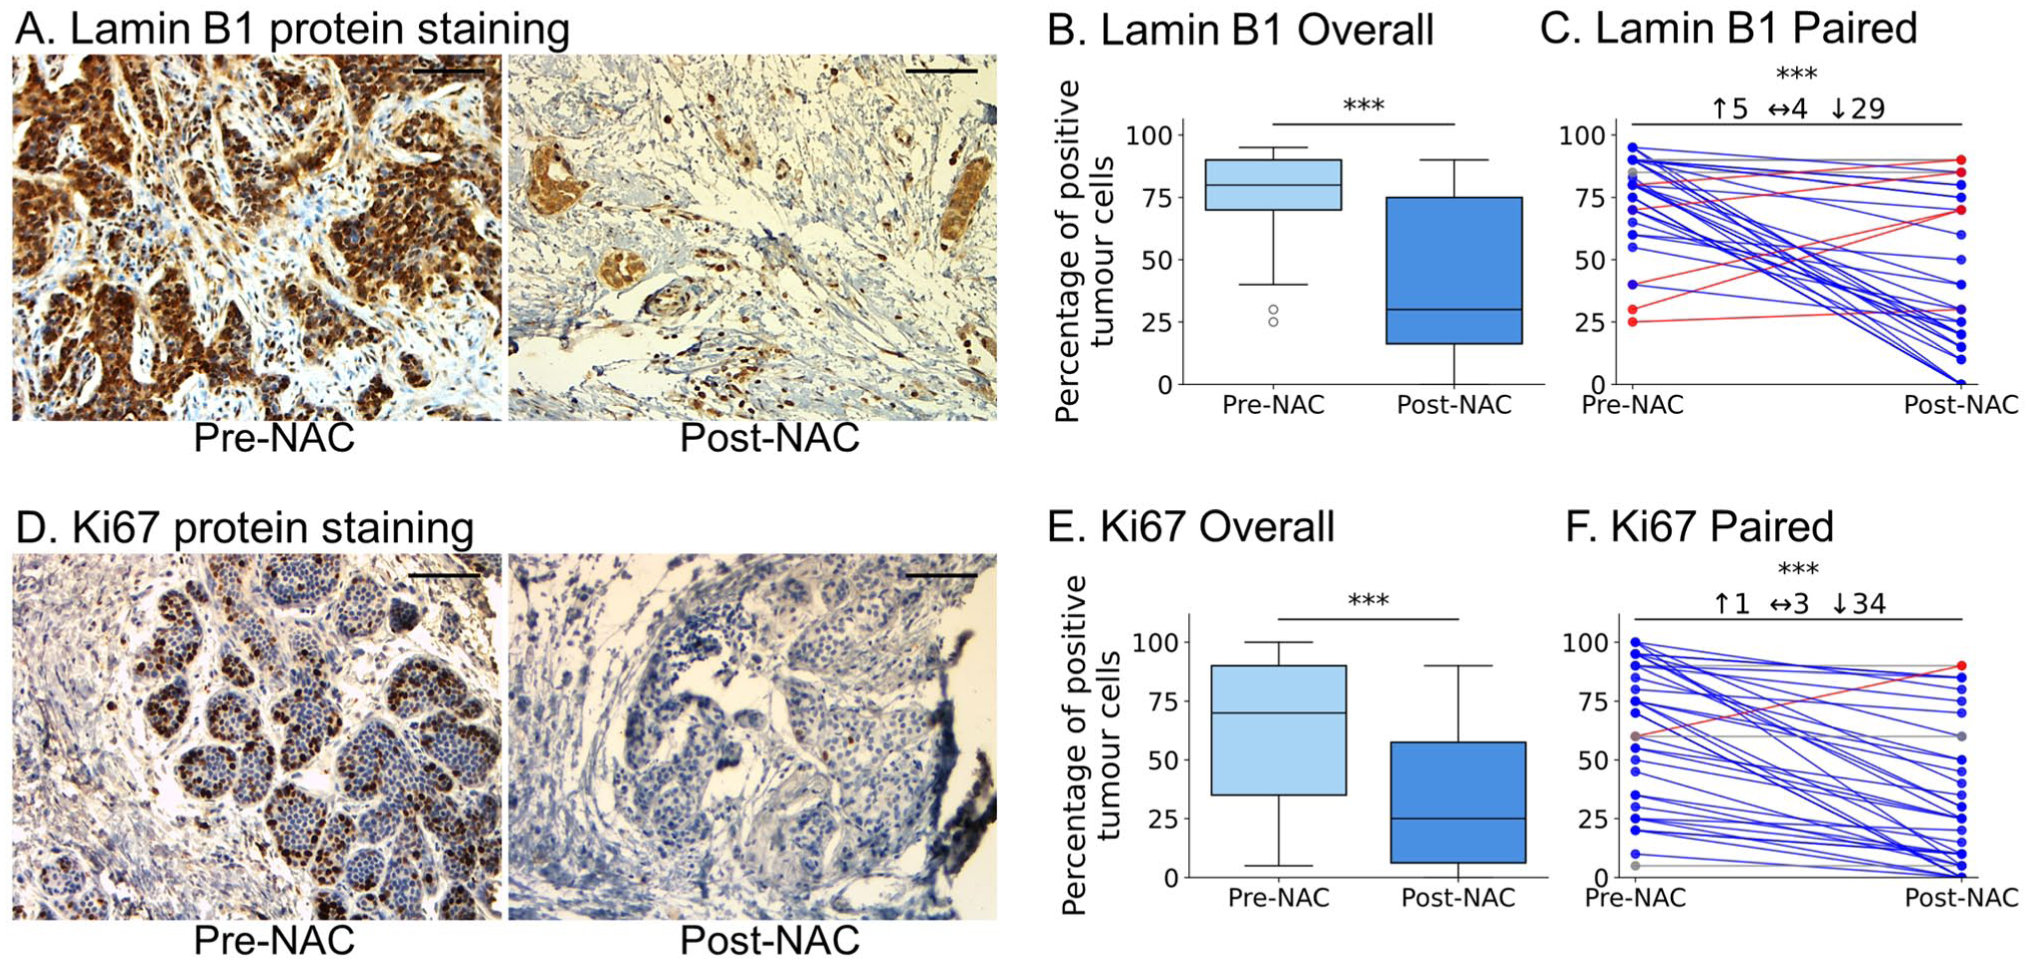
NAC induces TIS protein signature in matched BC samples (n=38). (A and D) Representative immunohistochemistry of Lamin B1 (A) and Ki67 (D) in paired pre-NAC core-needle biopsy (left) and matched post-NAC surgical resection (right) from the same patient showing notable reduction in nuclear staining after treatment. Scale bar = 100 µm. (B and E) Box plots showing the mean percentage of positive tumor cells for Lamin B1 (B) and Ki67 (E) in the whole cohort (n=38) comparing pre-NAC to post-NAC expression of each protein. Boxes show median ± IQR; whiskers indicate range. Mann–Whitney U test, ***p<0.001. (C and F) Per-patient paired (pre-NAC vs. post-NAC) plots highlighting the direction of change (blue=decrease, red=increase) for Lamin B1 (C) and Ki67 (F); Wilcoxon signed-rank test, ***p<0.001. Overall, Lamin B1 fell in 76% and Ki67 in 89% of tumors, identifying 68% of cases as TIS-positive by the combined protein signature (tumors exhibiting both Lamin B1 and Ki67 reduced expression in response to NAC simultaneously).
Ki67 is a non-histone protein located in the nuclei and nucleoli that remains active throughout the G1, S, G2, and M phases of the cell cycle and is missing from quiescent and senescent cells.35,36 We identified a marked decrease in the percentage of tumor cells expressing Ki67 protein following NAC (Fig. 1D). Moreover, quantitative analysis of Ki67 positive cells revealed a significant reduction in its expression in the post-NAC group compared with the pre-NAC group (p<0.001) (Fig. 1E). Furthermore, individual analysis of protein expression revealed that 89% (34/38) of patients demonstrated a distinct decrease in Ki67 expression (p<0.001) (Fig. 1F). The percentage of senescence-positive samples post-NAC was considered based on samples exhibiting a concomitant decrease in both senescence-associated biomarkers, Ki67 and Lamin B1. Our analysis showed that 68% of the samples (26 out of 38) were identified as TIS-positive, highlighting senescence as a significant outcome of NAC.
Enrichment Analysis Reveals Upregulation of Senescence-Associated Genes Post-NAC
To validate our IHC findings, we utilized a publicly available gene expression data set (GSE123845), 28 that contains 227 BC samples obtained from 136 patients at different time points (T1: pre-NAC and T2: 1-month post-NAC). Of these 136 patients, there were 68 patients who had (T1) and (T2) samples (n=132 specimens, please refer to Methods section for further details on T1 and T2 definitions). First, we performed GSEA analysis of pre-NAC and post-NAC samples using three senescence-related signatures, which revealed a clear enrichment of senescence-associated pathways in the post-NAC samples. Among the three senescence collections, the FRIDMAN_SENESCENCE_UP set (77 genes) displayed a significant trend toward post-NAC enrichment (NES = 1.55, p=0.004, FDR q = 0.012), with leading-edge members such as CDKN1A, COL1A2, SMPD1 and VIM (Fig. 2A). In contrast, the REACTOME_CELLULAR_SENESCENCE (127 genes) and REACTOME_SENESCENCE_ASSOCIATED_SECRETORY_PHENOTYPE_SASP gene collections (111 genes) both showed a similar trend (upregulation post-NAC) but without significant enrichment value (NES = 1.07, p=0.332, FDR q = 0.527 and NES = 0.87, p=0.689, FDR q = 0.722, respectively) (Fig. 2B-C). Together, these data indicate that TIS and the SASP are triggered following NAC in BC tissue samples.
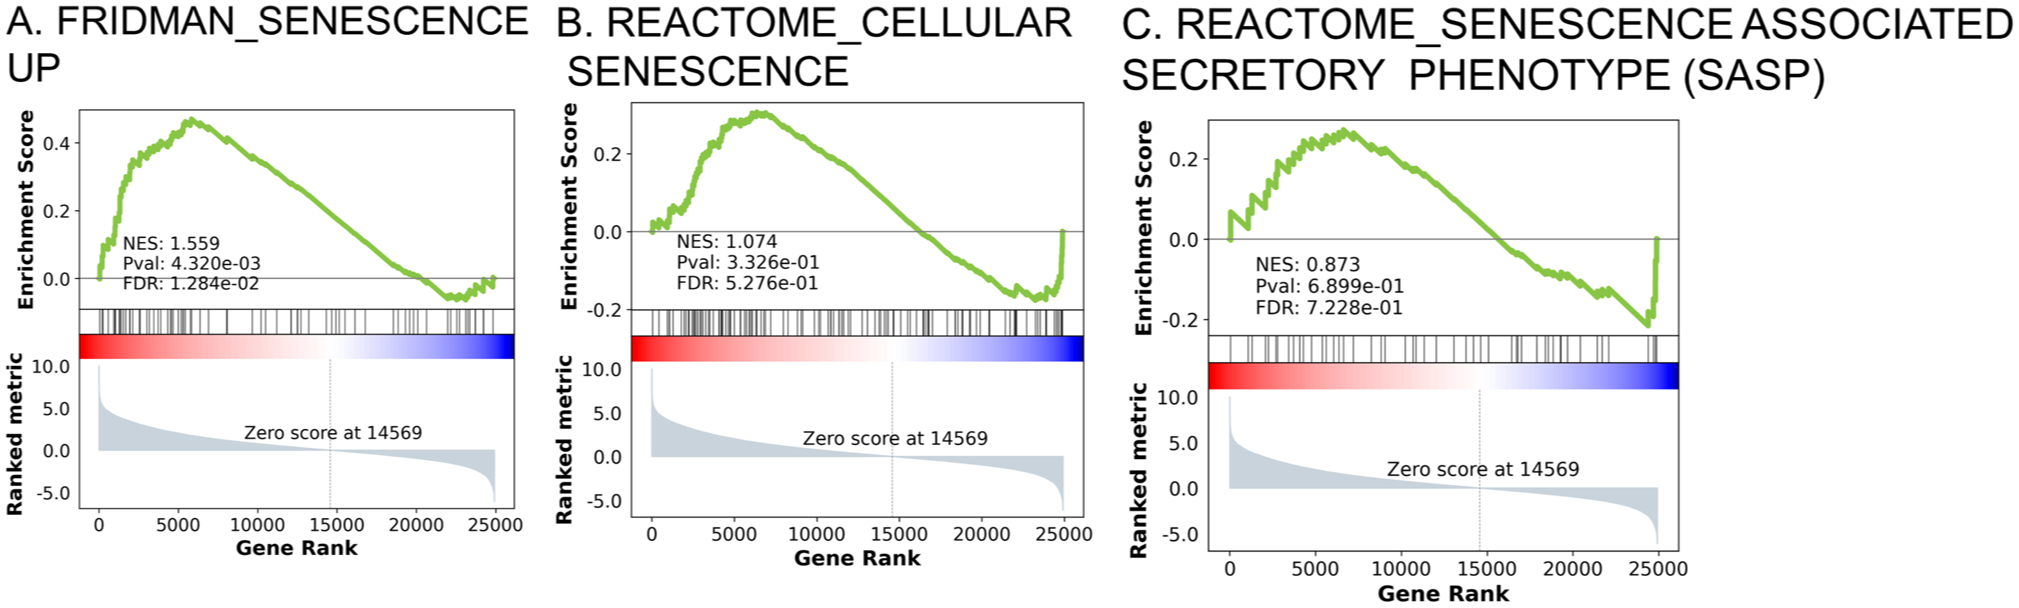
Gene-set enrichment analysis (GSEA) confirms activation of TIS in response to NAC in BC (GSE123845, n=200 samples). Pre-ranked GSEA comparing pre-NAC biopsies with post-NAC samples. (A) FRIDMAN_SENESCENCE_UP (77 genes)—NES= 1.559, FDR= 0.012. (B) REACTOME_CELLULAR_SENESCENCE gene set (197 genes)—NES = 1.074, FDR = 0.527. (C) REACTOME_SENESCENCE_ASSOCIATED_SECRETORY_PHENOTYPE_SASP (111 genes)–NES = 0.837, FDR = 0.722. Positive NES values indicate enrichment in post-NAC samples, supporting TIS and SASP activation in vivo.
Bulk Comparison of TIS and SASP Gene Expression in BC Samples Pre- versus Post-NAC
To confirm our GSEA observations, we explored eight senescence-associated genes that represent various senescence features using all pre- and post-NAC cohorts. Our analysis of LMNB1 (encoding for Lamin B1) expression revealed a modest (but significant) decrease post-NAC (median: 37.31 vs. 29.71; p=0.001) (Fig. 3A). Similarly, MKI67 (encoding for Ki67) showed a notable decline (median: 8.64 vs. 7.06; p=0.003) (Fig. 3B). Moreover, CDKN1A (encoding for p21Cip1), a cyclin-dependent kinase inhibitor and a classical hallmark of senescence, 37 exhibited a dramatic upregulation post-NAC (median 37.7 vs. 66.62; p<0.00001) (Fig. 3C). Consistent with this, the DNA damage response kinase ATM was slightly, but significantly, higher in post-NAC samples (median 10.32 vs. 12.33; p=0.0002) confirming persistent DNA stress following treatment (Fig. 3D). IGFBP7 (encoding for IGFBP7), a component of the SASP, 38 exhibited a significant difference between groups (median 651.5 vs. 840.14; p=0.003), (Fig. 3E). Furthermore, our analysis of well-known SASP-related genes showed a consistent profile of TIS induction. For example, MMP2 (encoding for MMP2) was markedly elevated in post-NAC samples (median 187.13 vs. 376.38; p<0.00001) (Fig. 3F). Although CXCL14 (median 31.16 vs. 54.11; p=0.07) did not change significantly (Fig. 3G), CCL5 did (median 78.04 vs. 135.81; p=0.009) (Fig. 3H), indicating a selective upregulation of specific SASP components following NAC in BC patients.
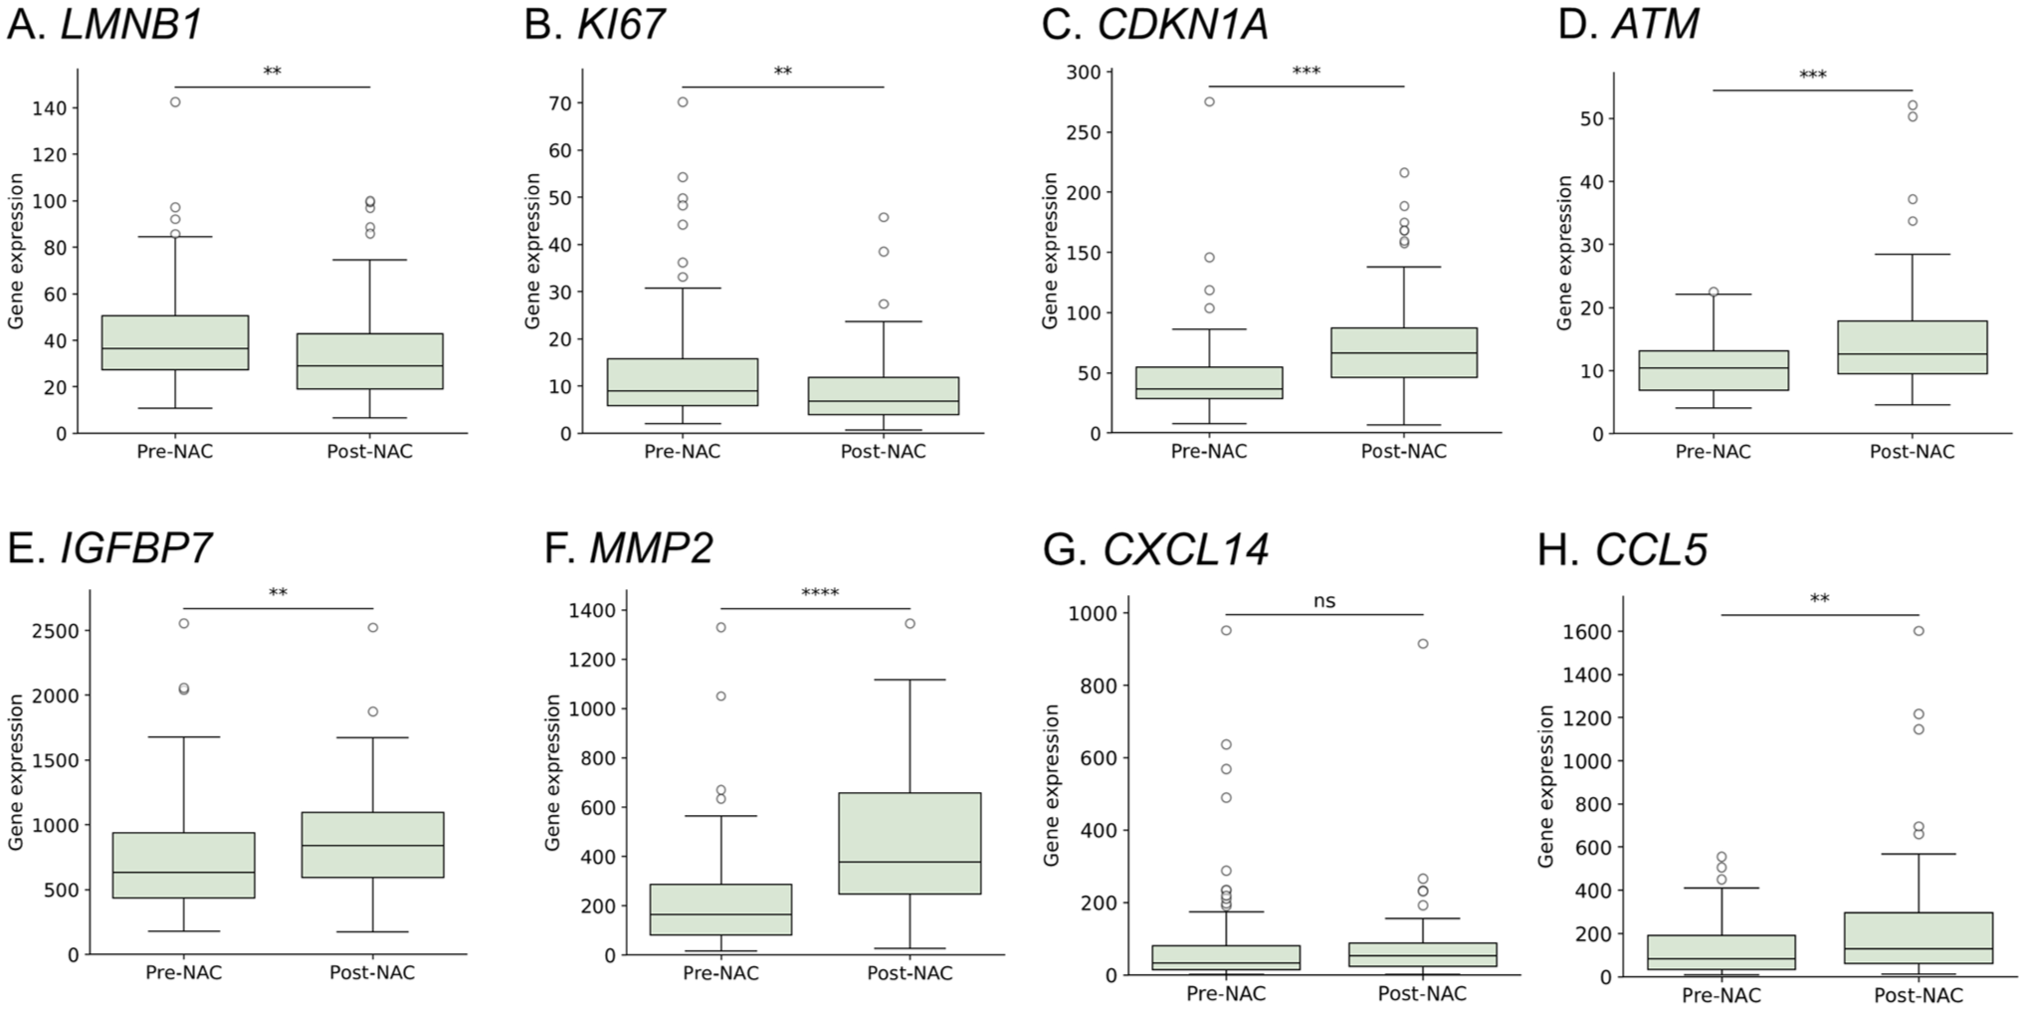
Bulk comparison of senescence-related gene expression demonstrates selective upregulation of TIS and SASP components following NAC. Box plots show mRNA levels in pre-NAC (n=112) versus post-NAC (n=88) samples. Mann–Whitney U statistics: (A) LMNB1 **p=0.001 (B) MKI67 **p=0.003; (C); CDKN1A ****p<0.00001; (D) ATM ***p<0.001 (one sample was excluded from the analysis following outlier detection using the ROUT method); (E) IGFBP7 **p=0.003; (F) MMP2 ****p<0.00001; (G) CXCL14 ns; (H) CCL5 **p=0.009. Horizontal bars mark medians; whiskers represent full data range.
Paired Comparisons of TIS and SASP Gene Expression in BC Samples Pre- versus Post-NAC
Next, we investigated the difference in the senescence-associated genes in the paired samples obtained pre-NAC (n=68) and after one month of chemotherapy exposure (n=68). We applied paired Wilcoxon signed rank- analysis accompanied with direct delta between pre- versus post-NAC. LMNB1 and MKI67 exhibited decreased expression as a response to NAC in which 54 and 45 patients (p<0.0001 and =0.007), respectively, exhibited declined gene levels consistent with a senescence induction profile (Fig. 4A and Fig. 4B). Consistent with this, CDKN1A expression was higher within post-NAC in 57 of 68 patients relative to their matched pre-NAC (p<0.00001) (Fig. 4C), and ATM expression was significantly increased in 47 patients (p<0.001) (Fig. 4D). Moreover, IGFBP7 expression was significantly increased in 44 patients (p<0.01) (Fig. 4E). Consistent with the SASP profile, MMP2 gene expression was elevated in 56 patients post-NAC (p<0.00001) (Fig. 4F), CXCL14 expression was increased in 49 patients post-NAC (p=0.016) (Fig. 4G), and CCL5 expression was increased in most patients (53/68) post-NAC (p<0.00001) (Fig. 4H).
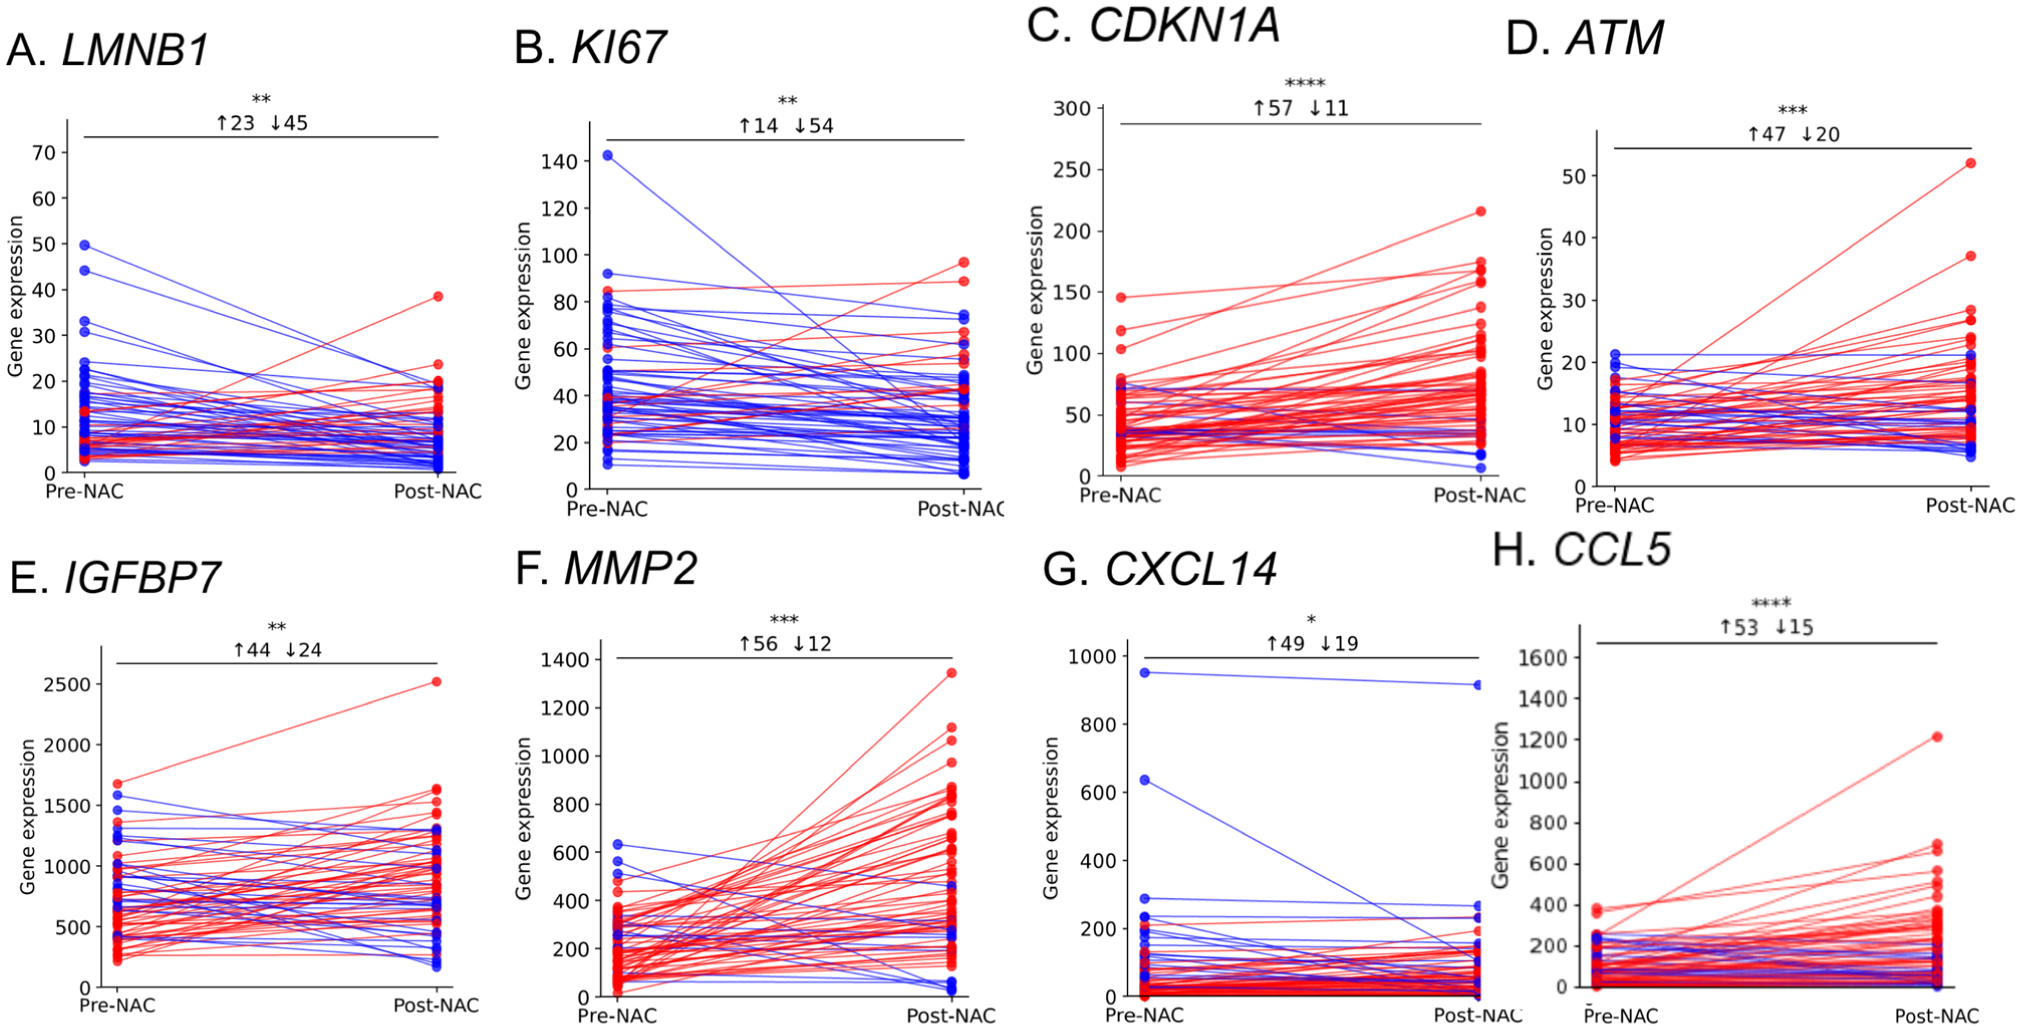
Paired gene expression analysis reveals coordinated gene-level TIS signature in individual tumors (n=68). Wilcoxon signed-rank paired plots of pre-NAC (T1) versus 1-month post-NAC (T2). blue=decrease, red=increase. (A) LMNB1 ***p<0.0001; (B) MKI67 *p=0.007; (C) CDKN1A ****p<0.00001; (D) ATM ***p<0.001 (one sample was excluded from the analysis following outlier detection using the ROUT method); (E) IGFBP7 **p=0.003; (F) MMP2 ****p<0.00001; (G) CXCL14 **p=0.006; (H) CCL5 ****p<0.00001.
Evaluation of TSPAN4 Protein and Gene Expression in BC Samples After NAC Treatment
To assess the impact of NAC on TSPAN4 protein expression, we utilized the same IHC cohort of matched BC samples (n=38). Comparative analysis of TSPAN4 expression in these paired samples revealed detectable protein expression in both pre- and post-NAC tissues. Notably, an increase in tumor cell positivity was frequently observed in post-NAC specimens (Fig. 5A). Despite this qualitative difference, the overall quantification of mean TSPAN4 expression across the entire cohort did not reach statistical significance when comparing pre- and post-NAC samples (Fig. 5B). On an individual level, a more nuanced pattern emerged, while nearly half of the patients (19/38; 50%) exhibited no appreciable change in TSPAN4 expression following NAC, a notable subset (15/38; 39%) demonstrated a significant upregulation of the protein post-treatment (p<0.01) (Fig. 5C). To confirm these findings, we assessed NAG2 (encoding for TSPAN4) expression in response to NAC in the GSE123845 data set. We found that NAG2 exhibited a significant increase post-NAC (median 38.71 vs. 49.86; p<0.00001) (Fig. 5D). Moreover, NAG2 expression was significantly higher in 54/68 patients post-NAC (p<0.00001) (Fig. 5E).
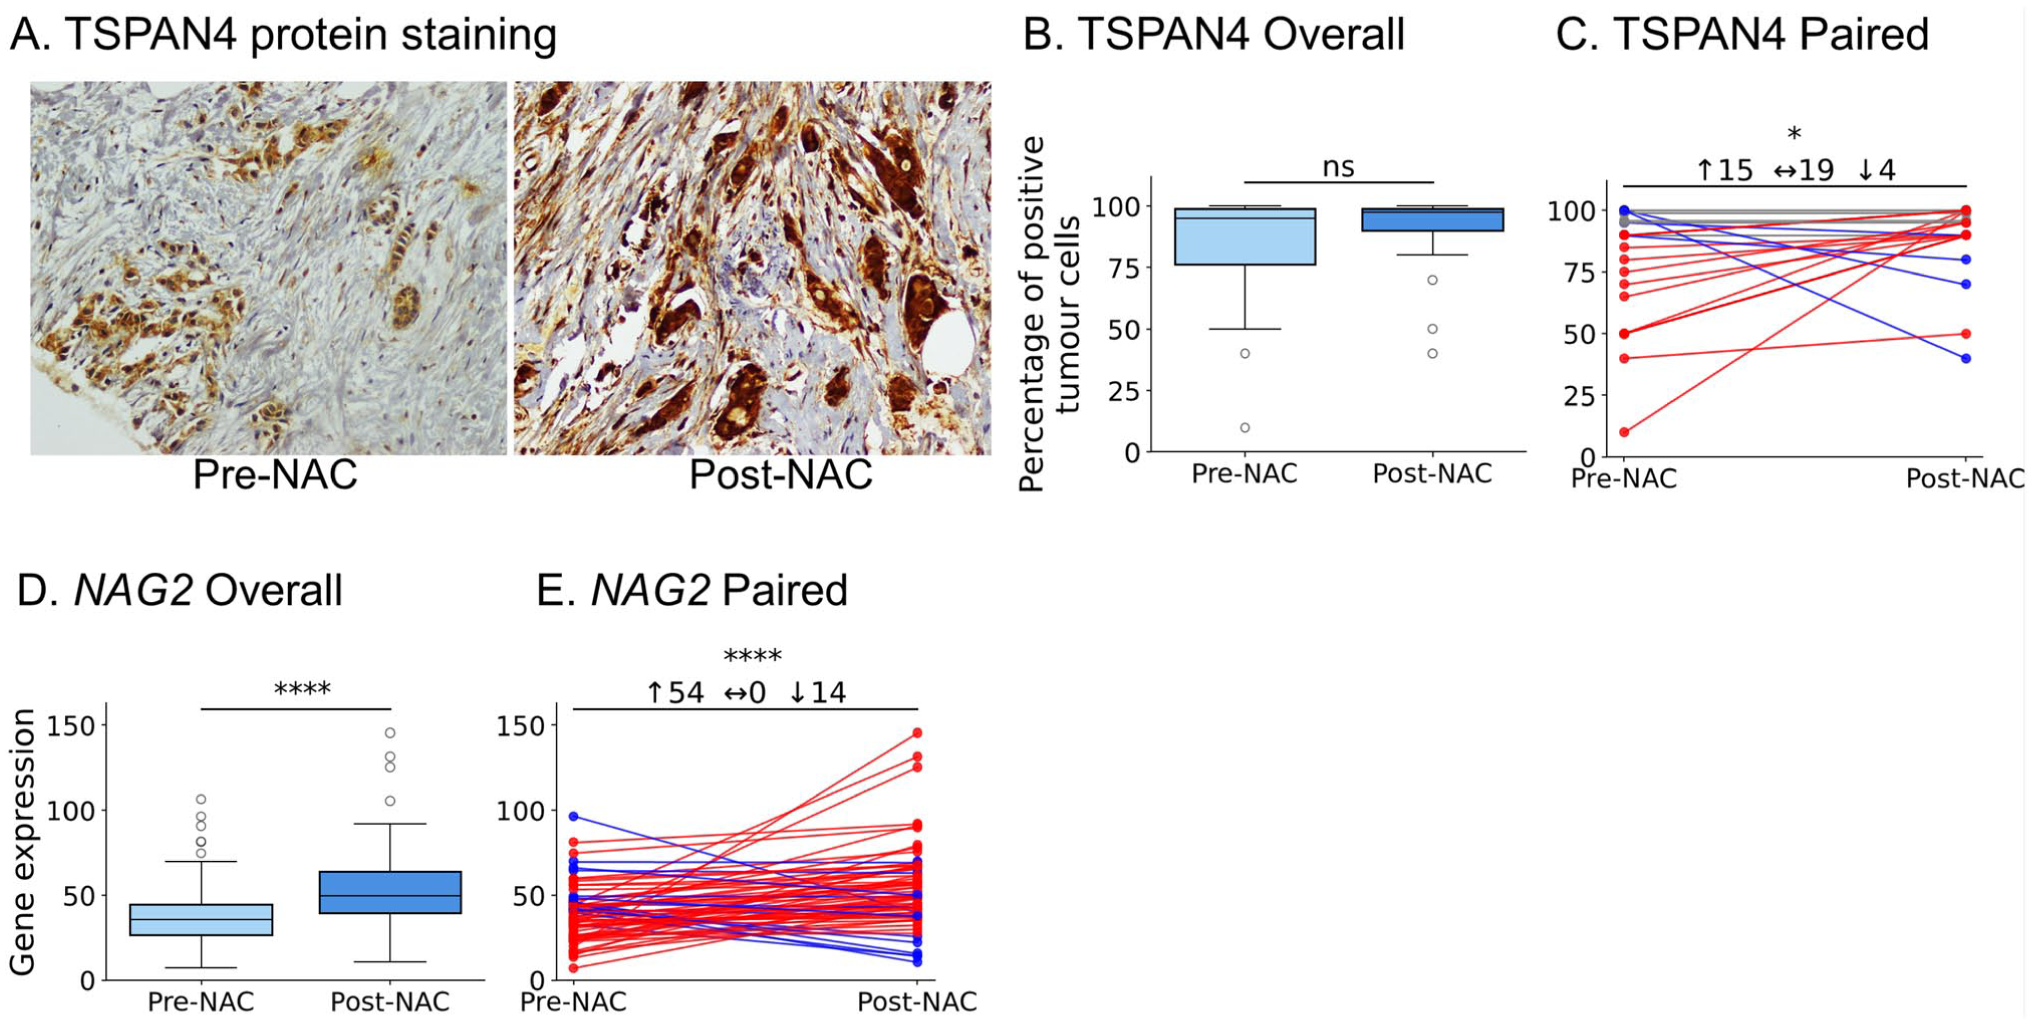
TSPAN4 is upregulated in BC after NAC at both protein and transcript levels. (A) Representative IHC images showing increased membranous/cytoplasmic TSPAN4 staining post-NAC. Scale bar = 100 µm. (B) Cohort-wide box-and-whisker plot of TSPAN4-positive tumor cells (n=38); ns, Mann–Whitney U. (C) Paired tumor plot displaying heterogeneity of protein change; 15/38 cases show >10% upregulation (*p<0.01). (D) Box-and-whisker plot of NAG2 (encoding for TSPAN4) mRNA in 68 matched transcriptomic samples; ****p<0.00001. (E) Paired mRNA plot revealing increased NAG2 in 54/68 tumors (****p<0.00001).
The Relationship Between TSPAN4 and Senescence-Associated Biomarkers Protein Expression Following NAC
Finally, we intended to investigate the relationship between TSPAN4 expression and senescence markers in samples exhibiting increased TSPAN4 post-NAC (Fig. 6A). Our analysis revealed that among the 15 samples exhibiting an increase in TSPAN4 positivity (protein expression) following NAC, 8 samples (57%) were identified as senescence-positive (Fig. 6B). We then went back to the GSE123845 data set and examined the expression levels of the eight senescence-related genes in the subgroup of patients exhibiting higher TSPAN4 expression post-NAC (n=68 patient = 132 sample). To classify the senescence status of these 68 patients, we established a senescence signature based on the expression pattern of these genes. Specifically, a patient sample was considered “TIS-positive” if it demonstrated increased post-NAC expression of CDKN1A, ATM, IGFBP7, CCL5, CXCL14, and MMP2, accompanied by decreased expression of MKI67 and LMNB1. Samples that did not meet these criteria were classified as “TIS-negative.” We found that approximately one third of the patients (31%; n=21/68) fit the TIS-positive profile, a proportion similar to what we previously reported. 21
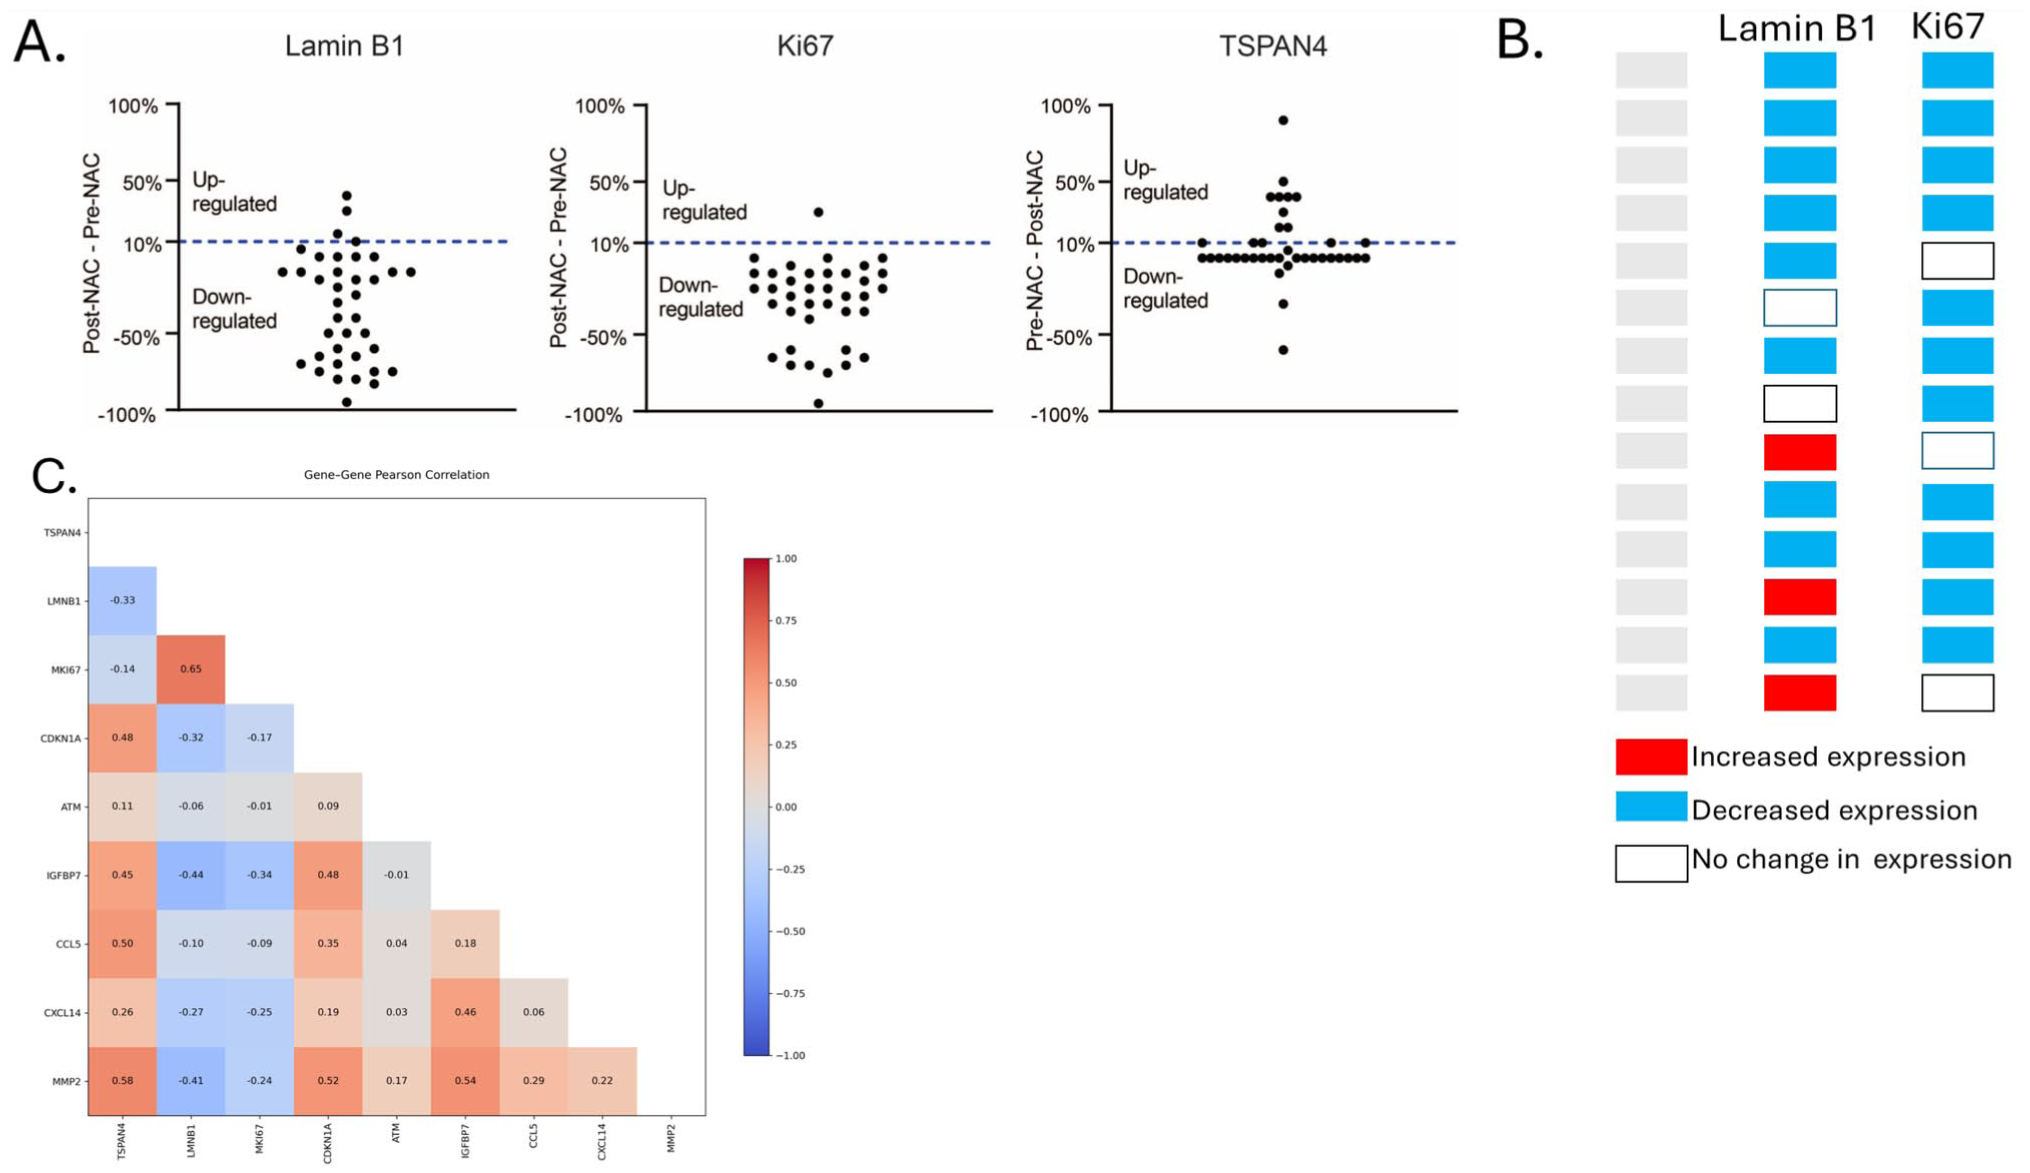
Elevated TSPAN4 aligns with a coordinated TIS transcriptional module. (A) Changes in Lamin B1, Ki67, and TSPAN4 expression pre- and post-neoadjuvant chemotherapy (NAC). (B) Change-map for tumors with >10% TSPAN4 protein increase (n=15). Columns show direction of change for Lamin B1 and Ki67 (blue = decrease, red = increase, white = no change). Eight of 15 (53%) fulfill the dual-marker TIS criterion (concurrent blue blocks). (C) Lower-triangular Pearson correlation heat-map for TSPAN4 and eight senescence-associated genes in the 34 transcriptomic samples with increased NAG2. Warm colors denote positive, cool negative correlations; numerical values are r coefficients. TSPAN4 clusters with the senescence/SASP module (CDKN1A, ATM, IGFBP7, MMP2, CCL5, CXCL14) and are anti-correlated with proliferation markers LMNB1 and MKI67, supporting a functional link between TSPAN4 upregulation and TIS.
Correlation analysis of the 68 post-NAC samples revealed two separated transcriptional modules (Fig. 6C). NAG2 aligned with the senescence-associated module, displaying moderate-to-strong positive correlations with all six genes that rise after NAC—ATM (r = 0.11), CCL5 (0.50), MMP2 (0.58), CDKN1A (0.48), IGFBP7 (0.45) and CXCL14 (0.26) and negative correlations with the two genes that fall, LMNB1 (–0.33) and MKI67 (–0.14) (Fig. 6C). Within the TIS module, the strongest pairwise associations were MMP2–IGFBP7 (r = 0.54), MMP2-CDKN1A (0.52) and CDKN1A–IGFBP7 (0.48), indicating a possible co-regulation. In contrast, the proliferation markers LMNB1 and MKI67 were positively correlated (0.65), but inversely or weakly related to most senescence-up genes (e.g., LMNB1–IGFBP7 –0.44; LMNB1–MMP2 –0.41; MKI67–IGFBP7 –0.34) as expected (Fig. 6C). Collectively, these relationships underscore a coordinated TIS signature that is antithetical to proliferative activity and linked to elevated TSPAN4 expression in BC patients in response to NAC.
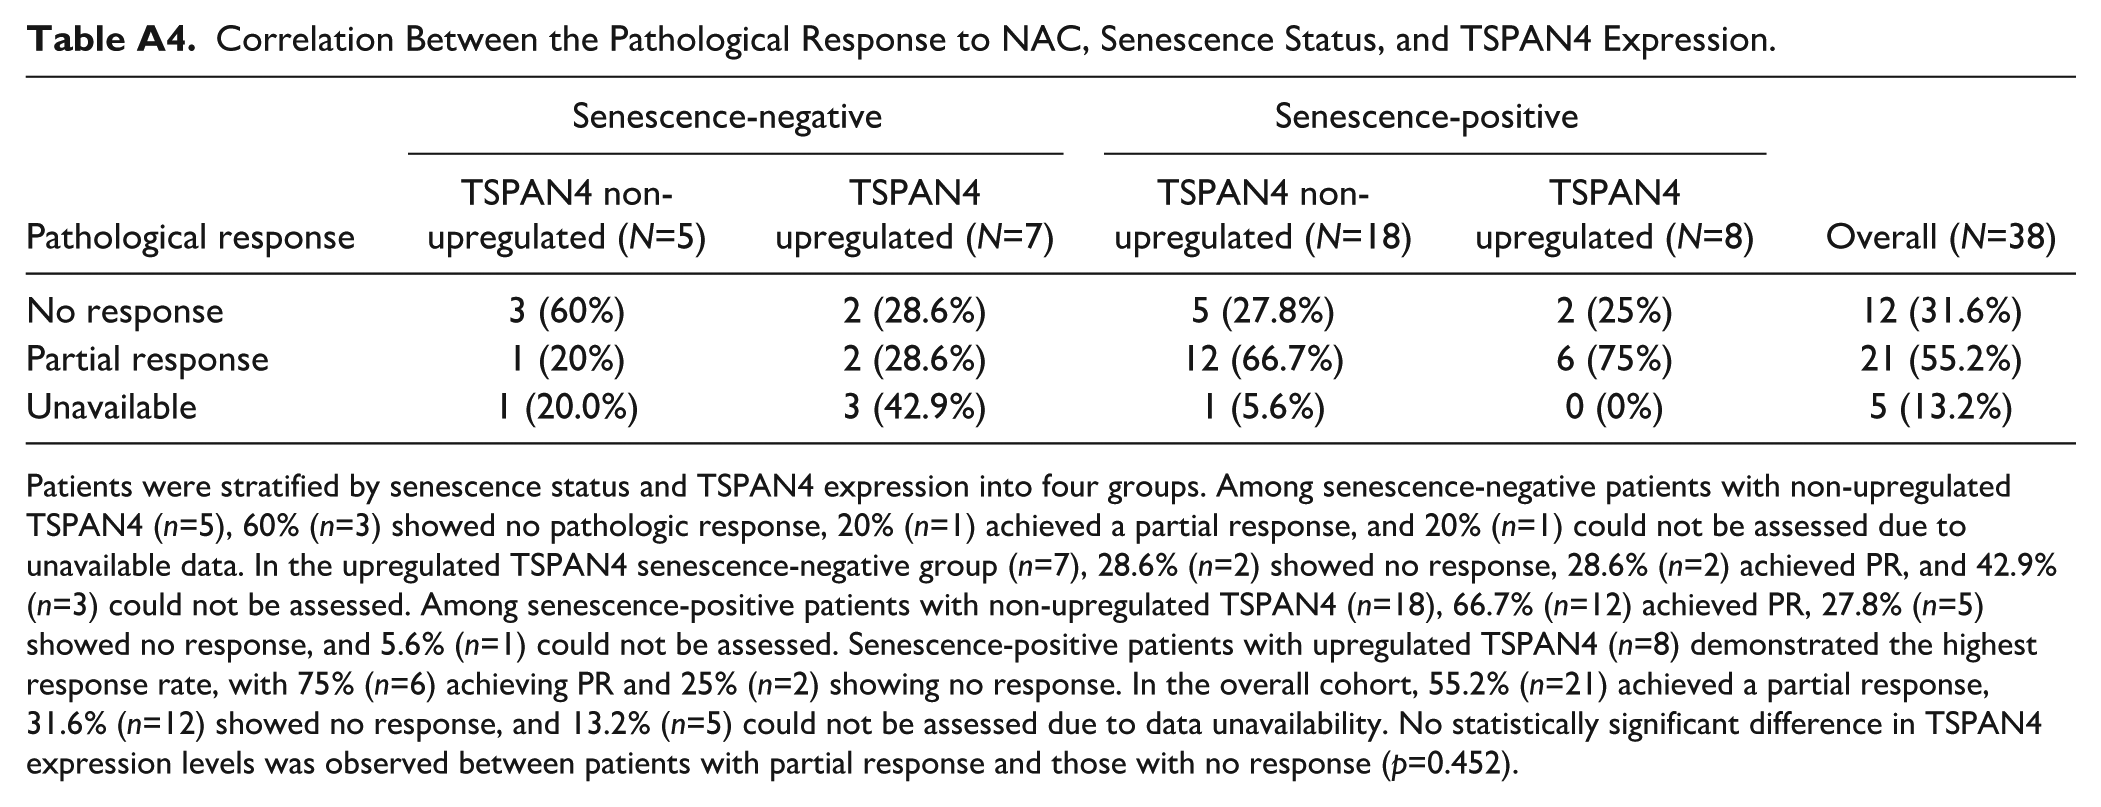
Finally, the relationship between TSPAN4 protein expression, senescence status, and pathologic response to NAC was evaluated in our cohort. Patients were stratified by senescence status (positive/negative) and TSPAN4 expression (upregulated/non-upregulated) into four groups. As mentioned earlier, senescence-positive samples (at the protein level) were considered as those exhibiting simultaneous downregulation of Lamin B1 and Ki67, while other possibilities were considered senescence-negative. Partial pathological response was defined as any pathologically measurable reduction in tumor burden that does not meet the criteria for pCR (Appendix Table A2). Among senescence-negative patients with non-upregulated TSPAN4 (n=5), 60% (n=3) showed no pathologic response, 20% (n=1) had a partial response, and response assessment could not be performed in 20% (n=1) due to data unavailability (Appendix Table A4). In contrast, in the upregulated TSPAN4 group (n=7), 28.6% (n=2) showed no response, 28.6% (n=2) showed partial response, and 42.9% (n=3) could not be assessed (Appendix Table A4). Among senescence-positive patients with non-upregulated TSPAN4 (n=18), 66.7% (n=12) showed partial response, 27.8% (n=5) showed no response, and 5.6% (n=1) could not be assessed. In contrast, senescence-positive patients with upregulated TSPAN4 (n=8) had the highest response rate, with 75% (n=6) achieving partial response and only 25% (n=2) showing no response (Appendix Table A4). In the overall cohort, 21 patients (55.2%) achieved a partial response, 12 (31.6%) had no response, and response status could not be assessed in 5 patients (13.2%) due to data unavailability. Moreover, when comparing TSPAN4 expression levels between patients who showed a partial response and those with no response, no statistically significant difference was found between these two groups (p=0.452) (Appendix Table A4).
Discussion
TIS is a form of senescence triggered by exposure to chemotherapy in both malignant and non-malignant cells. 39 TIS forces cells into a permanent (or sometimes temporary) cell cycle arrest, while remaining metabolically active. 40 Clinically, the development of TIS has been observed in BC patients’ tumor tissues following exposure to chemotherapy, suggesting that TIS plays a pivotal role in determining tumor response to NAC. 41 However, the identification of TIS in clinical cancer samples remains a challenge due to the lack of well-established senescence marker signatures. Importantly, due to the complexity of the senescent phenotype, it is necessary to experimentally measure multiple markers before concluding the presence of senescence. 42 Moreover, the senescent phenotype involves multiple hallmarks that combine cell cycle arrest, increased SA-β-gal activity, SASP upregulation, and changes in chromatin organization (i.e., senescence-associated heterochromatin foci, SAHF). 43 Thus, recent guidelines explicitly recommend using a combination of markers for identification of senescence, which is more challenging in patients’ tumor samples. 44
In this context, the loss of Lamin B1—a structural component of the nuclear envelope—has been established as a reliable marker for the detection of TIS in vivo. 33 In the present study, we demonstrated a marked reduction in the overall mean expression of Lamin B1 following NAC. Lamin B1 downregulation was also confirmed after performing GSEA analysis on pre- and post-NAC BC samples using the GSE123845 data set. Similar results were obtained in our previous work where we found a decline in the expression level of Lamin B1 in response to NAC in BC. 24 Consistent with Lamin B1 downregulation, we also examined Ki67, a proliferation marker that is closely reflective of the senescent growth arrest. 45 We identified a significant decline in Ki67 expression in response to NAC in BC samples, indicative of growth inhibition. Similarly, Moazed et al. 46 investigated the expression of Ki67 in 55 BC samples before and after NAC and identified a significant decline in its expression levels. Ki67 reduced expression was significantly associated with TNBC as more than half of the patients were triple negative. 46
We have previously employed three senescence-associated markers, Lamin B1, Ki67, and p16INK4a to investigate TIS in matched FFPE BC tissue blocks. 21 Samples were classified as TIS-positive if they exhibited concurrent downregulation of Lamin B1 and Ki67 alongside upregulation of p16INK4a El-Sadoni et al. 21 Similarly, we employed the same signature in another set of 55 matched BC samples before and after NAC. 23 Our analysis also included the measurement of NOXA (a pro-apoptotic protein potentially involved in chemoresistance) revealing that 75% of the samples showed a decrease in NOXA expression post-NAC; among these, 66% exhibited reduced Lamin B1 levels, and 80% demonstrated decreased Ki67 expression, emphasizing the role of both markers in the development of senescence. 23 Despite the exclusion of the classical senescence marker SA-β-gal due to the difficulty of measuring it in FFPE samples, previous studies have shown that increased SA-β-gal expression strongly correlates with reduced levels of the senescence-associated biomarkers Lamin B1 and Ki67 in BC samples. 47 Using our samples and employing similar TIS signature (downregulation of Lamin B1 and Ki67 markers), we found 68% of the samples were TIS-positive after NAC, however, the potential for including additional markers, e.g., p16INK4a or p21Cip1, the percentage of TIS-positive could have changed (reduced). In all cases, the development of TIS in response to NAC was an expected outcome of our analysis.
Our protein expression data was corroborated by the measurement of senescence-related gene expression signatures, which supported the development of TIS in BC samples in response to NAC. Despite the differences in the percentage of BC samples that exhibit protein expression profiles suggestive of senescence, TIS appears to be a common feature of tumors that exhibit partial or incomplete responses to NAC. However, the mechanisms that govern whether tumor cells undergo apoptosis, senescence, or a combination of both in response to chemotherapy remain unclear.
One prevailing theory posits that complete pathological responses to NAC are typically driven by robust apoptotic activity. 48 In contrast, tumors that fail to shrink adequately may reflect resistance to apoptosis, coupled with the activation of alternative stress responses such as TIS, which could allow residual tumor cells to persist despite treatment. 49 This assumption, however, was challenged by Febres-Aldana et al., 50 who examined p16INK4a expression in BC samples pre- and post-NAC. Their analysis of 10 matched samples from hormone receptor-negative BCs revealed a decrease in the percentage of p16INK4a-positive tumor cells following treatment from an average of 86% before NAC to 64% afterward. 50 These findings suggest that TIS, at least as defined by p16INK4a expression, may not be a uniform feature of incomplete pathological responses. Furthermore, the study highlighted that p16INK4a was markedly upregulated in non-cancerous components of the breast, including ductal and lobular epithelial cells, perilobular stroma, and adipose tissue. 50 This observation indicates that senescence markers are not limited to malignant cells and may be induced in the surrounding non-tumor microenvironment.
The presence of senescence in BC also appears to vary according to histological and molecular subtype. Cotarelo et al. 47 investigated tissue from 129 untreated invasive BC patients. Using intraoperative frozen tissue samples, a heterogeneous level of SA-β-gal staining was observed. Notably, HER2-positive tumors showed the highest frequency of SA-β-gal positivity (approximately 87.5%), while the majority of triple-negative tumors lacked significant staining (approximately 88.9%). 47 However, this pattern was not consistently reflected by other senescence-associated proteins such as p16INK4a and p53, whose expression did not align with the SA-β-gal, Ki67, and Lamin B1 profiles. These discrepancies underscore the variability and context-dependence of senescence marker expression in human malignancies.
It is also important to emphasize that while in vitro models of TIS allow for more predictable biomarker profiles, in vivo TIS remains far more complex. In the current study, GSEA analysis on pre- and post-NAC BC samples using the GSE123845 data set identified other TIS and SASP gene expression biomarkers with significant upregulation, such as CDKN1A, ATM. MMP2, IGFBP7, CCL5, CXCL14. Therefore, we used all eight markers as a senescence signature based on their expression pattern and considered them as TIS-positive if all exhibited increased expression post-NAC. Around 31% of the samples show a TIS-positive profile. Despite their potential utility, the routine utilization of these markers to measure senescence in vivo would require further validation.
In our study, we also observed that BC samples exposed to NAC exhibited a more differentiated, monomorphic appearance on IHC sections compared with their pre-NAC counterparts. This observation is consistent with well-recognized histopathological changes described after NAC, including decreased pleomorphism and, in some cases, an apparent improvement in differentiation or tumor grade in residual disease.51,52 These morphologic alterations are widely regarded as therapy-related effects rather than signatures of a specific biological program (e.g., senescence). Indeed, while TIS in cell culture is characterized by an enlarged, flattened morphology,53,54 such features are very subtle in human tissue because of the structural tissue constraints and cell-type heterogeneity.55,56 Therefore, we relied on molecular and immunohistochemical markers (e.g., Ki67 reduction, Lamin B1 downregulation) to evaluate senescence in situ. Furthermore, although senescence and terminal differentiation share some overlapping features (including lack of proliferative capacity and some morphological features), equating both states is inaccurate, and thus, the differentiation-related changes observed following exposure to NAC can better be described as a phenotypic response to drug exposure.
To our knowledge, no previous studies have demonstrated the precise role of TSPAN4 expression level in BC development in response to chemotherapy. Our results revealed that post-NAC BC tissue samples have an increased TSPAN4 positivity, although the overall mean expression levels across the cohort did not reach a significant difference. However, gene expression analysis of paired pre- and post-NAC showed a significant increase in TSPAN4 gene expression following chemotherapy in the majority of patients, suggesting that NAC induces TSPAN4 expression at the transcript level, even though these changes may not be fully reflected at the protein level in all patients. This minor discrepancy between protein and gene expression might only be statistical, given the relatively small sample number we utilized for immunohistochemical analysis. It could also be explained by the localization of TSPAN4, which can be trapped in the ER, Golgi, or secreted in endosomes/migrasomes with limited IHC detection resolution.
These observations align with accumulating evidence linking TSPAN4 and related tetraspanins to key processes in BC development, including progression, metastasis, and resistance to therapy. A pan-cancer analysis study revealed an aberrant TSPAN4 expression across various tumor tissues, including BC, which may indicate its potential role in cancer progression and a possible association with its methylation status. 15 Some studies showed a correlation between tetraspanin expression and BC development associated with poor prognosis, lymph node involvement, and metastasis (CD151 [TSPAN24], 57 CD63 [TSPAN30] and CD81 [TSPAN28]).58,59 Other studies demonstrated a stronger tetraspanin expression in BC tumor samples, however, it did not correlate with tumor grade, metastasis, and its receptor status 60 (TSPAN13 [NET-6] and TSPAN24). Moreover, other tetraspanins, e.g., TSPAN 29 (CD9), either showed no correlation with the clinicopathological characteristics of patients, 61 or as in the case of TSPAN27 (CD82/KAI) and TSPAN12, exhibited reduced levels correlated with higher BC progression and metastasis.62,63 In regards to a correlation between tetraspanins and chemoresistance in BC patients, a study by Zhu et al. 64 revealed that TSPAN8 overexpression was highly associated with treatment resistance and poorer prognosis in BC patients both in an in vivo and in vitro BC model. Another study showed that TSPAN24 was highly expressed in some BC cell lines, and its expression was further upregulated following chemotherapy treatment (e.g., camptothecin and gefitinib). 65 TSPAN4 has also been studied in other types of cancer. For instance, Zhao et al. 66 demonstrated that TSPAN4 expression was elevated in esophageal squamous cell carcinoma samples and was associated with enhanced chemoresistance. Another study showed TSPAN4 as one of the significantly upregulated genes in gastric cancer, both in publicly available gene expression data sets and in gastric cancer patients and correlated with disease progression and development. 67
The relationship between TSPAN4 expression and senescence-associated biomarkers following NAC was also studied using our samples and the GSEA data set. Based on two senescence markers- Lamin B1 and Ki67, 57% of samples with an increase in TSPAN4 level were senescence-positive. Similarly, in the GSEA data set using the eight senescence markers for TIS-positivity, NAG2 (gene encoding TSPAN4) showed moderate-to-strong positive correlations with all eight genes, where six of them were upregulated post-NAC (ATM, CCL5, MMP2, CDKN1A, IGFBP7, and CXCL14), while the other two (LMNB1 and MKI67) showed significant reduction. Interestingly, Zhao et al. 66 conducted a genome-scale CRISPR activation screening in human KYSE-180 cells to identify genes contributing to paclitaxel resistance in esophageal squamous cell carcinoma. Their research found that elevated TSPAN4 levels, along with senescence-associated markers CDKN1A and ELAVL2, were significantly correlated with resistance to both paclitaxel and cisplatin in ESCC tissues. Subsequent validation through qRT-PCR and western blot confirmed that overexpression of TSPAN4, CDKN1A, or ELAVL2 in ESCC cell lines inhibited chemotherapy-induced apoptosis, thereby promoting drug resistance. 66 Collectively, these results suggest a potential connection between elevated TSPAN4 expression and TIS in BC patients in response to NAC although further investigation is required.
A limitation of this study is the absence of TNBC cases in our cohort, as these patients are typically referred from the center where we conducted the analysis. Consequently, no paired pre- and post-NAC samples from TNBC were available for analysis at our center. This restricts generalizing our findings to all BC subtypes, particularly with respect to TSPAN4 expression. Moreover, a subset of Stage IV patients was included because, per our center’s protocol, selected metastatic cases receive NAC for local control.
Footnotes
Appendix
Correlation Between the Pathological Response to NAC, Senescence Status, and TSPAN4 Expression.
| Pathological response | Senescence-negative | Senescence-positive | Overall (N=38) | ||
|---|---|---|---|---|---|
| TSPAN4 non- upregulated (N=5) | TSPAN4 upregulated (N=7) | TSPAN4 non- upregulated (N=18) | TSPAN4 upregulated (N=8) | ||
| No response | 3 (60%) | 2 (28.6%) | 5 (27.8%) | 2 (25%) | 12 (31.6%) |
| Partial response | 1 (20%) | 2 (28.6%) | 12 (66.7%) | 6 (75%) | 21 (55.2%) |
| Unavailable | 1 (20.0%) | 3 (42.9%) | 1 (5.6%) | 0 (0%) | 5 (13.2%) |
Patients were stratified by senescence status and TSPAN4 expression into four groups. Among senescence-negative patients with non-upregulated TSPAN4 (n=5), 60% (n=3) showed no pathologic response, 20% (n=1) achieved a partial response, and 20% (n=1) could not be assessed due to unavailable data. In the upregulated TSPAN4 senescence-negative group (n=7), 28.6% (n=2) showed no response, 28.6% (n=2) achieved PR, and 42.9% (n=3) could not be assessed. Among senescence-positive patients with non-upregulated TSPAN4 (n=18), 66.7% (n=12) achieved PR, 27.8% (n=5) showed no response, and 5.6% (n=1) could not be assessed. Senescence-positive patients with upregulated TSPAN4 (n=8) demonstrated the highest response rate, with 75% (n=6) achieving PR and 25% (n=2) showing no response. In the overall cohort, 55.2% (n=21) achieved a partial response, 31.6% (n=12) showed no response, and 13.2% (n=5) could not be assessed due to data unavailability. No statistically significant difference in TSPAN4 expression levels was observed between patients with partial response and those with no response (p=0.452).
Acknowledgements
The authors thank Dr. Anas Abu Humaidan (The University of Jordan) and the Cell Therapy Center (CTC), The University of Jordan for providing access to their microscope facility. The authors extend their appreciation to the Ongoing Research Funding program (ORF-2025-786), King Saud University, Riyadh, Saudi Arabia for funding this research work. Co-authors SK and JF gratefully acknowledge CI-TASK, Gdansk, Poland’s high-performance Infrastructure PLGrid ACK Cyfronet Ares and ACK Cyfronet AGH for providing computer facilities and support within computational grant no plgneoantigen and plgmsneoantigens.
Author Contributions
TS contributed to the conceptualization, supervised the work, acquired funding and ethical approvals, and wrote the manuscript. SAS contributed to conceptualization, performed data analysis and contributed to writing the manuscript. KF conducted immunohistochemical staining in all experimental tissue samples and contributed to writing the manuscript. NM and RGN performed comprehensive literature review and wrote parts of the manuscript. AAM, SBA, MM, NAS, and SD conducted pathological diagnosis, assessment, and scoring of all experimental samples. AA and ME contributed to samples collection and tissue processing. JF, KW, SK, TH and JB contributed to the conceptualization and editing of the manuscript. MRA reviewed and edited the manuscript. AB contributed to funding acquisition and administrative supervision.
Competing Interests
The authors declared no potential conflicts of interest with respect to the research, authorship, and/or publication of this article.
Consent to Participate
In all institutions where parts or most of the study were conducted or samples were collected (KAUH), patients undergoing surgical resection for each condition had provided written, informed consent to donate any excess tissue beyond what was needed for diagnostic procedures for research purposes and agreed on publication of the related data.
Data Availability
Ethical Considerations
Tumor tissue samples, patients’ data, and experimental protocols were all approved by the IRB of KAUH (protocol: 35/170/2024). All research activities in this work were conducted in agreement with the ethical standards as laid down in the Declaration of Helsinki and with the institutional guidelines approved by The Hashemite University, The University of Jordan, and KAUH.
Funding
The authors disclosed receipt of the following financial support for the research, authorship, and/or publication of this article: K.F. and A.B. received funding through the Master’s Support Program of the Deanship of Scientific Research, The University of Jordan (grant #2024-228/2023). T.S. and S.A.S. were supported by the Deanship of Scientific Research at The Hashemite University, Zarqa, Jordan. T.S. is also supported by Arabian Gulf University. This research was funded in part by the International Research Agenda’s Program of the Foundation for Polish Science (MAB/2017/03), and supported by European Funds for Smart Economy 2021–2027 (FENG), Priority FENG.02 Innovation-friendly environment, Measure FENG.02.01 International Research Agendas in the frame of project “Science for Welfare, Innovations and Forceful Therapies (SWIFT)” no. FENG.02.01-IP.05–0031/23. We also thank the Polish Ministry of Science and Higher Education for support in maintaining the research equipment/research site, decision 58/596898/SPUB/SP/2024.