
Abstract
In increasingly competitive and global markets, public policy should be customer focused in terms of stressing resources, capabilities, and performance that are most important to the private sector and to other stakeholders. Although this requires a balancing act, it will help ensure successful public/private partnerships, performance outcomes that are customer driven, and planning and policy oversight that is performance based. The authors investigate the relative importance and availability of supply chain capabilities and performance measures for more than 3500 firms in three global regions: North America, Europe, and the Pacific Basin. The authors present additional analyses for best-practice firms that score the highest on an excellence index. The study finds that public policy–enabled customer service or, more broadly, demand-oriented performance capabilities may confer greater competitive advantages than cost- and supply-oriented performance capabilities, though both are important. The study findings have important implications for international public policy, such as trade policies, and for linking policy priorities with private sector requirements for specific capabilities, resources, and performance. The authors discuss additional managerial implications and recommendations for the integration of international marketing and global supply chain strategies with supporting marketing capabilities of standardization, adaptation, or customization and for governmental planning, policy formulation, and data availability.
Although widely acknowledged as important, the relationships between public policy and firm strategies and capabilities have received scant attention in the marketing and supply chain literature (Czinkota 2000; Hadjikhani and Ghauri 2001). This dearth is surprising, because public policy has been called a “driver” of firm choice of global strategy (Murtha and Lenway 1994; Yip 1989) or the fifth “p” for marketing-mix strategies and planning (e.g., Czinkota 2000; Sheth 2001). Similarly, from a value perspective, public policy has been labeled a crucial link in the value-added chain (Boddewyn 1988; Kogut 1985) and even a factor of production much like labor and capital (Boddewyn and Brewer 1994). Finally, and most important for this study's resource-based view (RBV), public policy is an important input or resource into the global marketing and supply chain networks and processes (Baird 1999; Conner 1991).
Figure 1 provides a simplified RBV model of input, processes, output, and outcomes for policy formulation that addresses stakeholder interests, including those of international marketers and logisticians (Baird 1999; Wegloop 1995). Although described subsequently for the public policy organization, the model in Figure 1 can be extended both to downstream businesses, agencies, “customers,” and stakeholders and to upstream suppliers and other governmental institutions. This model extension is the “output becomes input” perspective (Anderson and Kheam 1998; Baird 1999), or in the vernacular, “one person's output becomes another person's input.” Alternatively, an expanded model could represent a value chain or supply chain. As Boddewyn (1988, p. 350, emphasis added) aptly states, “the value-added chain includes beneficial government decisions as a necessary input without which upstream production and downstream marketing would come to naught.”
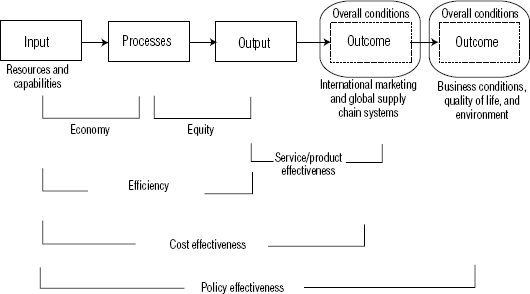
Resource-Based Public Policy Input/Output Model with Types of System Performance Measures
Input in Figure 1 is the resources used by the governmental institution, organization, or firm, including investment capital, materials, personnel, legislation, and data. These resources can also reflect either the capabilities of the organization or intangible resources such as knowledge, commitment, and influence (Del Canto and González 1999; Mowery, Oxley, and Silverman 1998). International marketing examples include brand equity and a firm's reputation or image. Processes in Figure 1 include all the activities and functions that transform the input (resources and capabilities) into output (e.g., services, products, international trade policies, export programs). In the processes, resources are consumed, capabilities are applied, and value is added.
Finally, outcomes occur when an organization's outputs are “delivered” to stakeholders, multinational enterprises (MNEs), other international businesses, other government agencies, users, and customers. As shown in Figure 1, first-level outcomes may be the supply chain infrastructure or international marketing networks. For example, lack of a proper transportation infrastructure can negatively affect the adjustment process of the marketing mix (Sheth 2001). Secondary outcomes shown in Figure 1 can be international business conditions such as market access and export regulations; quality of life; and environments such as transportation safety, congestion, and mobility. Shultz and Pecotich (1997) also point out that in developing countries, governments often provide tax incentives, import duty relief, export credits, favorable locations, and other incentives for firms that develop resources with mutually beneficial outcomes.
In total, governmental policy output and outcomes represent resources and potential input to the business community and MNEs that enable marketing and supply chain capabilities. As such, capabilities are a resource to MNEs, users, and “customers” but are (at least partially) an output/outcome of governmental public policy. The present research evaluates the relative importance to global firms of different supply chain capabilities enabled by public policy.
Background
Firms’ Resource- and Environment-Based Strategies
Supply chain capabilities and resources are the building blocks for supply chain strategy and a potential source of competitive advantage. Because firm capabilities and strategies are a major focus of this research, we briefly review the relevant body of RBV strategy literature. The RBV of the firm (Anderson and Kheam 1998; Barney 1991; Day 1994; Mowery, Oxley, and Silverman 1998; Wernerfelt 1984) proposes that a firm's internal resources or capabilities can serve as the basis for competitive advantage in a firm's strategy to achieve superior performance. In contrast, under the environmental approach (e.g., Porter 1985), a firm's superior performance is thought to depend on a favorable choice of industry or on a favorable position within an industry by means of cost leadership or differentiation.
From a managerial SWOT (strengths, weaknesses, opportunities, and threats) analysis perspective, several strategy researchers (e.g., Barney 1991; Black and Boal 1994) have pointed out that the RBV school stresses internal company strengths and weaknesses, whereas the environmental school stresses external market opportunities and threats. A reasonable resolution of these differing views is that they each represent “half a loaf.” The external environmental approach by itself has difficulty in explaining why firms would continue to achieve different levels of performance even though they are competing within the same industry and with the same strategy; industry structure alone appears to explain a relatively small percentage of the variance in firms’ performance (Black and Boal 1994). Conner (1991) expounds on these different views of strategy by pointing out that internal firm resources might be the real source of success. Porter (1996) himself may have shed new light on this issue by affirming that the choice of which activities to compete on is the essence of firm strategy. Of particular interest to the present research is that the activities mentioned by Porter seem to be closely tied to capabilities and resources associated with the RBV of the firm.
Resource-Based Theory and Firms’ Distinctive Capabilities
How is the RBV manifested within the firm? Day (1994) points out that resource-based theory presents two sources of competitive advantage and firm performance: firm assets and firm capabilities. Our focus here is on firm capabilities, or, more specifically, distinctive capabilities. Day states that distinctive capabilities are “complex bundles of skills and accumulated knowledge, exercised through organizational processes, that enable firms to make use of their assets … and … functions like a key success factor” (Day 1994, p. 38). He believes that these capabilities may provide a firm with a competitive advantage through a focus on customer value creation (Day 1994, p. 50). Capabilities are “the glue that brings … assets together and enables them to be deployed advantageously” (Day 1994, p. 38). Examples of distinctive capabilities are Wal-Mart's logistics capabilities and L.L. Bean's superior order fulfillment processes (Day 1994). Note that several of these capabilities mentioned by Day are supply chain capabilities, which are critical in a global environment.
Resource-based theory predicts that competition in the future will be based on core competencies, which can also be thought of as higher second-level aggregations of capabilities (Del Canto and González 1999). Core competencies enable firms to outperform competitors and represent competitive advantages for firms and potentially comparative advantages for nations (Kogut 1985). Most recently, Del Canto and González (1999), Mowery, Oxley, and Silverman (1998), and Anderson and Kheam (1998) have suggested that firms’ combined capabilities from collaborative relationships with both other firms and governments are strongly related to their chosen international strategies. In the present research, we also evaluate how resources and capabilities that are either demand-oriented or supply-oriented are related to global supply chain strategies.
Relationships between Public Policy Actors and International Business Actors
If a mutually beneficial public policy/private sector relationship exists, then marketing and supply chain integration means that public policy organizations and their output should be linked and aligned with the marketing and supply chain networks. Ideally, these links should be seamless, such as the facilitation of export practices and ease of transfer of capital, resources, and marketing exchanges (Keillor, Boller, and Ferrell 1997; Ring, Lenway, and Govekar 1990). Sheth (2001) argues that as markets become increasingly global, “borderless,” and interdependent (e.g., the European Union, alliances between trading blocs, global sourcing), the whole field of international marketing will gradually evolve toward integrated marketing, which will represent a paradigm shift. There is also a recognition that the global strategies of individual firms and supply chains are critical to the performance and success of a nation as a whole with respect to global markets (Anderson and Kheam 1998).
Figure 1 visually conveys the sequential nature of public policy decisions and actions and global marketing and supply chain outcomes. However, Figure 2 broadens the picture by showing that international business actors, including marketers and logisticians, and public policy actors, including government officials and political representatives, interact with each other over time as they build their relationships. Furthermore, resources and capabilities will also improve over time as the relationships and internationalization process progress. In particular, marketing and supply chain knowledge of foreign markets and of the related political processes in each country should increase commitment to international markets (Boddewyn 1988; Cavusgil 1984; Johanson and Vahlne 1990; Keillor, Boller, and Ferrell 1997). For example, in a study of large and small Swedish firms attempting to manage their relationships with political actors under the new European Union market protocol, Hadjikhani and Ghauri (2001) find that large firms have significant advantages in resources and knowledge and therefore in international market commitment over smaller exporting firms.

Dynamic Model of Actor Relationship Development for Resources and Capabilities
Specifically, large MNE firms with direct investment in several European Union countries are farther along in the internationalization process and have larger networks, knowledge of the political processes, and long-standing relationships with political actors in different countries (Hadjikhani and Ghauri 2001).
As Figure 2 suggests, the public/private relationships can be reciprocal as well, because public policy actors may depend on larger firms’ capabilities, such as technical marketing assistance and expert advice on exporting requirements and resources (Czinkota 2000; Shultz and Pecotich 1997). It can also be cumulative in the sense that resources and capabilities continue to develop and grow over time and become increasingly committed and specialized to the international markets and public policy relationships. On the negative side, Wegloop (1995, p. 417–18), in his RBV study of Danish international competitiveness, argues that idiosyncratic development of firm capabilities and organizational routines is inevitable because “firms will focus and lock out” (i.e., path dependency or “history matters”). Therefore, an additional government role of “national absorptive capacity” is needed, which he defines as the public institutions and actors that enable firms to recognize the value of new external information, assimilate it, and apply it to commercial ends in a “bottom-up” and nonsubsidizing manner. He believes that this will not only confer competitive advantages on a nation's firms but also build or maintain the comparative advantages of the nation or union as a whole (see also Kogut 1985; Murtha and Lenway 1994).
The bottom section of Figure 2 also suggests that as resources and capabilities increase over time, the potential level of the private/public internationalization relationship can also improve. For example, Hadjikhani and Ghauri (2001), in their study of Swedish exporting firms and political actors in the European Union, find that smaller exporting firms display bureaucratic adaptive behavior in trying to understand and follow the new European Union market rules. Essentially, their limited resources and capabilities serve as barriers to their moving from adaptive to influence relationships with policy actors, which we also reflect in Figure 2. In contrast, large MNEs with long-standing political relationships in many countries are at least able to move the relationship to the influence level. As suggested in our Figure 2, the descriptive matching levels for the two types of policy actor relationships are, respectively, authoritative and negotiation, with corresponding relationship outcomes shown in the middle column. Examples of policy negotiation concessions in other parts of the world, including some developing countries, might consist of export credits, accelerated customs clearance, export marketing advice, tax holidays, import duty relief, or guaranteed government loans (see, e.g., Kogut 1985; Shultz and Pecotich 1997).
A review of many international economic and marketing relationship studies, however, reveals that most studies label or describe political/international business actor relationships and outcomes at a low level of development, reflecting a conflict model that incorporates adversarial relations and zero-sum games (Boddewyn and Brewer 1994; Conner 1991; Murtha and Lenway 1994). This is represented as the lowest relationship level in Figure 2. For example, Ring, Lenway, and Govekar (1990) speak of threats and risks such as sovereign nation tariffs; import quotas; antidumping prohibitions; local content or ownership requirements; environmental standards; trade sanctions; and restrictions on currency transfers, countertrade, or technology transfers. In turn, Keillor, Boller, and Ferrell (1997) view this “political imperative” as a barrier to trade that inhibits the marketing mix and that may warrant forestalling and avoidance tactics.
Although these conditions may be the prevailing state of affairs, in principle there are no absolute reasons that business actors and public policy actors could not seek collaborative political relationships and partnerships that would result in win–win or even synergistic outcomes, as shown in the center portion of Figure 2. Examples of such synergistic outcomes might consist of tailored transportation infrastructure, customized and synchronized exporting procedures, or We-gloop's (1995) previous description of “national absorptive capacity.” Similarly, Boddewyn (1988, p. 347) has noted that people speak of “market opportunities and political risk as if there were not also political opportunities.” In summary, resources and capabilities drive the international relationship and vice versa, so that as the capabilities improve, the relationship may be elevated for global competitive advantage and mutually beneficial outcomes.
Supply Chain Performance
Supply chain strategies and their supporting resources and capabilities eventually result in supply chain performance. Supply chain performance is the “bottom line” for governmental planning, global public policy, and enterprise effectiveness, as implied in Figure 1. It is therefore critical that governmental planning and public policy continuously monitor private sector performance to determine the resources, capabilities, and performance measures that are deemed most important by stakeholders and are most readily available as performance metrics. The emphasis is on availability so as to be unobtrusive in data collection from the private sector and conserve resources, both of which are especially important considerations in increasingly deregulated global markets. Such an assessment is accomplished in the present study as part of a larger ongoing global logistics research stream.
It is clear that supply chain strategies necessitate particular capabilities and result in supply chain performance. However, it is public policy and governmental planning that enable supply chain capabilities and partially determine logistical performance, as represented in Figures 1 and 2. For example, public policy encourages private sector performance improvements through trade and intermodal policies, infrastructure investment and development, creative financing arrangements, tax incentives, safety regulation, public/private partnerships, and special programs and projects.
We report results from a continuing global logistics best-practice research stream that is being conducted at a major U.S. university (Michigan State University, Global Logistics Research Team 1995–2001). In particular, we investigate the relative importance, availability, and relevance of supply chain capabilities and performance measures that are affected by public policy and governmental planning. The relationships of performance capabilities to firm success and excellence are also covered for the three triad regions of North America, Europe, and the Pacific Basin (Ohmae 1985). After briefly describing the methodology in the next section, we describe the capability and performance results and then provide a discussion and conclusions. We also discuss the implications of supply chain strategies for international strategies such as global, multidomestic, international, and transnational (Bartlett and Ghoshal 2000; Prahalad and Doz 1999).
Methodology
For the identification and comparison of global capabilities and performance measurement practices, the research methodology had four phases. The first two phases involved surveys that had different objectives related to incremental learning, global base-case representativeness, benchmarking, and budgetary constraints. In the first phase, a survey instrument termed the baseline survey was mailed to approximately 22,000 firms to broadly assess supply chain trends across three global regions: North America, Europe, and the Pacific Basin. The baseline survey was a six-page questionnaire that was designed to identify representative and universal trends on a global basis and perceptions of supply chain concept importance and use (e.g., performance measurement, capabilities, supply chain strategies). As such, the intent was to gain a global understanding of base-case practices throughout the world, prioritize research concerns before the in-depth interviews, and use the knowledge gained to finalize the second-phase multisurvey workbook (i.e., incremental learning).
We developed the first-phase baseline questionnaire in conjunction with Council of Logistics Management type associations in each of 11 countries that have comparable group and industry memberships. For the Pacific Basin countries, we translated the questionnaire into each country's language and then back-translated it to ensure meaning equivalence across countries. We field-pretested the survey and then modified it on the basis of the new knowledge. The second-phase surveys and third-phase in-depth interviews were much more focused and targeted on best-practice firms and therefore had a strong benchmarking component (e.g., Camp 1998). The benchmarking perspective implies that much can be learned from studying the best-practice firms on a global basis. Even within this smaller group of 111 firms, we also used the top-third firms as a best-of-the-best or best-in-class benchmark for maximum learning (Camp 1998). Although funding for this project was ample, time, budgets, and spatial geography constrained the number of countries and best-practice firms to be interviewed, as discussed subsequently.
First-Phase Samples
The U.S. sample consisted of firms from the Council of Logistics Management, a major national professional association that broadly represents firms from 13 major categories, including manufacturers, wholesalers, retailers, service suppliers, and so forth. These firms are from many different industries, geographically represent all parts of the United States, and are inclusive of most major U.S. companies. For each foreign country, we selected the major analogous national professional association. To help identify these similar leading professional associations, we used the 16-member advisory board to the research team to achieve multiple source informant agreement. The associations selected have group and industry memberships, similar to the U.S. association, and are broadly representative of national coverage, channel position, and industry types. We also checked the countrywide mailing list rosters of these associations for comparability. However, these are not perfectly matched samples, because different countries have their own comparative and competitive advantages despite being diversified economies. Virtually all these association members have a major presence in their countries and represent most significant firms in their respective industries.
The top-level executives of each company were identified by the professional associations. The questionnaires along with the association's own letter of support were then sent to the entire membership of each professional association. Because of resource constraints, it was not possible to survey all foreign countries in each region. The European countries selected for participation were France, Germany, the Netherlands, Norway, Sweden, and the United Kingdom. The participating Pacific Basin countries were Australia, Japan, and Korea; North American countries were Canada and the United States.
We mailed 21,592 surveys, and 3693 were returned, for a response rate of approximately 20% in North America (1358 returns), 20% in the Pacific Basin (728 returns), and 15% in Europe (1607 returns). The response rate for each country is as follows: Canada, 21.9%; United States, 19.6%; Australia, 30.6%; Japan, 27.0%; Korea, 8.2%; France, 12.1%; Germany, 10.7%; Netherlands, 10.7%; Norway, 15.6%; Sweden, 7.0%; and United Kingdom, 20.8%. Investigation of characteristics of respondents and nonrespondents did not identify significant differences. Tests for measurement equivalence across cultures using optimal scaling (OPSCAL program of SAS) found no consistent pattern of cross-country equivalence bias in the use of the scales. We used five-point Likert-type scales.
In terms of demographics and descriptive statistics, approximately 80% of the firms in each country responded that their patent company's main headquarters was located in the same global region. The percentages of firms that also had business outside of their home region were 52% of North American firms, 35% of European firms, and 23% of Pacific Basin firms. Manufacturing firms were the largest group of all respondents, constituting 53% of firms in North America, 34% in Europe, and 44% in the Pacific Basin. Merchandisers and service suppliers were the next two largest groups in all global regions, accounting for the majority of the remaining respondents. As mentioned, professional associations were selected so that they would be widely representative of most industries in their country. The largest industries represented by region were as follows: 14% of North American respondent firms were in health and personal care (HPC) or pharmaceuticals/drugs, followed by industrial chemicals and plastics firms at 9%; the majority of European respondents were in food and beverages (22%), followed by HPC and pharmaceuticals/drugs; in the Pacific Basin, food and beverage firms also were in the majority (22%), followed by an approximately even division among automotive and transport firms, industrial chemicals and plastics firms, and HPC and pharmaceutical/drug companies.
Second-Phase Survey Workbook
The second phase of the research was the completion of a 24-page multisurvey workbook by a select group of 111 companies located in the sample countries. These firms were selected on the basis of expert panel judgment that they exhibited world-class best practices in logistics (i.e., benchmarking methodology; e.g., Camp 1998). The panel consisted of the global logistics research team's advisory board, whose 16 members are widely acknowledged for their global supply chain industry expertise, plus additional foreign logistics experts from each sample country. Half the sample was selected from North America, and the balance was equally divided between Europe and the Pacific Basin. Of the 111 firms, 22 are truly global manufacturers in that they conduct business in all three global regions and achieve more than 40% of their total sales from outside of their headquarters country.
In-Depth Interviews and Follow-Up Research
The third research phase consisted of in-depth interviews with these 111 companies. These interviews were conducted in each of the sample countries by different marketing/logistics professors accompanied by native speakers of each language who were knowledgeable about logistics. An index of excellence was developed by the research team, and each interviewer rated each company in ten areas of supply chain expertise on the basis of the in-depth interview notes and other information on the company. Each of the ten areas had four subcomponents, or drivers, that were evaluated so that there were 40 items total for each company. The result is an independent score by an expert that rates the participating firm. The range of scores was 70 to 185 points of a possible 200 points. Thus, each firm received an index excellence score, and the top third on this index were considered the best-of-the-best or best-in-class benchmark (Camp 1998). Note that the former second-phase workbooks were completed by the company representatives themselves. The fourth phase consisted of an additional survey replication so that trends could be assessed over time. Policy experts were also used to classify independently the supply chain capabilities and performance measures judged to be most affected by public policy decisions, and the measures that were retained represented interjudge agreement. A benchmark index of 35 non–policy-influenced supply chain performance measures was also constructed for comparison purposes.
Results
Performance Measurement Trends across Global Regions
Table 1 shows that across global regions, the majority of the approximately 3700 reporting firms have improved performance measurement capabilities over recent years. They have also increased the number, accuracy, and quality of these performance measures. North American and European firms are almost identical in reporting these trends (more than 80% agree on the first four items of Table 1), and both show a greater incidence of these increases than firms in the Pacific Basin (where 50% to 70% agree depending on the item).
Trends in Performance Measurement for North American, European, and Pacific Basin Firms

p ≤ .01.
p ≤ .001.
For example, using total cost analysis in managerial decision making, European firms lead North American and Pacific Basin firms in adopting this approach. Similarly, for using activity-based costing (ABC) in decision making, European firms lead Pacific Basin and North American firms, in that order. In contrast, for measures of customer satisfaction, North American firms report greater external measurement of customer satisfaction (46.8% agree) than European and Pacific Basin firms do. Pacific Basin firms are particularly low (only 21.8% agree) on this external customer satisfaction measurement. However, subsequent case study interviews and in-progress data updates suggest that this gap may be closing. In summary, all global firms report increased performance measurement capabilities, along with increased numbers of measures, improved accuracy, and enhanced quality of data. However, significant differences based on international distinction can be found. European firms make greater use of cost-based measures, and North American firms make greater use of customer satisfaction measures.
Importance of Performance Capabilities across Global Regions
Across global regions, Table 2 shows the relative importance of six major core logistical capabilities for firm success. All these capabilities are strongly affected by public policy, such as trade policies, deregulation, or the provision of transportation infrastructure. Somewhat surprisingly, the ranks for North American firms versus European and Pacific Basin firms are quite similar. Customer service is ranked first by North American, European, and Pacific Basin firms. Delivery reliability, which is one of the capability areas most directly affected by transportation policy and trade policies, ranks a close second in importance for firm success. In contrast, delivery speed, which is also affected by trade and transportation public policy, is ranked last in importance by North American firms and next to last by European and Pacific Basin firms. Essentially, delivery reliability and on-time performance appear to be more important than speed-of-delivery performance. This finding may provide guidance for trade and public freight transportation policymakers and planners in terms of what resources and capabilities the private sector deems most important in different regions or markets.
Importance of Logistical Capabilities for Supply Chain Success in North America, Europe, and the Pacific Basin

Rho statistic (rs) = .66, degrees of freedom = n - 2.
p ≤ .10.
Notes: Scale: 1 = “important,” 5 = “unimportant.”
The importance of low logistical costs is ranked in the middle by the interviewed firms. This finding is consistent with prior research in other subject areas, such as third-party and carrier selection research, for which cost is also ranked below the top. The North American firms rank it fourth of six, and the European and Pacific Basin firms rank it third in importance. This difference between means is statistically significant. The somewhat higher European and Pacific Basin ranking, which reflects a greater cost orientation, is also consistent with the regional findings in Table 1. For rankings alone, the biggest difference between North American firms and European and Pacific Basin firms is for flexibility in delivery, which was ranked third in importance by North American firms and last in importance by European and Pacific Basin firms. Apparently, flexibility in delivery is less important for European and Pacific Basin firms (or less possible given congestion and spatial conditions for European and Pacific Basin firms). In total, demand-side capabilities of customer service and delivery reliability appear more important for firm success than supply-side capabilities such as cost and productivity in all regions, though both categories are “order qualifiers.” Furthermore, these results should provide guidance for policymakers and planners in terms of establishing priorities for resource development, policy goals, objectives, programs, and measures.
Performance Capabilities of Top-Third Firms
Table 3 shows the performance of North American firms on a different and more detailed questionnaire list of 15 supply chain capabilities that are also strongly affected by public policy decisions, such as trade policies, provision and maintenance of rights of way, and deregulation. These performance capabilities are in the two categories of cost, or, more broadly, supply-oriented capabilities, and customer service, or demand-oriented capabilities. The first two columns in Table 3 compare the performance capabilities of the top third and bottom third of excellent index firms. The index score of excellence is explained in the “Methodology” section. The top-third firms can be considered the best-of-the-best benchmark firms, because all interview respondents were selected on the basis of an expert panel assessment of high-level logistical competence, as previously discussed.
Supply Chain Capabilities of Top-Third Excellence Index Firms on Public Policy–Influenced Variables
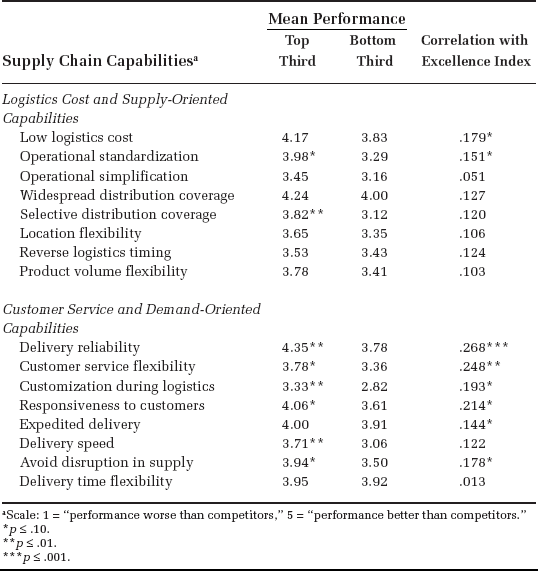
Scale: 1 = “performance worse than competitors,” 5 = “performance better than competitors.”
p ≤ .10.
p ≤ .01.
p ≤ .001.
Of the eight cost- and supply-oriented capabilities in Table 3, only operational standardization and selective distribution coverage are significantly better for top-third firms. However, for the eight customer service capabilities, six are significantly better for top-third firms. These include delivery reliability, customer service flexibility, customization during logistics, responsiveness to customers, delivery speed, and avoidance of disruptions in supply. A seventh customer service capability, expedited delivery, is directly and significantly correlated with the excellence index. Therefore, one overall interpretation of these results is that public policy benefits may be most apparent in the customer service area for top-third firms. It is also worth noting that the highest capability performance scores (≥4.0) for the top third of excellent firms are for delivery reliability (4.35 of 5), widespread distribution coverage (4.24), low logistics cost (4.17), responsiveness to customers (4.06), and expedited delivery (4.0). These findings possibly imply that in the current global and deregulated environment, firms must exhibit high levels of reliability and service, yet at relatively low logistics cost (rather than exhibit a trade-off mentality from the protectionist and regulation era).
The far right-hand column of Table 3 shows the direct correlation coefficients among the 15 supply chain capability measures and the overall index of firm excellence. The eight significant correlations between individual capability performance areas and the overall logistical excellence index include low logistics cost, operational standardization, delivery reliability, customer service flexibility, customization during logistics, responsiveness to customers, expedited delivery, and avoidance of disruption in supply. The last six again reflect customer service competitive advantages, consistent with the previous benchmarking and broad core capabilities results, which also showed greater competitive advantages from demand-side capabilities. Delivery reliability has the highest correlation with firm excellence in Table 3, followed by customer service flexibility and responsiveness to customers. One interpretation of these results is that these demand-side capability measures are most characteristic and predictive of excellent firms. A related interpretation is that public policy, such as resource allocation, trade policies, and transportation infrastructure, should target and facilitate improvement on these capability dimensions.
Cost and Customer Service Performance Outcome Measures
We followed the same procedure for 16 cost and customer service performance outcome measures that are strongly influenced by public policy and resultant resource allocations. We similarly compared the importance and information availability of these performance measures between top-third and bottom-third firms. In general, top-third firms evaluate most cost and customer service performance measures as both more important and more available than bottom-third firms do. The three most important cost measures for top-third firms are outbound freight cost, inventory turns, and inventory levels, in that order. These are also the three most available of all the cost information measures (available to more than 90% of top-third firms). The three most important customer service measures for top-third firms, in order of importance, are stockouts, on-time deliveries, and the proportion of perfect customer orders. Again, the first two of these measures are also the most available of all the customer service performance information measures to top-third firms (available to more than 90% of firms). In essence, information on cost and customer service performance measures that are most important to top-third firms is also most likely to be available. Thus, these findings provide guidance for public policy decision makers in terms of the importance, availability, and use of the most widely used performance measures in the private sector across a wide range of industries.
We also compared the 16 policy-influenced cost and customer service performance measures with relevant benchmarks involving 35 non–policy-influenced logistical performance measures, as is discussed in the “Methodology” section. The overall means of the customer service performance measures for both importance and information availability to top-third firms are significantly greater than the overall means for the cost performance measures. In addition, the customer service means are greater than the overall means for the nonpolicy benchmarks, which are not strongly influenced by resultant resource allocations. In contrast, the means for the cost performance measures on both importance and availability to top-third firms are not greater than those of their nonpolicy benchmarks. Therefore, similar to the previous capability results, global public policy may have the greatest impact on customer service and demand-oriented performance rather than cost- and supply-oriented performance.
Relationships between Supply Chain Strategies and Supporting Capabilities
Table 4 shows the relationships between supply chain strategies and capabilities. The supply chain strategies are operational excellence and customer closeness, and the supporting capabilities are supply-oriented and demand-oriented capabilities. On the basis of competing through specific value disciplines for competitive advantage (e.g., Porter 1985, 1996) and value congruency (i.e., fit), an operational excellence strategy would be expected to be primarily supported by supply-oriented capabilities while at least meeting minimum threshold levels on demand-side capabilities to be order qualified. In contrast, a customer closeness strategy would be expected to be supported particularly by demand-oriented capabilities while at least meeting the minimum requirements on supply-oriented capabilities.
Pearson Product-Moment Correlations for Supply Chain Strategies of Operational Excellence and Customer Closeness with Supporting Capabilities
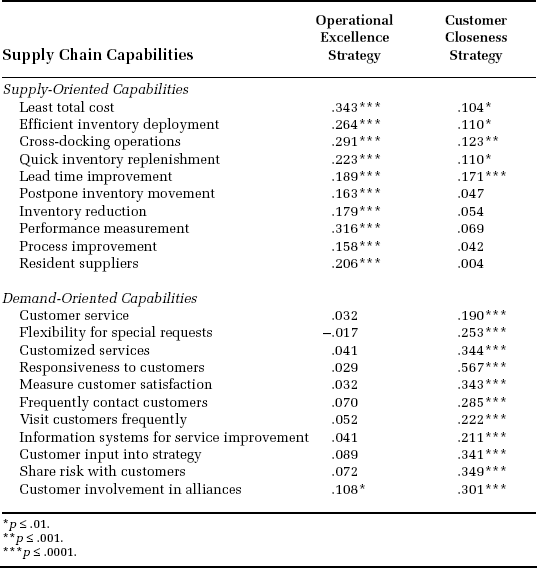
p ≤ .01.
p ≤ .001.
p ≤ .0001.
The top portion of Table 4 shows the product-moment correlations between supply-oriented capabilities and both operational excellence and customer closeness strategies. As expected, the supply-oriented capabilities are most strongly related to the operational excellence strategy. Least total cost has the strongest relationship with operational excellence, followed by performance measurement, which possibly suggests a crucial core competency. There is also some evidence of minimum acceptable thresholds of performance, because all correlations between supply-oriented capabilities and customer closeness are positive, though at low levels, and some are statistically significant given the large sample sizes.
The bottom portion of Table 4 shows the product-moment correlations between demand-oriented capabilities and both operational excellence and customer closeness strategies. Demand-oriented capabilities are even more strongly related to the customer closeness strategy than the supply-oriented capabilities are to the operational excellence strategy. These more uniform and stronger relationships possibly imply the particular importance of marketing-oriented and demand-satisfying capabilities for the customer closeness strategy. The strongest relationship for demand-oriented capabilities with customer closeness is responsiveness to customers, which again may imply a crucial core competency.
Discussion and Conclusions
Implications for Public Policy
In an environment of deregulation and increasingly competitive global markets, public policy must be linked to private sector resources, capabilities, measurement, and performance. As modeled in Figure 1, the RBV implies that public policy output and outcomes become crucial resources and input for private sector capabilities, global firm strategies, and ultimately performance. Similarly, a resource-based demand or marketing focus would require tailoring and linking this public sector intermediate output to private sector and stakeholder demand requirements, preferably evolving toward a collaborative relationship or partnership mode as shown in Figure 2.
Because public policy is part of both the value chain and the supply chain (Boddewyn 1988; Kogut 1985), ideally the links should increasingly become seamless, customer and stakeholder focused, and mutually reinforcing, as is also indicated in Figure 2. As others have addressed as well (Cavusgil 1984; Hadjikhani and Ghauri 2001; Johanson and Vahlne 1990), when the internationalization process progresses and related commitment, learning, and knowledge of international markets and the political processes increase, relationships and supply chain resources and capabilities should also improve over time. Essentially, this means that as the business actors and public policy actors dynamically interact, the relationship may be elevated gradually for mutual benefit and competitive advantage. This study's interviews in different countries also indicate that a common feature of successful public/private partnerships is a willingness to share resources and capabilities among the partners to achieve common goals and mutually beneficial outcomes. Although this may not be the typical political behavior of businesses and governments (e.g., Keillor, Boller, and Ferrell 1997; Murtha and Lenway 1994; Ring, Lenway, and Govekar 1990), the potential is there. As Kogut (1985, p. 36) has succinctly stated, “global strategies rest on the interplay of the competitive advantages of firms and the comparative advantages of countries.” This interplay must be collaborative and mutually reinforcing to achieve synergistic rather than conflicting outcomes.
As this study reveals, performance measurement capabilities of firms have increased across North America, Europe, and the Pacific Basin. These improved measurement capabilities include increased accuracy, quality, types, and numbers of measures. In general, the increased importance and availability of performance measures are greatest for global firms that score the highest on an excellence index. Thus, performance measurement becomes a distinctive competence for excellent firms, that is, the best of the best. The present research also finds that European firms more frequently stress cost performance measures, whereas North American firms stress customer satisfaction measures. However, respondents in all regions indicate that both cost and service capabilities are important. Therefore, both are critical issues for public policymakers in a global marketplace.
Public policy, planning, and partnerships can have profound effects on supply chain capabilities such as reliability and speed. An important aspect of this research is that North American, European, and Pacific Basin firms are all in remarkable agreement as to what supply chain capabilities are most important for firm success. Customer service, which can reflect measures such as on-time performance, stockout avoidance, and replenishment time, is ranked first in importance, and delivery reliability is ranked a close second in importance by all global regions. Delivery reliability is also the most strongly related statistically to the excellence index for all public policy–influenced capability measures, as are demand-oriented capabilities in general. Thus, policies that stress demand-oriented capabilities such as delivery reliability and customer service appear to confer the greatest competitive advantages in a global marketplace.
Also influenced by public policy, both low logistics cost and delivery flexibility are ranked in the middle for success, though cost is rated slightly higher by European and Pacific Basin firms and flexibility is rated slightly higher by North American firms. However, over time, delivery flexibility is increasing most rapidly in perceived importance to U.S. firms, which is discussed subsequently. Surprisingly, delivery speed is ranked last in importance by North American firms and next to last by European and Pacific Basin firms for success. However, it is well above the midpoint in importance to leading-edge firms, and top-third excellent firms perform significantly better on it than bottom-third firms do. Nevertheless, when resources are scarce, it appears that trade and freight transportation policy and plans should stress reliability over speed in terms of setting priorities. It is much easier for international firms to synchronize their marketing and production plans to slower but time-definite deliveries than to fast yet unreliable deliveries that are frequently caused by infrastructure bottlenecks and congestion. With deregulated markets and global supply chains, customers increasingly require excellence in both areas. Low logistics costs should receive mid-level priority in freight transportation planning, public policy formulation, and performance appraisal.
Future Trends
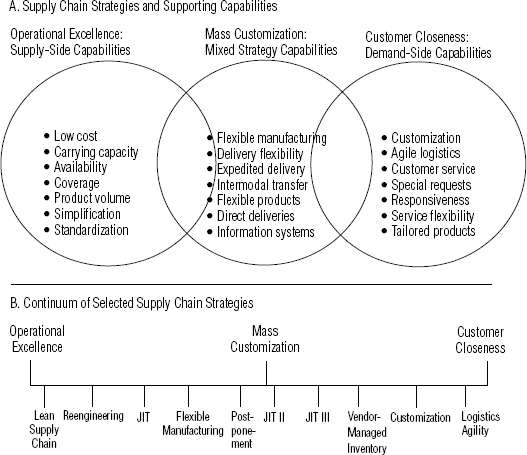
In general, global public policy is important because it engenders and enables supply chain capabilities. At the present time, resources related to trade policies, infrastructure development, intermodal connectors, and information technology are especially increasing in importance for several reasons. First, global public policy facilitates supply chain relationships such as trading partnerships and strategic alliances that allow for optimum role assignments and collaborative relationships in the global channel. Second, global public policy may allow for the best combination of capabilities from two or more trading partners or modes of transportation. As such, public policies may remove bottlenecks and barriers to intermodal or intermediary transaction integration of trade and transaction flows. This integration translates into seamless service and product offerings for customers and users and thus customer satisfaction. Third, global public policy particularly fosters the emerging and increasingly important capabilities of delivery flexibility, responsiveness to customers, expedited delivery, intermodal transfers, and information systems such as e-business. As suggested in Figure 3 and by this study's findings, these capabilities particularly support popular global supply chain managerial strategies of customer closeness (e.g., customized, segmental, or agile logistics) and mass customization. These global supply chain strategies are discussed next in the context of study findings.
Global Supply Chain Strategies and Capabilities
Implications for Managers
There is currently a trend toward greater reliance on customer closeness strategies in general, as evidenced by this study's findings of greater prominence of demand-oriented capabilities and performance. The present research also found that customer closeness is particularly supported by responsiveness to customers and customization. Presently, some supply chains are also experimenting with mass customization, which is a mixed strategy that attempts to combine operational excellence with customer closeness, as shown in Figure 3. These innovative strategies and their relationships to supporting capabilities are represented by the top portion of Figure 3, which shows the types of capabilities firms are most likely to rely on to achieve this “best of both worlds.” The center overlapping capabilities are most important for mass customization strategies and particularly reflect both flexibility and information systems for product visibility and order fulfillment. Especially important supporting capabilities for customer closeness strategies are summarized in the circle on the right-hand side, and those for operational excellence strategies are summarized in the left-hand circle.
Contemporary supply chain examples of mass customization practices include postponement of commitment to product form, assembly, or forward movement and intermittent acceleration and deceleration of product flows to sort, sequence, and synchronize product with changing customer requirements and international marketing plans (e.g., expedited delivery). These strategies are often accompanied by real-time order information systems; collaborative planning and forecasting; vendor-managed inventory; resident supplier employees as buyers, which is known as just-in-time II (i.e., JIT II); flexible or agile manufacturing; and locating suppliers’ production lines on the customer's premises (i.e., JIT III). A sampling of these strategies and practices is schematically shown along a continuum in the bottom section of Figure 3. Those near the middle are closest to mass customization as mixed strategies, whereas those closest to the ends approach pure strategies of either operational excellence or customer closeness. As such, global public policy becomes increasingly more important in order to foster the “correct” resources and capabilities or allow for mass customization on an international basis.
Implications for International Strategies and Marketing Capabilities
The parallels between international strategies and global supply chain strategies are shown in Figure 4. The strategy types are arrayed along a separate continuum for each subject. The strategies are shown on the top of each continuum, and major supporting core competencies are shown on the bottom of each continuum. We briefly define terms for international strategies and draw the implications.
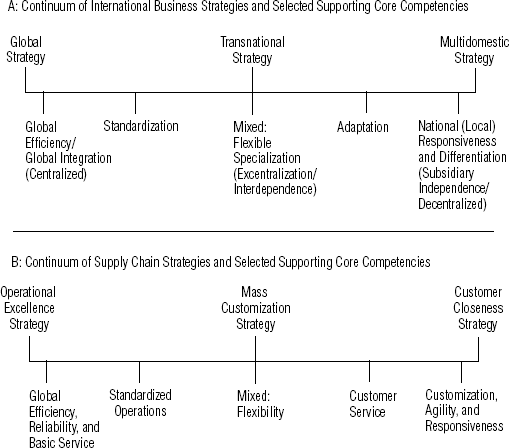
Parallels Between International Marketing and Global Supply Chain Strategies and Core Competencies
As the international strategies in Panel A of Figure 4 show, a global strategy attempts to leverage cost advantages through global scale efficiencies by concentrating resources and capabilities often centrally in the home country (Bartlett and Ghoshal 2000; Prahalad and Doz 1999). In contrast, the multidomestic strategy stresses multinational product/service differentiation and local responsiveness by allowing local subsidiaries a great deal of independence and through dispersed or duplicated resources and capabilities. The international strategy can be thought of as a separate additional dimension for innovation (not shown in Figure 4); can be collapsed onto the left-hand side when firms leverage centralized learning, research and development, and knowledge (much like scale economies); or can be collapsed onto the right-hand side of the continuum for autonomous local learning. Finally, the transnational strategy in Figure 4 is a combination or mixed strategy that attempts to achieve simultaneously the three capabilities of efficiency, responsiveness, and innovation (Bartlett and Ghoshal 2000). It does this through a complex global configuration of specialized and interdependent resources, capabilities, and assets that resembles a physical network. As such, some resources and capabilities are best centralized in the home country; others are best decentralized to local host countries; and others are “excentralized” to a third country for intermediate production, possibly with high labor content (e.g., offshore production in Malaysia or maquiladoras in Mexico).
In terms of implications, our suggested reason for the parallel development and similarities in strategies between the top and bottom sections in Figure 4 is that global supply chain strategies support the corresponding international strategies so that similar concepts and parallel flows should be linked. We would expect an operational excellence strategy to support a global strategy and a customer closeness strategy to support a multidomestic strategy. Mass customization and the transnational strategy are both mixed or hybrid strategies, and the transnational strategy has been referred to as a combination approach to customer relationship marketing. As such, Halliburton and Jones (1994, pp. 83–84) have referred to mass customization and “global one-to-one marketing,” or the transnational approach, together as “global individualism” and “twin aspects of the same phenomenon from two disciplines.” However, even more ambitious than this, the international marketing and supply chain strategies can be developed together and integrated simultaneously so as to achieve unique solutions and synergistic outcomes for customers that might result in competitive advantages for the value chain as a whole. Such a collaborative perspective implies competition among value chains rather than among firms, per se.
The supporting capabilities of standardization and adaptation are also positioned on the continuum in Figure 4, and parallels are again apparent between the international and supply chain capabilities. The standardization, adaptation, and customization debate has persisted for some time in international marketing (e.g., Cavusgil and Zou 1994; Kogut 1985; Levitt 1983; Samiee and Roth 1992; Solberg 2000; Yip 1989). For supply chains, the present research found that standardization of operations (but not simplification) was significantly associated with the excellence index, and supply chain customization during logistics and customer service flexibility were even more strongly related. However, more broadly, the study found that supply-oriented capabilities in general (such as standardization) more often supported an operational excellence strategy, whereas demand-oriented capabilities (such as customization and customer service) more often supported a customer closeness strategy. These findings are reflected in the bottom of Figure 4 and may suggest additional implications for international marketing capabilities, as discussed next.
Theodore Levitt (1983) was one of the first and most vocal proponents of standardized products, manufacturing, and marketing. In his words (p. 94, emphasis added), “trouble increasingly stalks companies that lack clarified global focus and remain inattentive to the economics of simplicity and standardization.” Since that time, several studies have tested for the desirability of standardization/adaptation/customization, with conflicting results (Samiee and Roth 1992). This ambiguity has been attributed to differences in the environments faced (Cavusgil and Zou 1994), the relative extent of knowledge and learning achieved (Kogut 1985; Solberg 2000), the specific marketing-mix element under consideration (Yip 1989), and the specific location on the value chain (Kogut 1985). This study's findings and Figure 4 suggest other possible reasons for inconsistent results as well. The efficacy of standardization, adaptation, and customization should depend on the underlying strategy being supported, its fit with that strategy and with the dominant value discipline being competed on, and whether the demand-chain or the supply-chain is being considered. Figure 4 summarizes the suggested relationships and is intended as a potential model for further research on these issues and those discussed subsequently.
Limitations and Further Research
One possible study limitation is that though a customer focus-, partnership-, and performance-based model of public policy is an emerging and increasingly popular paradigm (Baird 1999), it is not the only relationship paradigm (as indicated in Figure 2). As does any orientation or approach, it has its limits if blindly carried too far. Second, although the private sector investigated in this research is an important public policy constituency, it is not the only stakeholder group. For example, Figure 1 represents that equity (e.g., equal market access, truth in advertising) and policy effectiveness (e.g., quality of life, sustainable development and resources) are important performance dimensions. As always, informed public policy must listen, consider, weigh, and balance competing interests and alternative viewpoints. The danger is often in the opposite direction as well, in that policymakers will not take sufficient heed of the “public interest” and will not be accountable to any group. In addition, private sector success in the areas of international marketing and global supply chains often results in other economic, social, environmental, and public affairs goals being advanced as well (e.g., through increases in employment, taxes, standards of living, resources and capabilities, comparative advantages, and political influence). Third, the researchers recognize that every country has its own idiosyncratic culture, history, values, norms, and policy predilections. This article's treatment of public policy and managerial recommendations is intended to be at a sufficiently high level of generalization to allow for its tailoring and adaptation to individual nations.
Finally, Figure 4 shows the integration parallels between an international strategy/marketing capability continuum and the supporting global supply chain strategy/capability continuum. Although it is beyond the scope of this research, a third country continuum could be added to Figure 4 with a pure command economy located on the far left-hand side and a pure market economy located on the far right-hand side. Pure economies have probably never existed; the United States and the former Soviet Union possibly represent the most diametric examples. Nevertheless, it has been known for some time that countries could be arrayed along such a continuum; the most recent effort is Murtha and Lenway's (1994). The current trend is toward market economies (e.g., Czinkota 2000; Shultz and Pecotich 1997), in which countries reposition themselves toward the right-hand side of such a continuum, though the “pendulum” may not always swing in that direction (i.e., if, in the future, the relative importance of different system performance measures changes in Figure 1).
In the overall context of Figure 4, the trend toward market economies raises some interesting questions for further research. Is there a corresponding change in international marketing strategies and supporting global supply chain strategies and capabilities to reflect these macro development changes? For example, Murtha and Lenway (1994) suggest that firms from planned or command economies typically compete globally on the basis of cost advantages, whereas firms from market economies often compete on the basis of flexibility advantages. The present research identifies global supply chain trends toward substantially increasing reliance on demand-oriented capabilities of delivery flexibility, responsiveness to customers, and customer service flexibility. These capabilities also tend to support the increasingly popular supply chain strategies of customer closeness and mass customization, as previously indicated. Are these identified trends associated with the movement toward market economies, toward global and integrated markets (e.g., Sheth 2001), and toward borderless transactions and exchanges? These related study findings may represent the “tip of the iceberg” and a fruitful avenue for further research in terms of linking country comparative advantages on specific resources and capabilities with firm global marketing and supply chain competitive advantages for specific strategies and capabilities.
Footnotes
Acknowledgments
The authors thank their colleagues, Tamer Cavusgil and Stewart Miller of Michigan State University, for their suggestions on research directions. This research is also part of the larger ongoing Global Logistics Best Practices Research stream being conducted at Michigan State. The authors also thank Steven Clinton of Arizona State University and Michael Fournier of General Motors Inc. for research assistance. Most important, the authors appreciate the comments of the two anonymous JIM reviewers, who improved the article immeasurably.