
Abstract
Because of suggested beneficial effects of word-of-mouth (WOM) referral, service companies have invested large amounts of money in customer referral programs as well as programs aimed at fostering positive communication among their existing customers. The question of cross-cultural differences in the effectiveness of WOM has recently gained increased prominence. The authors contribute to research on this topic by proposing a positive effect of received WOM on service quality perceptions among existing customers. Moreover, they predict that cultural values moderate this effect. They test the model on 1910 bank customers in 11 countries. The results show that received WOM has a positive effect on customer service quality perceptions. Furthermore, received WOM has a stronger effect on the evaluation of customers in high-uncertainty-avoidance than in low-uncertainty-avoidance cultures. No other cultural value is a significant moderator. The results imply that received WOM is also important to existing customers and that managers should adjust their strategy of referral marketing to match their target group's uncertainty-avoidance level.
Such an effect may also differ significantly across regions or countries. Thus, global service providers need to consider potential differences in the effect strength of received WOM on customers’ service quality perceptions across countries. Although cross-cultural differences in the evaluation of service providers have recently gained increased research interest (Zhang, Beatty, and Walsh 2008), cross-cultural service research cannot sufficiently answer this question. Prior research on cross-cultural differences in the effect of WOM has addressed only customer choice processes (e.g., Money, Gilly, and Graham 1998), product diffusion (e.g., Dwyer, Mesak, and Hsu 2005), and the general willingness of customers to engage in WOM (Lam, Lee, and Mizerski 2009). Missing completely thus far is research on the moderating effect of culture on the link between received WOM and customer evaluations among existing customers.
Our aim is to address these issues and to contribute to existing research in two ways. First, we examine the effect of received WOM on customers’ service quality perceptions. Second, we explore the moderating effects of cultural values on the effect of received WOM on customers’ service quality perceptions. The results of this study should help international service providers adjust their WOM strategy to fit their specific target groups in different countries, thereby optimizing their allocation of marketing resources. We conduct the analysis in the context of professional service using survey data from customers in 11 countries on four continents.
Effect of Received Wom Referral on Service Quality Perceptions in Service Relationships
It is widely accepted that services are more difficult to evaluate and expose customers to greater risks than products (Murray and Schlacter 1990; Zeithaml 1981). This trait applies particularly to professional services, such as medical, legal, and banking services. In professional services, customers perceive greater risk and vulnerability because they lack the experience and knowledge to fully understand and confidently evaluate the service results (Ostrom and Iacobucci 1995; Sharma and Patterson 1999). To reduce the greater risk associated with services, service customers have a decreased preference for outright purchase and depend less on observation or trial (Murray 1991). Instead, they engage to a larger extent in information acquisition activities when evaluating service providers. When doing so, they prefer personal sources, such as referrals by friends, to impersonal sources, such as commercials, because they have more confidence in personal sources and find them to be more effective than impersonal sources, such as mass media. Therefore, WOM, as “informal communications directed at other consumers about the … usage, or characteristics of particular … services and/or their sellers” (Westbrook 1987, p. 261), is a powerful information source in services (Zeithaml and Bitner 1996).
Prior research on social influence indicates that people are susceptible to interpersonal influence (Asch 1951; Sherif 1935). Using this research, Venkatesan (1966) studies the effect of interpersonal influence in the context of a consumer decision-making situation. He reveals that customers asked to pick the best suit from among three identical suits made decisions in accordance with an instructed reference group. Subsequently, marketing research has repeatedly shown that received WOM influences customer evaluations of products (Bone 1995; Burnkrant and Cousineau 1975; Herr, Kardes, and Kim 1991; Pincus and Waters 1977) and services (Burzynski and Bayer 1977). Burzynski and Bayer (1977) find that moviegoers exposed to positive WOM before watching a movie expressed more positive evaluations of the film than moviegoers exposed to negative WOM.
Although it could be argued that the effect of received WOM referral becomes less important if customers already have their own prior consumption experiences, initial evidence exists that this is not the case. Herr, Kardes, and Kim (1991) show in a product context that the positive impact of received WOM on the evaluation of computers is also valid in situations in which customers have their own prior consumption experiences. They explain the phenomenon with the accessibility– diagnosticity model (Feldman and Lynch 1988; Lynch, Marmorstein, and Weingold 1988), according to which the impact of specific pieces of information depends partly on their accessibility from memory. This accessibility is increased by the vividness of the information, and a particularly vivid way of receiving information is WOM. This positive effect of received WOM should not be restricted to the evaluation of products but also applies to service quality perceptions of customers in service relationships who have a history of prior consumption experiences with a service. Therefore, we propose the following:
H1: Among customers in existing service relationships, higher levels of received WOM referral result in greater service quality perceptions.
Moderating Effects of Cultural Values on the Impact of Received WOM Referral on Customers’ Quality Perceptions in Service Relationships
Culture can be defined as “the collective programming of the mind, which distinguishes the members of one group from another” (Hofstede 2001, p. 9), and has repeatedly been shown to influence consumer cognitions and behavior (McCort and Malhotra 1993; Triandis 1972). In line with this thought, we propose that cultural values moderate the effect of received WOM on customers’ service quality perceptions. Figure 1 depicts the proposed research model.

Research Model
Research findings on differences in the impact of WOM across countries indicate that cultural values moderate the cognitive processing of received WOM and, thus, the relevance that customers attribute to received WOM. Money, Gilly, and Graham (1998) find that Japanese business customers consult more referral sources in choosing a service provider than American business customers. In the context of electronic discussion boards, Chinese participants engage to a greater extent in information-seeking behavior than their American counterparts (Fong and Burton 2008). Among existing customers, received WOM has a stronger effect on customers’ switching behavior in Japan than in the United States (Money 2004). In the following sections, we derive hypotheses on the moderating effects of cultural values on the impact of WOM on customers’ quality perceptions in service relationships. We focus on Hofstede's (2001) four original cultural values—power distance, uncertainty avoidance, individualism/collectivism, and masculinity/ femininity—which have been used in prior cross-cultural WOM research (e.g., Dawar, Parker, and Price 1996; Lam, Lee, and Mizerski 2009).
Power Distance
Power distance reflects the way a culture handles inequality (Hofstede 2001). As a measure of interpersonal power and influence, it reflects the view of the less powerful member of a hierarchy. People in high-power-distance cultures share norms for differential prestige, power, and wealth, as well as the belief that talents and capabilities are unequally distributed across society (Hofstede 2001). This inequality may pertain to physical and mental characteristics, social status and prestige, wealth, power, or rules. The norms for differential prestige, power, and wealth in high-power-distance cultures often are expressed by authoritarian values and support for conformity (Hofstede 2001). Research findings have repeatedly shown that people in high-power-distance cultures engage in more information acquisition behavior than people in low-power-distance cultures (Dawar, Parker, and Price 1996; Lam, Lee, and Mizerski 2009). Lam, Lee, and Mizerski (2009) argue that this behavior can be explained by the higher external locus of control among people in high-power-distance cultures, which makes them prone to information search behavior in their decision making. In contrast, Dawar, Parker, and Price (1996) argue that people in high-power-distance cultures have a distrust of others because they are aware that power that rests in people is often coercive and not legitimately based. Therefore, in high-power-distance cultures, authorities are accepted but not necessarily trusted. Empirical findings show that people in high-power-distance cultures rely less on impersonal information sources, such as salespeople, than on personal information sources (Dawar, Parker, and Price 1996).
In contrast, people in low-power-distance cultures adopt a norm for more equal distribution of prestige, power, and wealth. In their opinion, inequality in a society should be minimized. Thus, people in low-power-distance cultures—especially national elites—hold relatively antiauthoritarian values. People in low-power-distance cultures are more prone to impersonal information acquisition (Dawar, Parker, and Price 1996). Moreover, they should be more comfortable with making evaluations based on their own experiences because of their higher internal locus of control (Lam, Lee, and Mizerski 2009). Therefore, we suggest the following:
H2: The effect of received WOM referral on customer service quality perceptions is greater for customers in high-power-distance cultures than for customers in low-power-distance cultures.
Uncertainty Avoidance
Uncertainty avoidance is expressed as the tolerance for unstructured, ambiguous, or unpredictable future events (Hofstede 2001). Hofstede (2001) states that the unpredictability of the future is a given fact of human existence, of which all people are conscious. However, people in different cultures deal with this fact in different ways.
High-uncertainty-avoidance cultures are characterized by a need to reduce ambiguity and risk (Kale and Barns 1992), which is manifested in a high prevalence of strict rules and regulations. Compared with people in low-uncertainty-avoidance cultures, members of high-uncertainty-avoidance cultures perceive life more as a threat and experience higher levels of anxiety. To lower this anxiety, they should be more motivated to reduce the perceived ambiguity and uncertainty of life (Doney, Cannon, and Mullen 1998). A way to reduce ambiguity and uncertainty in the context of services is to seek advice or assurance from trusted others. Consistent with this notion, high uncertainty avoidance is associated with a higher level of opinion-sharing (Lam, Lee, and Mizerski 2009; Liu, Furrer, and Sudharshan 2001), as well as opinion-seeking (Dawar, Parker, and Price 1996; Money, Gilly, and Graham 1998), behavior. In the context of service relationships, this level would suggest more reliance on received WOM referral from reliable others who already have experience with or knowledge of the service when evaluating a provider's service quality. People in high-uncertainty-avoidance cultures will also seek these referrals in already existing service relationships because they want to reassure themselves of their opinion about the service provider.
In low-uncertainty-avoidance cultures, anxiety can be reduced through passive relaxation; thus, people are expected to control their emotions (Hofstede 2001). Moreover, low-uncertainty-avoidance cultures are characterized by a greater openness to change and new ideas, making people more comfortable with ambiguity and chaos. People in low-uncertainty-avoidance cultures often embrace diversity and are more curious about things that do not conform to the norm. Finally, people in low-uncertainty-avoidance cultures have a greater belief that they can influence their own lives and the world in general (Hofstede 2001). Therefore, they are less engaged in information acquisition behavior (Dawar, Parker, and Price 1996; Money, Gilly, and Graham 1998) and should be less susceptible to external influences on their consumer behavior and cognitions. Therefore, we predict the following:
H3: The effect of received WOM referral on customer service quality perceptions is greater for customers in high-uncertainty-avoidance cultures than for customers in low-uncertainty-avoidance cultures.
Individualism/Collectivism
According to Hofstede's (2001) definition, individualism/ collectivism reflects a culture's relation to individual goals and accomplishments. The core origins and characteristics of this dimension are differences in family units and the extent to which they influence people's lives and everyday behavior. Whereas in individualist cultures, the most important distinction is between self and others, in collectivist cultures, the self is always defined in the context of social networks, and the important distinction is the line between in-group and out-group. Collectivists are characterized by a “we” consciousness, which means that their identity is based on the social system in which they are embedded. Moreover, Hofstede argues that collectivist cultures are characterized by high-context communication (Hall 1976) because the tightly knit social system encompasses many rules that regulate people's behavior.
In contrast, individualists live in a society in which everyone is supposed to take care of him- or herself and his or her immediate family only. These cultures are characterized by a strong “I” consciousness and the emotional independence of individuals from institutions and organizations. Parsons and Shils (1951) characterize individualist cultures by their strong self-orientation. Furthermore, individualist cultures are characterized by low-context communication (Hall 1976). Without strong group norms and regulations, the social context in which communication takes place indicates little information. Therefore, individualists need to communicate more openly and directly about what they have to say.
There are contrasting opinions and findings on the effect of individualism on customer information acquisition behavior. Dawar, Parker, and Price (1996) argue that individualists engage in more information acquisition behavior and explain this by the higher level of initiative among people in individualist cultures. However, they do not find empirical support for their claim. Other findings on higher information acquisition behavior pertain to the use of external information sources (Lam, Lee, and Mizerski 2009). Most authors argue and find evidence for more pronounced information sharing and acquisition behavior among people in collectivist cultures (Dwyer, Mesak, and Hsu 2005; Fong and Burton 2008; Liu, Furrer, and Sudharshan 2001; Money, Gilly, and Graham 1998). The rationale behind this is that collectivist cultures have stronger social ties and are more cohesive than individualist cultures. Therefore, people in collectivist cultures are more likely to share information and allow reference groups to influence their decision making (Doran 2002). We argue that received WOM referral should also influence customer evaluations of their service provider. Therefore, we propose the following:
H4: The effect of received WOM referral on customer service quality perceptions is greater for customers in collectivist cultures than for customers in individualist cultures.
Masculinity/Femininity
The masculinity/femininity dimension reflects how a culture defines and deals with the gender roles of men and women (Hofstede 2001). Whereas in more masculine cultures, men adhere to traditionally masculine gender roles and only women adopt the feminine roles, in more feminine cultures, both men and women adhere to traditionally feminine gender roles. Therefore, masculinity/ femininity refers to the way “tough” values (e.g., assertiveness, success, competition) dominate “tender” values (e.g., solidarity, nurturance, service) (Hofstede 2001).
Feminine cultures are characterized by a stronger relationship orientation. For them, the quality of life and people are more important. They stress who a person is, and they work to live rather than the other way around. Moreover, Hofstede (2001) characterizes feminine cultures as having sympathy for the weak and perceiving small and slow things as beautiful.
Cultures high in masculinity are characterized by a stronger ego orientation, such that people define themselves and their reason for being according to their work and money or belongings. Hofstede (2001) also characterizes masculine cultures as sympathetic to the strong and perceiving big and fast things as beautiful. Because of the materialistic and possession-oriented nature of masculine cultures, researchers have proposed and found evidence for higher levels of information sharing as well as information acquisition activities (Dwyer, Mesak, and Hsu 2005; Lam, Lee, and Mizerski 2009; Liu, Furrer, and Sudharshan 2001). Belongings are highly valued in masculine cultures because they reflect success and status. People define themselves much more through their possessions and therefore place a greater emphasis on information associated with these possessions (Dwyer, Mesak, and Hsu 2005). This should also be valid for service relationships, which are part of the materialistic mind-set of people in masculine cultures. Therefore, we suggest the following:
H5: The effect of received WOM referral on customer service quality perceptions is greater for customers in more masculine cultures than for customers in more feminine cultures.
Method
Study Context
We chose retail banking as our research setting for several reasons. First, it is one of the most internationalized service industries (Zeithaml and Bitner 1996). Second, retail banking services are relatively comparable across different countries (Malhotra et al. 2005), which ensures functional equivalence (Sekaran 1983). We collected data in 11 countries on four continents and chose countries that vary considerably according to Hofstede's (2001) cultural framework and their gross national income based on purchasing power parity per capita (GNI/PPP; World Bank 2009). The sample consists of business students from leading universities and business schools in the respective countries. A sample of business students is appropriate in this context because business students constitute a well-defined target group that is homogeneous and, therefore, highly comparable across countries (Erdem, Swait, and Valenzuela 2006). With this sample, we also ensure subject pool equivalence (Alden, Steenkamp, and Batra 1999), which minimizes the effect of other potentially influential factors, such as education, social status, family status, wealth, and age (Bearden, Money, and Nevins 2006). Moreover, students are appropriate because our study is based on theory with hypotheses at a fundamental cognitive level (Bello et al. 2009). If the results support the hypotheses, it is likely that they also generalize to other populations. We collected the data between May 2006 and February 2007, and therefore they should be unaffected by the subsequent major financial crisis.
Data Collection
Survey Instrument
We conducted a paper-and-pencil survey on customers’ relationship with their primary bank in different countries. When possible, we applied the English version of the survey to reduce potential translation biases. For the translated surveys, we ensured equivalence by asking several researchers to back-translate the scales (Brislin 1970).
The survey consisted of three parts. The first part involved the received WOM referrals and the customers’ service quality perceptions, which consisted of items that were either adapted from the literature (Gefen and Straub 2004; McKnight, Choudhury, and Kacmar 2002) or self-developed. Second, we used the CVSCALE (Donthu and Yoo 1998; Yoo, Donthu, and Lenartowicz 2001) to assess the cultural values of power distance, uncertainty avoidance, individualism/collectivism, and masculinity/femininity. We chose this scale because recent research has pointed out the lack of reliability and validity of the Hofstede VSM 94 (Spector, Cooper, and Sparks 2001; Van de Vijver and Poortinga 2002). The CVSCALE possesses a good reliability and validity and has proved to be cross-cultural invariant (Patterson, Cowley, and Prasongsukarn 2006; Yoo and Donthu 2002; Yoo, Donthu, and Lenartowicz 2001). We measured all items on seven-point Likert scales (1 = “strongly disagree,” and 7 = “strongly agree”; for the scales, see Appendix A). Third, we assessed customer characteristics and demographics, including length of relationship, gender, age, nationality, and time spent in the country. We also controlled for the potential effect of a fixed contact service employee (i.e., a service employee with whom respondents had regular contact) on service quality perceptions by means of a yes/no question.
Secondary Data
We included the GNI/PPP of all countries in our analysis, obtained from the World Bank Key Development Data and Statistics (World Bank 2009). We did this to control for differences in the standard of living and level of development across countries.
Results
Demographic Profile of the Sample
A total of 2284 business students from major universities in the United States, Mexico, Australia, China, Hong Kong, Thailand, India, Germany, the Netherlands, Poland, and Russia participated in the study. To exclude other major cultural influences, we analyzed only cases that had no missing demographic information and were identifiable citizens of the respective countries who had lived there since birth. The final sample consisted of 1910 respondents and displayed an equal distribution of male and female respondents (see Appendix B). More than two-thirds of the participants were between 20 and 25 years of age. On average, the length of the customer relationship with the bank was more than eight years, and 17% of the respondents had a fixed contact service employee. There were considerable differences among countries. The chi-square test shows that gender was unequally distributed between the countries (χ2 = 279.53, d.f. = 10, p < .001), as were the distribution of the respondents’ ages (χ2 = 1066.10, d.f. = 30, p < .001) and the average length of the customer relationship (F = 76.21, d.f. = 10, p < .001). Furthermore, the countries differed in prevalence of a fixed contact service employee among the respondents (χ2 = 223.72, d.f. = 10, p < .001). We controlled for these differences during the analysis.
Reliability Tests
First- and Second-Generation Reliability Tests
We applied first- and second-generation reliability tests to the scales. We conducted the tests first on the largest sample (Germany) and then extended them to the other countries. As a result of these analyses, we reduced the power distance scales by two items. Subsequent exploratory factor analysis confirmed the factor structure of our survey. We conducted the exploratory factor analysis with principal component analysis and Varimax rotation; this resulted in six factors that represented the proposed constructs. The total variance explained is 67.49%. Cronbach's alpha is acceptable for most scales. Only the WOM and power distance scales are slightly below the recommended level of .70 (Nunnally 1978) in single countries. Following Bollen (1989), we further built a measurement model with the factorial structure confirmed in the exploratory factor analysis using AMOS 17.0. The model displays a good overall fit (χ2(259) = 1398.47, p < .001; χ2/d.f. = 5.40; goodness-of-fit index = .94; adjusted goodness-of-fit index = .93; comparative fit index = .95; root mean square error of approximation = .05), and intercorrelations between the constructs are acceptable (see Table 1). Furthermore, because the data meet Fornell and Larcker's (1981) criterion that the average variance explained of a factor must be greater than any squared correlation of that factor with another, we confirmed discriminant validity for all scales. In addition, all factor reliability scores are well above the recommended level of .60 (Bagozzi and Yi 1988).
Intercorrelations, Squared Intercorrelations, Average Variance Explained, and Factor Reliabilities

p < .05.
p < .01.
Notes: Intercorrelations are depicted in the lower-left part; squared intercorrelations are depicted in the upper-right part.
Common Method Variance
The cross-sectional survey design of this study indicates the potential for common method bias (Podsakoff, MacKenzie, and Lee 2003). Therefore, in this research, we applied several procedural remedies that have been proposed to reduce this potential (Podsakoff, MacKenzie, and Lee 2003; Rindfleisch et al. 2008). We instructed the participants to answer spontaneously and honestly and reassured them of a confidential and anonymous treatment of the data. By including the GNI/PPP, retrieved from a secondary source, we further reduced potential biases.
Another characteristic that diminishes the potential impact of common method bias is the multilevel design applied in this study. We use a nested, hierarchical structure with the cultural values being aggregated to the level of country groups. Therefore, the analysis is based on two separate data sets: one with individual-level data and one containing aggregated group-level data. Such an aggregation can cancel out much of the random error and sources of bias that occur at an individual level (Glick 1985; Kark, Boas, and Chen 2003). Finally, H2–H5 are between-group hypotheses, and we have no reason to believe that the groups differ systematically in common method variance (Hofman, Morgeson, and Gerras 2003). In summary, we argue that common method bias should not substantially affect the results of this research.
Test for Measurement Invariance
We tested for measurement invariance across cultures using Steenkamp and Baumgartner's (1998) procedure. First, we assessed the configural invariance of the scales across countries. Configural invariance can be confirmed if a model fits the data well in all countries. Overall, the configural invariance models possessed an excellent model fit. Only the Tucker–Lewis index of uncertainty avoidance is somewhat lower than the recommended level of .90 (Hu and Bentler 1999); however, this is not a significant concern, because all the other fit indexes of this scale are in an acceptable range. In addition, all scales must possess equal scale intervals across countries to allow for a meaningful comparison of the covariation across cultures (Steenkamp and Baumgartner 1998).
Therefore, in the next step, we constrained the factor loadings to be equal across the country groups to control for metric invariance. Metric invariance requires equal scale intervals across countries, which enables us to compare difference scores in a meaningful way. Most scales fulfill this criterion and are at least partially metric invariant (see Appendix C). Only masculinity/ femininity differs significantly from the unconstrained model. In this case, Steenkamp and Baumgartner (1998) suggest consulting fit indexes, which are less sensitive to sample size (Van Birgelen et al. 2002). An assessment of the other fit indexes showed that the partial metric invariance model of the masculinity/femininity scale had a very good model fit and that the fit indexes only differed marginally from the configural invariance model. Therefore, we conclude that partial invariance is also supported for masculinity/femininity.
For the cultural values, we further tested for scalar invariance because we expected differences in the absolute levels of these variables. Scalar invariance also requires that the intercepts of the items are equal, which enables us to compare the latent means across countries. All full and partial scalar invariance models have a significantly lower model fit than the configural invariance model. Yet, again, we assessed the change in the other fit indexes and found only smaller decreases or even increases in model fit. Therefore, we considered the scales partially scalar invariant.
Hypothesis Testing
Analysis Procedure
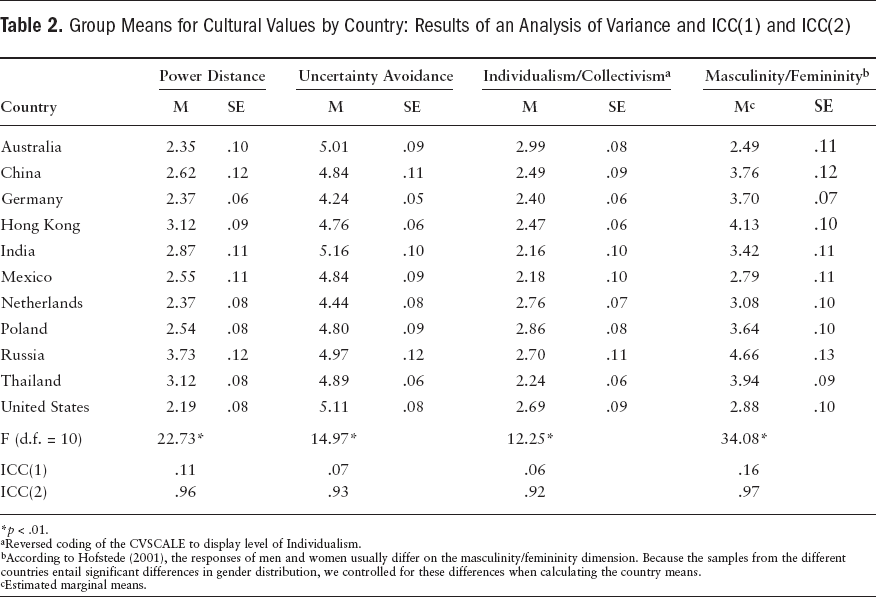
Among cross-cultural researchers, there is an extensive debate and diverse practice on how to account for customers’ cultural values, ranging from the use of secondary data at the country level, to primary data at the target-group level, to primary data at the individual level (Bearden, Money, and Nevins 2006; Steenkamp 2001). Although the other approaches have merit in certain contexts, our aim was to investigate the effect of shared cultural values of a specific target group in different parts of the world on their consumer behavior. Therefore, we based our operationalization of cultural values on the definition of culture as a group-level phenomenon (Hill 1997; Hofstede 2001). Following Lenartowicz and Roth (1999), we analyzed the effect of culture on consumer behavior by first grouping the respondents according to the unit of analysis, which in our case is country. As Lenartowicz and Roth suggest, we included only respondents who possess the pertinent nationality and have always lived in their country to ensure that the respondents belong to the unit of analysis. Furthermore, Lenartowicz and Roth suggest assessing the cultural values of the groups with primary data. Table 2 displays the group means and standard errors of all cultural values. Finally, Lenartowicz and Roth recommend verifying the homogeneity of the groups and, thus, the aggregated use of the cultural values.
Group Means for Cultural Values by Country: Results of an Analysis of Variance and ICC(1) and ICC(2)
p < .01.
Reversed coding of the CVSCALE to display level of Individualism.
According to Hofstede (2001), the responses of men and women usually differ on the masculinity/femininity dimension. Because the samples from the different countries entail significant differences in gender distribution, we controlled for these differences when calculating the country means.
Estimated marginal means.
To justify this aggregation, we calculated the intraclass correlation coefficients, ICC(1) and ICC(2) (Bliese 2000). The ICC(1) values range from .06 to .16 and can be considered good (see Table 2). The ICC(2) values, which should be .60 or higher (Ostroff and Schmitt 1993), are all above .90. This shows that the group means are highly reliable. The significant difference between the countries confirmed our assumption of cultural distance between them.
Although we acknowledge that this measure can be only an approximation of the target groups’ actual cultural values, we argue that it is the best possible indicator of the shared cultural values of each group. We rule out the possibility of applying secondary data on cultural values because research findings show considerable differences in cultural values within countries (Huo and Randall 1991; Koch and Koch 2007).
Multilevel Analysis
In the next step, we used four multilevel models to test the direct effects of WOM and the moderating effect of power distance, individualism/ collectivism, uncertainty avoidance, and masculinity/ femininity. We applied multilevel analysis because of the nested data set, with 1910 customers nested in 11 countries. These two levels of aggregation are reflected in the model that entails country-level as well as individual-level data.
The data's hierarchical structure requires a hierarchical or multilevel analysis (Bryk and Raudenbush 1992; Steenkamp, Ter Hofstede, and Wedel 1999). When applied to hierarchically nested data, ordinary linear models underestimate the standard error and therefore lead to erroneous results (Bryk and Raudenbush 1992). Multilevel modeling avoids this error by simultaneously analyzing effects at two or more levels of aggregation. Multilevel modeling also provides the opportunity to analyze cross-level interaction effects between individual-and country-level variables. We conducted the analyses with the HLM 6.0 software. However, multilevel models might be susceptible to multicollinearity effects (De Jong and De Ruyter 2004). Perhaps because of the small number of groups, a full model results in a solution with a poor data fit. Therefore, we tested our hypotheses on the moderating effects of the cultural values with separate models. At the individual level, the models encompass customers’ received WOM, as well as customer demographics and the information on the fixed contact service employee as control variables. At the group level, the models comprise GNI/PPP as a control variable and the cultural values as predictors. The dependent variable is perceived service quality. Following Bryk and Raudenbush (1992), we group-centered the individual-level variables and grand-mean-centered the group-level variables. In addition, we specified the beta coefficients of WOM as random. The results of the intercept-only models (Bryk and Raudenbush 1992) indicate that the ICC for perceived service quality is .13, which shows a considerable amount of between-group variance. Finally, we tested the hypotheses.
Table 3 shows the final models. We show the test results for H1 only for one model (power distance) to increase readability; the results for the other models do not differ substantially. In support of H1, received WOM referral had a significant effect on customers’ service quality perceptions (β = .329, p < .001). Furthermore, the model showed a significant, positive effect of a fixed contact service employee (β = .211, p < .01). At the individual level, the model explained 17% of the variance in the customers’ service quality perceptions.
Results of Multilevel Analyses: Moderating Effects of Cultural Values

p < .01.
p < .001.
Notes: DV = dependent variable. N = 1910.
The analysis of the group-level effects showed that H2, H4, and H5 are not supported. The effect of WOM on service quality perceptions did not differ between high- and low-power-distance cultures (β = .068, not significant), between individualist and collectivist cultures (β = .080, not significant), and between masculine and feminine cultures (β = .008, not significant). However, we find support for H3. The effect of received WOM on service quality perceptions was signifiantly stronger in high- than in low-uncertainty-avoidance cultures (β = .115, p < .01). The models accounted for 9% (individualism/collectivism), 10% (power distance), 13% (uncertainty avoidance), and 19% (masculinity/femininity) of the group-level variance in customers’ service quality perceptions.
Discussion
Theoretical Implications
Our study of cross-cultural differences in the effect of received WOM makes four important contributions to marketing theory and practice. First, it shows that received WOM has a strong positive effect on customers’ service quality perceptions in a professional service setting. This finding contributes to research on interpersonal influences on customer evaluations (Bone 1995; Burzynski and Bayer 1977).
Second, the results show that the effect of received WOM is also valid in existing service relationships. Even when customers have their own extensive experience, received WOM has a significant impact on their evaluations of the service provider. However, the explained variance at the individual level is relatively low. We expected this given respondents’ personal experience with the service provider. Nevertheless, the model explains 17% of the variance in the service quality perceptions. This finding extends prior WOM research, which has been primarily directed at the purchase decision process (Murray 1991) and behavioral effects of received WOM among existing customers (Wangenheim and Bayón 2004). Although the results of this study emerge from the context of banking services, they should also transfer to existing service relationships in other contexts because the effects are on a fundamental cognitive level.
Third, we show differences in the effect of received WOM across cultures. In line with our hypotheses, these differences can be explained by the level of uncertainty avoidance among the given target groups. Received WOM has a significantly stronger effect on customers’ service quality perceptions in high-uncertainty-avoidance than in low-uncertainty-avoidance cultures. The explained group-level variance is rather low. The model explains only between 9% and 19% of the variance in service quality perceptions. Yet we expected this because interaction effects usually do not increase explained variance; rather, their focus is to help understand relationships, not to predict the dependent variable more effectively (Aiken and West 1991; Jones and Reynolds 2006). This finding extends prior research findings on the effect of uncertainty avoidance on information search behavior, which show that people in high-uncertainty-avoidance cultures consult more external sources before choosing a product or seeking a service (Dawar, Parker, and Price 1996; Lam, Lee, and Mizerski 2009; Money, Gilly, and Graham 1998). The current findings show that uncertainty avoidance not only is a powerful moderator in the prepurchase phase but also affects the cognitions of existing consumers.
Fourth, we did not find support for the proposed moderating effects of power distance, individualism/ collectivism, and masculinity/femininity. Although prior research has repeatedly shown that these cultural values are determinants of information acquisition behavior in the prepurchase phase (e.g., Fong and Burton 2008; Lam, Lee, and Mizerski 2009; Money, Gilly, and Graham 1998), we are unable to support these findings in existing service relationships. The reason for these differences might be found in the different level of analysis we applied. Prior research has either used correlation analysis (Dawar, Parker, and Price 1996; Liu, Furrer, and Sudharshan 2001) or analyzed direct effects of cultural values on customers’ information exchange or acquisition behavior (Lam, Lee, and Mizerski 2009; Money, Gilly, and Graham 1998). These analyses are directed at the level of behavior but do not investigate which cultural values affect the strength of the effect of acquired information on customer information processing. The effects of cultural values on customer information acquisition behavior and customer information processing need to be differentiated. Customer information processing seems to be affected only by the cultural value that is conceptually most closely linked with information processing. Uncertainty avoidance is expressed as the tolerance for unstructured, ambiguous, or unpredictable future events (Hofstede 2001). All other cultural values involve aspects that are less likely to be related to the relevance of external information sources. However, further research is needed to test these assumptions and to provide a better understanding of cross-cultural differences in customer cognitions in service relationships.
Managerial Implications
Customer referrals are an established tool for customer acquisition. The findings show that referrals also have strong effects on customer evaluations in existing service relationships. Received WOM influences customers’ service quality perceptions and therefore is an important tool that marketing managers can use to increase customer retention (Money 2004; Wangenheim and Bayón 2004). This benefit should be of particular importance in noncontractual settings, in which service firms depend largely on relationship building for their customer retention.
The findings also show substantial differences in the effectiveness of received WOM across countries. Service marketing managers should take this difference into account when planning their marketing strategy across different cultures in an attempt to allocate their resources most effectively. Marketing activities should be targeted at fostering WOM communication among existing customers in high-uncertainty-avoidance cultures, in which received WOM is especially influential. In such cultures, received WOM also should be a particularly effective tool for customer acquisition, and marketing managers should install appropriate reward programs for existing customers, whose recommendations are more likely to result in the acquisition of new customers. In contrast, in low-uncertainty-avoidance cultures, received WOM is a less effective tool, and service managers should instead invest in service quality and direct communication with their customers. Programs directed at new customer acquisition might focus on giving the potential customers the opportunity to experience the service, such as through free trials.
The results suggest that the level of uncertainty avoidance is the sole cultural metric that is significantly correlated with the impact of received WOM on customers’ service quality perceptions. Although WOM activity and acquisition behavior might be affected by different cultural values, our study gives managers a simple single metric that informs them when fostering WOM is particularly effective in increasing service quality perceptions among existing customers.
We obtained our findings in a cross-cultural setting, but they should also apply to differences in the cultural values of different target groups within a single country. Customers from different societal milieus may differ strongly in their cultural values, so service managers should analyze the value system of their specific target group to determine the extent to which received WOM may affect their service evaluation.
Limitations and Future Research Directions
The results of this study again highlight the importance of considering cross-cultural differences in customer decision making (McCort and Malhotra 1993). However, the limitations need to be mentioned, and we present them as avenues for further research. First, we used a cross-sectional design to analyze service relationships, which does not allow for an investigation of the development of customers’ evaluations of the service provider. Furthermore, longitudinal analyses are needed to understand the dynamics of information acquisition and evaluation processes of service customers over time. Second, this study does not include information about exactly when, how, and by whom the customers received their WOM. This also pertains to the question of information search behavior (Moorthy, Ratchford, and Talukdar 1997)—that is, whether the received WOM referral was actively searched for or passively received. Additional research should assess these processes in more detail to help clarify the most common and most effective methods for WOM referrals in service relationships. Third, we assessed only positive WOM and analyzed its beneficial effects on customers’ evaluations of the service provider. Although we would argue that negative WOM should lead to less favorable customer evaluations of the service provider and also that this effect should be stronger in high-uncertainty-avoidance cultures, further research is necessary to investigate this proposition. Fourth, our study focuses on a target group of business students in the banking service industry. The hypotheses pertain to a fundamental level and should generalize to other target groups and marketing contexts, but further research is needed to test this claim. Fifth, we study the effects of shared cultural values on individual behavior in 11 countries, which puts restrictions on the effects that can be tested with multilevel models. Further research should extend this scope, which would allow including more variables in the models and test several moderating effects against each other. Sixth, we focus on Hofstede's (2001) four original cultural dimensions, which have been the focus of prior research on WOM. Further research should also investigate potential effects of Confucian dynamism (short-term versus long-term orientation), which has been added as a fifth cultural dimension to the Hofstedian framework.
Research findings suggest that the willingness to engage in positive WOM differs across cultures (Lam, Lee, and Mizerski 2009; Liu, Furrer, and Sudharshan 2001). Further research should attempt to analyze the various drivers of referral behavior across cultures. Research should also investigate cross-cultural differences in the willingness to engage in negative WOM. In an increasingly global service industry, these results may provide service managers with greater knowledge that will enable them to optimize their relationship marketing tools to appeal to the cultural values of their respective target groups when exporting their services as well as to counterbalance unwanted effects of negative WOM.
Footnotes
Scales Used in the Research

| Factor Loadings | M (SD) | Cronbach's Alpha | |
|---|---|---|---|
|
|
.78 | ||
| Friends of mine already have made good experiences with my bank. | .62 | 4.76 (1.41) | |
| Friends of mine have recommended my bank to me. | .74 | 3.70 (1.90) | |
| Friends of mine have told me positive things about my bank. | .91 | 4.16 (1.67) | |
|
|
.90 | ||
| My bank knows how to provide excellent service. | .82 | 4.84 (1.33) | |
| My bank is competent and has a lot of expertise. | .86 | 5.02 (1.29) | |
| The quality of my bank's services is very high. | .89 | 4.95 (1.34) | |
| Overall my bank is an experienced financial institute. | .77 | 5.37 (1.33) | |
|
|
.79 | ||
| People in higher positions should make most decisions without consulting people in lower positions. | Excluded | 3.14 (1.61) | |
| People in higher positions should not ask people in lower positions too frequently. | Excluded | 3.27 (1.57) | |
| People in higher positions should avoid social interaction with people in lower positions. | .74 | 2.38 (1.49) | |
| People in lower positions should not disagree with decisions by people in higher positions. | .75 | 2.66 (1.51) | |
| People in lower positions should not delegate important tasks to people in lower positions. | .69 | 2.97 (1.52) | |
|
|
.86 | ||
| It is important to have instructions spelled out in detail so that I always know what I'm expected to do. | .60 | 4.46 (1.58) | |
| It is important to closely follow instructions and procedures. | .80 | 4.67 (1.40) | |
| Rules and regulations are important because they inform me of what is expected of me. | .86 | 4.84 (1.32) | |
| Standardized work procedures are helpful. | .68 | 4.84 (1.32) | |
| Instructions for operations are important. | .73 | 5.02 (1.25) | |
|
|
.85 | ||
| Individuals should sacrifice self-interest for the group (either at school or the workplace). (R) | .63 | 3.71 (1.44) | |
| Individuals should stick with the group even through difficulties. (R) | .58 | 2.11 (1.34) | |
| Group welfare is more important than individual rewards. (R) | .85 | 2.52 (1.38) | |
| Group success is more important than individual success. (R) | .83 | 2.46 (1.39) | |
| Individuals should only pursue their goals after considering the welfare of the group. (R) | .68 | 2.66 (1.40) | |
| Group loyalty should be encouraged even if individual goals suffer. (R) | .64 | 2.64 (1.40) | |
|
|
.83 | ||
| It is more important for men to have a professional career than it is for women. | .73 | 3.11 (1.96) | |
| Men usually solve problems with logical analysis; women usually solve problems with intuition. | .73 | 3.63 (1.79) | |
| Solving difficult problems usually requires an active, forcible approach, which is typical of men. | .87 | 3.32 (1.79) | |
| There are some jobs that a man can always do better than a woman. | .65 | 3.99 (2.05) |
Notes: Items were measured on a seven-point “strongly disagree/strongly agree” scale; (R) = reversed items.
Sample Size,Gender,Age,Length of Relationship,and Fixed Contact Person by Country

| N |
Gender |
Age (Years) |
Length of Relationship (Months) |
|||||||
|---|---|---|---|---|---|---|---|---|---|---|
| Country | Included | Male | Female | ≤19 | 20–5 | 26–30 | ≥31 | M | SD | Fixed Contact Person |
| Germany | 330 | 214 (64.8%) | 116 (35.2%) | 13 (3.9%) | 289 (87.6%) | 28 (8.5%) | 0 (0%) | 138.72 | 86.08 | 139 (42.1%) |
| Mexico | 155 | 82 (52.9%) | 73 (47.1%) | 36 (23.2%) | 116 (74.8%) | 3 (1.9%) | 0 (0%) | 36.41 | 26.31 | 26 (16.8%) |
| Poland | 181 | 42 (23.2%) | 139 (76.8%) | 0 (0%) | 176 (97.2%) | 2 (1.1%) | 3 (1.7%) | 41.27 | 27.71 | 9 (5.0%) |
| Australia | 136 | 48 (35.3%) | 88 (64.7%) | 43 (31.6%) | 80 (58.8%) | 6 (4.4%) | 0 (0%) | 111.51 | 71.90 | 9 (6.6%) |
| India | 147 | 120 (81.6%) | 27 (18.4%) | 6 (4.1%) | 51 (34.7%) | 23 (15.6%) | 67 (45.6%) | 90.50 | 88.25 | 30 (20.4%) |
| Netherlands | 165 | 75 (45.5%) | 90 (54.5%) | 20 (12.1%) | 121 (73.3%) | 7 (4.2%) | 17 (10.3%) | 178.18 | 101.96 | 16 (9.7%) |
| China | 126 | 112 (88.9%) | 14 (11.1%) | 0 (0%) | 126 (100%) | 0 (0%) | 0 (0%) | 43.76 | 26.03 | 5 (4.0%) |
| Hong Kong | 161 | 52 (32.3%) | 109 (67.7%) | 0 (0%) | 147 (91.3%) | 12 (7.5%) | 2 (1.2%) | 101.08 | 57.06 | 11 (6.8%) |
| Russia | 112 | 46 (41.1%) | 66 (58.9%) | 43 (38.4%) | 48 (42.9%) | 14 (12.5%) | 7 (6.3%) | 36.32 | 29.70 | 9 (8.0%) |
| United States | 163 | 82 (50.3%) | 81 (49.7%) | 1 (.6%) | 147 (90.2%) | 9 (5.5%) | 6 (3.7%) | 74.00 | 48.90 | 20 (12.3%) |
| Thailand | 234 | 78 (33.3%) | 156 (66.7%) | 0 (0%) | 95 (40.6%) | 88 (37.6%) | 51 (21.8%) | 101.27 | 77.80 | 52 (22.2%) |
| Pooled Sample | 1910 | 951 (49.8%) | 959 (50.2%) | 162 (8.5%) | 1369 (73.1%) | 192 (10.1%) | 160 (8.4%) | 97.79 | 80.02 | 326 (17.1%) |
Test for Measurement Invariance

| Model |
Fit Indexes |
||||||
|---|---|---|---|---|---|---|---|
| Scale | χ2 | d.f. | Δχ2 | Δd.f. | RMSEA | TLI | CFI |
|
|
|||||||
| Configural invariance | N.A. | N.A. | N.A. | 1.00 | 1.00 | ||
| Full metric invariance | 44.92 | 20 | 44.92 | 20 | .03 | .98 | .99 |
| Partial metric invariance | 13.90 | 10 | 13.90 | 10 | .02 | .99 | 1.00 |
|
|
|||||||
| Configural invariance | 105.37 | 22 | .05 | .95 | .98 | ||
| Full metric invariance | 186.13 | 52 | 80.76 | 30 ** | .05 | .96 | .97 |
| Partial metric invariance | 116.10 | 32 | 10.73 | 10 | .04 | .96 | .98 |
|
|
|||||||
| Configural invariance | N.A. | N.A. | N.A. | 1.00 | 1.00 | ||
| Full metric invariance | 35.74 | 20 | 35.74 | 20 * | .02 | .98 | .99 |
| Partial metric invariance | 15.60 | 10 | 15.60 | 10 | .02 | .99 | 1.00 |
| Full scalar invariance | 305.61 | 40 | 305.61 | 40 ** | .06 | .85 | .81 |
| Partial scalar invariance | 139.78 | 20 | 139.78 | 20 ** | .06 | .86 | .92 |
|
|
|||||||
| Configural invariance | 396.25 | 55 | .06 | .85 | .93 | ||
| Full metric invariance | 466.21 | 95 | 69.96 | 40 * | .05 | .91 | .92 |
| Partial metric invariance | 423.70 | 75 | 27.45 | 20 | .05 | .89 | .93 |
| Full scalar invariance | 942.67 | 125 | 546.42 | 70 ** | .06 | .85 | .83 |
| Partial scalar invariance | 564.77 | 95 | 168.52 | 40 ** | .05 | .88 | .90 |
|
|
|||||||
| Configural invariance | 360.51 | 99 | .04 | .91 | .94 | ||
| Full metric invariance | 419.67 | 149 | 59.16 | 50 * | .03 | .94 | .94 |
| Partial metric invariance | 392.77 | 129 | 32.26 | 30 | .03 | .93 | .94 |
| Full scalar invariance | 828.59 | 179 | 468.08 | 80 ** | .04 | .87 | .86 |
| Partial scalar invariance | 531.21 | 149 | 170.70 | 50 ** | .04 | .91 | .92 |
|
|
|||||||
| Configural invariance | 32.63 | 22 | .02 | .99 | 1.00 | ||
| Full metric invariance | 113.16 | 52 | 80.53 | 30 ** | .03 | .97 | .98 |
| Partial metric invariance | 51.79 | 32 | 19.16 | 10 * | .02 | .98 | .99 |
| Full scalar invariance | 550.79 | 72 | 518.16 | 50 ** | .06 | .83 | .81 |
| Partial scalar invariance | 174.42 | 42 | 141.79 | 20 ** | .04 | .92 | .95 |
p < .05.
p < .01.
Notes: RMSEA = root mean square error of approximation, TLI = Tucker–Lewis index, and CFI = comparative fit index. N.A. = not applicable.
The Authors
Acknowledgments
This work was supported by the German Federal Ministry of Education and Research (FKZ: 01HQ0553). A second source of funding was through the German Academic Exchange Service. The authors thank Ruth Bolton, Antony Peloso, and Lonnie Ostrom from the W.P. Carey School of Business at Arizona State University for their support in data collection. They also thank the three anonymous JIM reviewers for their guidance in improving the article.