
Abstract
The authors investigate whether, and to what extent, marketing conduct varies over the business cycle and how this contributes to the growing popularity of private labels. To address this issue, they examine a unique data set that combines a broad set of seven marketing-mix instruments with private-label share, using two decades' worth of data for 106 consumer packaged goods categories in the United States. The results show that private-label share behaves countercyclically and that part of the boost in private-label share during contractions is permanent. Retailers' observed practice of supporting their own labels in contraction periods while cutting back in expansion periods helps this cyclical sensitivity even further. In addition, national brands' procyclical behavior in terms of (1) major new product introductions, (2) advertising, and (3) their promotional pressure compared with private labels is associated with more pronounced cyclical fluctuations in private-label share and even with permanent private-label market share gains. Although brand managers cannot be held responsible for the occurrence of economic downswings, they can be held accountable for how much contractions help strengthen their fiercest competitor, the store brands owned by their very customers.
Keywords
Although private-label share tends to grow in the long run, previous research has shown that this growth is not evenly spread across time. Rather, Lamey et al. (2007) show that private-label share grows disproportionally in periods of economic contraction and that much of this gain persists in better times. Thus, although national brands recover part of the loss in the subsequent expansion period, this recovery is not complete. Consumers understandably become more receptive to (cheaper) private-label offerings in difficult times. Consumers, however, do not operate in a vacuum but rather respond to the marketing activities of companies. This raises the question whether the conduct of national brands and private labels over the business cycle contributes to the cyclical sensitivity of private-label share and, even more important, to the long-term growth of private labels. If so, which marketing instruments have the greatest impact? Which instruments have only a temporary effect on private-label share, and which instruments, if any, contribute to a permanent increase in private-label share? If private labels' long-term growth rate is systematically affected by the conduct of the market players over the business cycle, we offer a platform that suggests that marketing strategies should either fight (national brands) or boost (retailer) private labels in different parts of the business cycle.
Our purpose is to shed light on these issues by investigating the relationship between national-brand and retailer conduct over the business cycle on the one hand and private-label share on the other hand. We focus on the generic battle between national brands and private labels rather than on specific national brands or particular private labels (for similar generic perspectives, see Dhar and Hoch 1997; Steenkamp, Van Heerde, and Geyskens 2010). As such, our focal variable is private-label share in a category, which is a measure of how national brands fare against their fiercest enemy—that is, the store brands owned by their very customers. We investigate market players' conduct with respect to seven of the most important marketing instruments: innovation activity, in which we distinguish between major and incremental innovations; (regular) pricing; advertising spending; and consumer promotions, in which we distinguish among temporary price reductions (TPRs), features, and display activity.
Our empirical setting is a carefully assembled, longitudinal data set of 106 CPG product categories in the United States, covering 21 years. The scope of these data provides a unique opportunity to study how marketing conduct varies across the business cycle and its implications for private-label share. Specifically, our research addresses the following research questions:
How do managers of national brands and private labels adjust their behavior in response to economic up- and downswings? Do cyclical adjustments in marketing conduct go with the business cycle (increase during expansions and decrease during contractions) or against the business cycle (decrease during expansions and increase during contractions)? Moreover, are these adjustments more or less pronounced than the corresponding movements in the economy itself? Finally, are the adjustments similar in direction and magnitude across all instruments, or do managers react more (and differently) with some instruments (e.g., advertising) than with others (e.g., feature support)?
Do these business-cycle-induced adjustments in marketing support contribute to temporary gains (losses) in private-label share during contractions (expansions)? If so, which marketing instruments have the greatest impact? For example, does changing innovation activity have more effect than changing advertising, or vice versa? Or are they both inconsequential?
Do any of these business-cycle-induced adjustments also contribute to permanent gains in private-label share? Does the conduct of national brands and private labels have persisting effects on private-label share even after the contraction is long over? For example, if manufacturers cut their advertising support during the contraction, will this result in higher private-label shares in the subsequent expansion years as well, or will private-label share in good times revert back to its precontraction level? If national-brand manufacturers reduce the number of new product introductions during contraction periods, will this undermine their competitive position even when the economy is growing again?
Answering these questions enables us to assess which instruments should be cut in economic downturns and which ones should be spared to the maximum extent possible. We contrast what is happening in the marketplace with what national-brand managers and retailers should do, and we do so for seven key marketing instruments. Because contractions represent a deviation from the “norm” of economic expansion (Steenkamp and Fang 2011), we focus relatively more on what happens in contractions, using expansions as the benchmark.
Research Framework
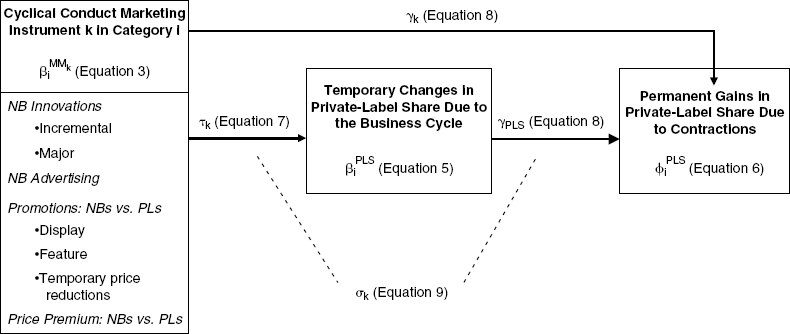
Figure 1 provides the framework that guides our research. We begin by describing cyclical adjustments in the conduct of national brands and private labels over the business cycle. Then, we examine the likely effect of these adjustments on temporary changes in private-label share during the corresponding phase of the business cycle. Finally, we consider whether any permanent changes in private-label share are likely to occur as a consequence of business-cycle-induced changes in private-label share and marketing conduct. Table 1 provides an explanation of the constructs included in our framework.
Constructs and Operationalization

Research Framework
In our conceptualization and measurement of marketing conduct, we were inspired by Reibstein and Wittink (2005), who advocate the use of measures relative to that of competitors. These authors argue (p. 8) that the important question to ask is: “How are we doing relative to our competitors who operated under the same economic conditions?” Our use of relative measures of marketing conduct is conceptually consistent with our dependent variable, which is also a relative measure—that is, (change in) private-label share.
Our promotion and price variables are national-brand promotion intensity (prices) relative to private-label promotion intensity (prices). We do not use relative measures for innovation and advertising. The reason is that these instruments are not yet widely used by private labels, and therefore a relative measure is not meaningful. Corstjens and Steele (2008) and Kumar and Steenkamp (2007) observe that though some retailers have recently begun to introduce their own innovations (as opposed to copycat, me-too products) and advertise their private labels, the intensity of these activities is still minor compared with national brands. Moreover, private-label advertising, if present, is almost always generic rather than category specific (this is also corroborated by our data, as we detail subsequently). Brand economics argue against such category-specific investments. Brand manufacturers have a much greater stake in their categories than retailers, which after all carry hundreds of categories. Retailers also operate on thinner margins and consequently lack the financial resources to support any specific category with sustained innovation or advertising (Hoch and Banerji 1993). Thus, for innovation and advertising activity in a category, we consider only national-brand activity.
Marketing Conduct over the Business Cycle
Academic research has documented the procyclical behavior of advertising expenditure (Deleersnyder et al. 2009; Srinivasan, Lilien, and Sridhar 2011) and innovation activities (Axarloglou 2003). Evidence also shows that managers raise prices during contractions and reduce them during expansions (Chevalier and Scharfstein 1996; Taylor 1999)—that is, prices behave countercyclically. However, prior studies have typically examined the aggregate intensity of a particular marketing-mix instrument. Aggregate patterns are not necessarily descriptive of the behavior in the CPG industry, let alone specific CPG categories. Furthermore, little is known about the cyclical conduct of promotions or whether these results also apply to private labels.
Given previous work, we expect that national-brand innovation and advertising and relative promotion activity (i.e., national-brand promotions relative to private-label promotions) behave procyclically: They are cut in contractions and ramped up again in expansionary periods. We further expect that the relative price behaves countercyclically, in that the price gap between national brands and private labels increases in contractions and decreases in expansions. We note that national-brand innovation and advertising are largely (innovation) or completely (advertising) under the control of the manufacturer. The observed national-brand conduct for promotion and pricing is much more a shared manufacturer—retailer decision, with retailers having the final say (Ailawadi et al. 2009, p. 43).
Impact of Cyclical Marketing Conduct on Temporary Changes in Private-Label Share
Most purchase behavior in CPG categories is based on habit (Hoyer 1984). Consequently, in expansionary periods, consumers spend little cognitive effort on the choice task and exhibit a high degree of inertia in their purchases. In bad times, however, many consumers must live on tighter budgets and face financial insecurity as a result of increased job uncertainty. They respond to these challenges by postponing discretionary purchases (Cook 1999), though that is not an option for most CPG products. Rather, consumers will think more carefully about their purchases each time they enter the marketplace. In short, contractions have the effect of shaking consumers out of their habitual decision making. In contrast, consumers have little incentive to reconsider their habitual decisions (and consider lower-priced alternatives) during economic expansion periods.
Moreover, in economic slowdowns, consumers are more inclined to acquire price information (Wakefield and Inman 1993), and they become more price sensitive (Estelami, Lehmann, and Holden 2001). Private labels sell for 20%–60% less than national brands (Dhar and Hoch 1997). Consequently, compared with expansionary periods, the increased tendency to acquire price information and its increased weight in decision making in contractions create powerful incentives for consumers to switch from national brands to private labels, unless in contractions, national brands provide compelling reasons to consumers to stick with them. We consider four types of “compelling reasons”: (1) innovation by national brands, (2) advertising by national brands, (3) promotion activity by national brands relative to private labels, and (4) pricing of national brands relative to private labels.
Innovation by national brands
Innovative products provide more value to consumers by offering new benefits. This should reduce the price focus of consumers in contractions since the brand offers an alternative purchase rationale. However, not all innovations may be equally effective in fighting private labels. A common distinction is made between major and incremental innovations. Incremental innovations, such as extensions and updates of existing products, are easy to understand but do not offer significant advantages over existing products, including private labels (Sorescu and Spanjol 2008). Therefore, we can expect that they will reach their sales potential relatively soon (because they are easy to understand)—that is, in the contraction itself. However, their permanent effect on fighting private labels after the contraction is likely to be modest (because they offer few new benefits).
Major innovations, in contrast, offer significant advantages over existing products. They often originate from technical breakthroughs by bringing real new value to the consumer or creating a new consumption experience. They include new technologies, new-to-the-world products, new applications, and new packaging that significantly affects the use of the product (Sorescu and Spanjol 2008). As Steiner (2004) eloquently put it, a true innovation leaves the category's private labels in the unfortunate position of imitating yesterday's favorites. However, major innovations have a drawback in that they take more time to establish themselves in the marketplace. After all, major innovations require more behavioral change and are often relatively high on complexity (Gielens and Steenkamp 2007). Consequently, major innovations offer a platform for long-term growth, but it can easily take a year or more for their effect to be realized in the marketplace. Thus, the introduction of a major innovation will likely not have a strong effect on short-term, cyclical, private-label share. In summary, we expect that procyclical introductions of incremental innovations by national brands induce more countercyclical fluctuations in private-label share but that no such effect is found for major innovation activity.
Advertising by national brands
Mela, Gupta, and Jedidi (1998) find that brands can use advertising to “insulate” themselves from competition. This should reduce price sensitivity and curtail switching from national brands to lower-priced private labels. Moreover, advertising also plays a large role in building brand image, which is difficult to copy by private labels (Kumar and Steenkamp 2007). These factors should play a greater role in contractions than in expansions. Reducing price sensitivity is especially important when the tendency of consumers is to become more price focused (Estelami, Lehmann, and Holden 2001), and providing difficult-to-copy intangible imagery offers additional value to consumers that can help offset the negative utility of higher prices (Steenkamp, Van Heerde, and Geyskens 2010). In expansion periods, consumers tend to be less price sensitive, making this “insulation function” of advertising less impactful, especially when considering that advertising clutter in expansions is higher, which reduces the effectiveness of advertising (Danaher, Bonfrer, and Dhar 2008; Steenkamp and Fang 2011). Thus, the expected procyclical advertising activity by national brands induces countercyclical fluctuations in private-label share.
Relative promotion activity
Promotions are mechanisms that bring the product to the attention of consumers at the point of purchase. Given that many purchase decisions for CPGs are made in the store, drawing attention to a specific brand has an immediate sales effect, a major part of which comes from brand switching (Bell, Chiang, and Padmanabhan 1999). Three important promotional instruments in the CPG sector are TPRs, features, and displays.
People weigh price more heavily in contractions than in expansions, and thus the effect of TPRs should be larger. Consequently, we posit that procyclical TPR behavior by national brands relative to private labels leads to larger private-label-share gains in contractions and larger private-label-share losses in expansions. That is, stronger procyclical TPR behavior by national brands relative to private labels is associated with stronger countercyclical behavior in private-label share. Conversely, if relative TPR behavior is countercyclical rather than procyclical, we expect this to dampen the cyclical swings in private-label share.
Two prominent behavioral reasons have been forwarded in the marketing literature to explain how display and feature can significantly increase brand choice (Zhang 2006). 1 First, consumers may interpret a promotion marker (a feature or in-store display) as a proxy for a price cut. This phenomenon is referred to as the “price-cut proxy effect.” Second, display and feature promotions are used to form consideration sets. This is referred to as the “consideration-set-formation effect” (Zhang 2006). Both effects apply to national brands (suggesting a higher likelihood to buy the national brand) and private labels (suggesting a higher likelihood to buy the private label). Following this line of thought, we expect that stronger procyclical (countercyclical) feature and display activity by national brands relative to private labels is associated with stronger (weaker) countercyclical behavior in private-label share.
We thank an anonymous reviewer for this suggestion.
Zhang (2006) further shows that consumers who are more involved in evaluating price and promotional information (as is the case during an economic contraction; Estelami, Lehmann, and Holden 2001) strongly react to a TPR but are less affected by display and features. As such, we expect that cyclical adjustments in TPR have a stronger effect than comparable adjustments in feature and display activity.
Price premium
It is an empirical observation that (manufacturers') regular prices tend to behave countercyclically (Chevalier and Scharfstein 1996; Taylor 1999), and Estelami, Lehmann, and Holden (2001) establish empirically that consumer price sensitivity is higher in adverse economic conditions than in good times. We therefore expect that countercyclical price premium adjustments reinforce countercyclical fluctuations in private-label share.
Impact on Permanent Gains in Private-Label Share
The effect of private-label cyclicality
In economics, business-cycle volatility has been found to affect the average long-term growth in output across countries (Döpke 2004; Mills 2000; Ramey and Ramey 1995). Applied to our context, the critical question is whether the cyclical fluctuations in private-label share lead to permanently lower market shares for national brands. At first glance, there is little reason to expect permanent effects. It could be argued that private labels gain during a contraction but lose during the subsequent expansion, making it a zero-sum game in the long run. However, this reasoning ignores consumer learning. Consumer perceptions of private-label quality tend to lag improvements in their actual quality (Apelbaum, Gerstner, and Naik 2003; Steenkamp, Van Heerde, and Geyskens 2010). From their actual product experience with private labels in the contraction, consumers may learn that true private-label quality exceeds their past perceptions. If consumers update their quality perceptions (e.g., through direct consumption experience in a contraction), store brands will gain more customers, and it will be difficult for manufacturers to win them back, even when the economy recovers in the subsequent expansion. Moreover, as we outlined previously, while contractions shake consumers out of their habitual decision making, expansionary periods are associated with an increase in consumer inertia (Gijsenberg et al. 2010). For many consumers, however, purchasing a private-label product has become the habit, so an increase in habitual decision making helps the private label, even when the economy is booming again. This gives rise to a permanent positive effect of an economic contraction on private-label performance, as Lamey et al. (2007) document.
The effect of cyclical marketing conduct
Does the cyclical marketing conduct of national brands and private labels have a direct effect on long-term private-label share beyond the hypothesized indirect effect through the cyclical fluctuations in private-label share? We believe that for most marketing instruments, this is not likely. This has to do with the duration of the impact of most marketing instruments.
The pervasive practice of national brands to cut back advertising in contractions is likely to (inadvertently) boost private-label share in the contraction itself, but the duration interval for advertising is relatively brief, typically between six and nine months (Leone 1995). In addition, the increased spending during expansions will only have a short-lived effect, on average. So, any effect of cyclical advertising behavior on long-term private-label growth is likely to go through short-term (temporary) private-label changes. Similarly, the duration interval of incremental innovations is relatively short (Gielens and Steenkamp 2007). Finally, the duration interval of promotions is very short, typically a few weeks (Srinivasan et al. 2004). So, any effect of cyclical behavior in these instruments on permanent changes in private-label share is likely to go through the cyclical fluctuations in private-label share.
The situation for major innovations is quite different. Although they offer a platform for long-term growth, more complex innovations that require more behavioral changes take a considerably longer time before their effect is realized in the marketplace (Gielens and Steenkamp 2007), so any effect on private-label share will emerge in the longer run. The question emerges whether the anticipated pro-cyclical behavior in major innovation activity by national brands will have any ramifications for the long-term share of national brands versus private labels. Previous research suggests that procyclical innovation activity is less effective in generating long-term sales than acyclical or even anti-cyclical behavior. By going against the grain, there is less competitive clutter, and the quality of production is higher (Steenkamp and Fang 2011). Thus, we submit that procyclical introduction of major innovations by national brands will add to long-term private-label growth directly, rather than working through its effect on cyclical fluctuations in private-label share.
Method
General Outline
Our methodological approach consists of five steps. In Steps 1–3, we derive measures for the different variables included in our research framework (represented by the boxes in Figure 1). In Steps 4 and 5, we estimate the proposed relationships between the different components of this framework (represented by the arrows in Figure 1).
For the variables, we (1) need to quantify how managers of national brands and private labels adjust their behavior in accordance with economic up- and downswings (Step 1), (2) need to determine how much private-label share varies during economic up- and downswings (Step 2), and (3) require a measure of how economic downswings affects private labels' long-term share (Step 3). It is important to recognize that the relationship between two series can differ across different periodicities. Given our interest in fluctuations at business-cycle periodicities, we first use business-cycle filtering to extract the cyclical component in each of the marketing-mix series and then relate this cyclical component in the marketing-mix series to the corresponding cyclical component in the state of the economy. This relationship is expressed through the marketing instrument's cyclical comovement elasticity, which quantifies the cyclical conduct of the marketing instrument. This comovement elasticity can be positive (in the case of procyclical adjustments in the instrument) or negative (in the case of countercyclical adjustments).
We follow the same methodological procedure to derive our measure for the temporary changes in private-label share due to the business cycle (i.e., the middle box of Figure 1), in that we first isolate the fluctuations in a private label's market share that occur at business-cycle periodicities and then link them to the corresponding cyclical fluctuations in the state of the economy. This gives us the private-label cyclical comovement elasticity, which quantifies how private-label share changes with cyclical up-and downswings in the economy. As such, it measures the extent of temporary gains (losses) in private-label share in contractions (expansions).
To obtain a measure of the permanent impact of economic cycles on private-label share (the right-hand-side box of Figure 1), we focus on the underlying long-term trend in the private-label series. Following a similar logic, we now need to filter out fluctuations happening at business-cycle periodicities and keep fluctuations at lower periodicities (as these correspond to longer-term movements). Next, we consider whether the trend's growth rate is strengthened because of the contraction as our measure for the permanent impact of business cycles on private-label share.
Finally, we estimate the structural relationships between the different building blocks in our conceptual model. We first estimate the effect of the cyclical conduct of the marketing-mix instruments on temporary changes in private-label share over the business cycle (Step 4) and then estimate the effect of the cyclical conduct of the marketing-mix instruments and temporary changes in private-label share on permanent gains in private-label share due to contractions (Step 5). We now proceed with the technical details of each step.
Step 1: Quantifying the Cyclical Conduct of Marketing-Mix Instruments
Prior research has shown that the relationship between variables can differ across different periodicities (Baxter 1994; Bronnenberg, Mela, and Boulding 2006). Given our interest in managerial adjustments aligned with the business cycle, we first need to extract those fluctuations from the series that occur at business-cycle periodicities. Second, we need to relate the cyclical component in the marketing-mix series to the business cycle (Deleersnyder et al. 2009).
Extracting the cyclical component in each marketing-mix series
We use the well-known Hodrick and Prescott (1997) filter to extract the cyclical component from each marketing-mix series. The HP filter decomposes a time series in (1) a gradually evolving trend component and (2) cyclical fluctuations around it (Lamey et al. 2007). To obtain the cyclical component in marketing-mix instrument 
where MMk,t is the log-transformed time series for marketing-mix instrument k. Log transformation facilitates the comparison across series. We obtain 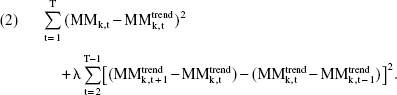
The first quadratic term in Equation 2 provides a measure of goodness of fit, and the second quadratic term determines the smoothness of the derived trend. Note that the HP filter does not impose that this trend is linear or even monotonic. The solution to Equation 2 implies a trade-off between fit and smoothness, as determined by the parameter λ. The larger the value of λ, the smoother the trend series becomes (Hodrick and Prescott 1997). We follow current practice and set λ = 10 for annual data (Baxter and King 1999; see also Deleersnyder et al. 2009; Lamey et al. 2007). To account for a structural break in some of our marketing-conduct series (which might arise because of a change in the measurement methodology adopted by one of the data providers), we can reformulate the HP filter into a state-space representation to which we add two pulse dummies, as detailed in the Web Appendix (http://www.marketingpower.com/jm_webappendix). We extract the cyclical component
Relating the cyclical component in each marketing-mix series to the business cycle
To quantify the sensitivity of each marketing-mix instrument to the state of the economy, we derive the cyclical comovement elasticity, which measures the extent to which business-cycle fluctuations in the economy as a whole translate into cyclical fluctuations in a particular marketing instrument. We use data on U.S. real gross domestic product (GDP) as a proxy for the general economic activity. Business-cycle fluctuations across many sectors are reflected in aggregate (national) output, making the cyclical component of GDP an appropriate indicator for the overall economic cycle (Stock and Watson 1999). We use the same HP filtering procedure to extract the cyclical fluctuations in the economic activity. In line with Deleersnyder et al. (2009) and Lamey et al. (2007), we regress the cyclical component of each marketing-mix instrument 
Business-cycle filters may induce serial correlation in the data (Deleersnyder et al. 2009). To account for this, we can add an autoregressive error term to Equation 3. Extending the comovement equation with an autoregressive error term also accounts for potential delayed effects of the business cycle. Using Akaike information criterion as the model selection criterion, we added an autoregressive term in 27% of the series. Because both series are zero reverting after filtering, it is not necessary to include an intercept in Equation 3.
where
Step 2: Quantifying Temporary Changes in Private-Label Share Due to the Business Cycle
We adopt the same procedure to quantify the temporary gains in private-label share in contractions—that is, the cyclical sensitivity of private-label share. First, we use the HP Alter to separate the (log-transformed) observed private-label-share series in each category into its trend and cyclical component:

Second, we regress the cyclical component in private-label share (
We estimate Equation 5 for each of the 106 CPG categories in our sample. Thus, the parameter
Step 3: Quantifying the Permanent Gains in Private-Label Share Due to Contractions
The cyclical comovement elasticity of private-label share does not yet answer the question whether the severity of the cyclical fluctuations influences the underlying trend in the private-label series. After all, the comovement elasticity, βPLS, quantifies the relationship between temporary (cyclical) fluctuations in, respectively, private-label share and the economic activity, after the long-term trend has been removed from the series (i.e., through Equation 4). To quantify private labels' long-term growth trajectory, we consider the long-term trend series 
The dependent variable in Equation 6 is the change in the long-term private-label trend. Previous research has documented the nonstationary nature of the long-term private-label trend (Lamey et al. 2007). This was confirmed by the Levin–Lin–Chu panel-unit-root test on our long-term private-label-share series, which revealed that the presence of a unit root in the series cannot be rejected (t = .649, p = .742). Therefore, we need to difference the data to avoid spurious findings that result from statistical analyses on nonstationary data (Dekimpe and Hanssens 1995). The intercept δPLS is a drift parameter, which accounts for all other factors that are not explicitly included in the model but that contribute to the long-term growth in private-label share, such as the increasing quality of private labels, the growing number of private labels, better shelf space, and greater retailer sophistication in managing private-label operations (Kumar and Steenkamp 2007).
We set the contraction dummy, contt, to one when the economy is contracting (i.e.,
An alternative approach to identify contraction periods in the U.S. economy would be to use the recession periods as declared by the National Bureau of Economic Research Business Cycle Dating Committee. However, its judgment-based procedure has been criticized for a lack of statistical foundation and for a rigid focus on absolute declines (as opposed to growth slowdowns) in output and other measures (Stock and Watson 1999). For these reasons, business-cycle filters have become the norm to study cyclical phenomena in contemporary business-cycle research in economics (e.g., Baxter and King 1999; Christiano and Fitzgerald 1998) and marketing (Deleersnyder et al. 2004; Deleersnyder et al. 2009; Lamey et al. 2007).
Step 4: Estimating the Effects of Cyclical Marketing Conduct on Temporary Changes in Private-Label Share
To assess whether cyclical marketing conduct affects temporary changes in private-label share, we estimate the following:
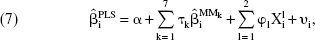
where
Because the dependent variable in Equation 7 is an estimated parameter, ordinary least squares may yield biased estimates of the standard errors. We therefore use weighted least squares (WLS), with the inverse of the dependent variables' standard error as weights. Although WLS estimation will provide consistent parameter estimates, the standard errors of these parameters may still be biased because the marketing-mix comovement elasticities on the right-hand side of Equation 7 are estimated parameters as well and therefore measured with error. We derive corrected standard errors by a bootstrap bias-correction algorithm, using 250 Monte Carlo simulations on each of 1,000 random resamples with replacement (for details, see the Web Appendix [http://www.marketingpower.com/jm_webappendix]).
Step 5: Estimating the Effects on Permanent Gains in Private-Label Share
To test whether cyclical private-label performance and cyclical marketing conduct lead to an increase in the long-term private-label growth rate due to contractions, we estimate the following:

where
Cross-equation effects between Equations 7 and 8 are captured through γPLS. Thus, the error terms of the equations are assumed to be uncorrelated, which precludes the need for a system estimation (Dekimpe and Hanssens 1995).
Our theorizing predicts that countercyclical private-label share (i.e., 
where τk comes from Equation 7 and γPLS comes from Equation 8. The Z statistic of σk is given by

where SE refers to the standard error of the estimate and Z ∼ N(0,1). Under the assumption that stronger procyclical behavior, or less countercyclical behavior, in marketing-mix instrument k (i.e.,
Data
We use annual information from 1985 through 2005 for 106 CPG categories sold in the United States. The data cover a wide range of dry grocery products (both food and nonfood), frozen and refrigerated foods, health and beauty aids, and some general merchandise bought by consumers at grocery stores. Table 1 provides information on the measures and their data source, and Table 2 provides an overview of the products, grouped into broader product fields.
Data Coverage

We obtain information on the private-label share in each of the categories from the Marketing Factbooks, which is published annually by Information Resources Inc. The private-label share in a given category pertains to the annual volume share aggregated across a wide range of retailers, but the set of retailers included changed during the period. Up to 1998, retailers included only grocery outlets, such as supermarkets, mass merchandisers, hypermarkets, and discounters. From 1999 onward, the set of retailers was broadened to other kinds of outlets, such as drugstores. We adjusted the HP filter used in our subsequent analyses to account for a potential level and/or slope shift in the underlying trend because of this change in store coverage (see the Web Appendix [http://www.marketingpower.com/jm_webappendix]). Likewise, we extended Equation 6 with a pulse and step dummy. Our substantive results were insensitive to this issue.
We obtained information on the relevant marketing-mix variables from three data sources: (1) the Marketing Fact-books, (2) Kantar Media Intelligence, and (3) Product Launch Analytics. We used the Marketing Factbooks to obtain information for each category on relative promotional activity for TPRs, in-store displays, and print ad features. The data express the ratio between the volume sales sold with a national-brand promotion and the volume sales sold with a private-label promotion.5] Although this reflects consumer usage of different deals rather than how frequently manufacturers and retailers offer those deals, it is generally accepted that there is a strong link between both measures (Fader and Lodish 1990, p. 54). Moreover, we use the amount of observed retailer support for the national brands as a surrogate for the amount of wholesale support the manufacturers offer because the latter information is not available for our long time span and broad set of categories. 6
Because promotional information for the years 1995 and 1997 was missing, we interpolated the missing data using a state-space representation for the best-fitting autoregressive moving average model (based on the Akaike information criterion), computed with the Kalman filter (Harvey and Pierse 1984). Four categories had at least two consecutive years of missing data, which made the Harvey and Pierse method no longer applicable. In those cases, we opted to use linear interpolation. We obtained the same substantive findings when we excluded those four categories from our analyses.
We thank an anonymous reviewer for this insight.
We also used Marketing Factbooks data to compute for each category a relative regular price (or price premium) of national brands versus private labels. We calculate the relative price as the average regular (unit) price for all national brands in a category divided by the average regular (unit) private-label price for all private labels in that category. 7 Likewise, we use the observed regular national-brand prices in the stores as a surrogate for the suggested retailer price by the national-brand manufacturers.
Because of measurement inconsistencies over time, we could not use the regular price data for national brands and private labels separately. For example, unit prices switched from price per pound to price per ounce or to other equivalent units in certain years. Information on the measurement units, however, was not available. Note that a ratio-based measure is not susceptible to this problem.
Total national-brand advertising expenditures at the category level were supplied by Kantar Media Intelligence. From the same data provider, we obtained retailer advertising expenditures. Kantar Media Intelligence does not provide retailer advertising expenditure by category, mainly because most retailer advertising is generic and does not focus on single categories. Therefore, a relative measure for advertising does not make sense. However, aggregated retailer advertising across all CPG categories, by year, is available, allowing us to derive the overall retailer advertising comovement elasticity. We adjusted all advertising expenditures for inflation, using the 2000-constant-prices deflator obtained from the U.S. Bureau of Economic Analysis.
We obtained information on major and incremental innovation activity by national brands versus retailers per year in the United States in each of the categories from Product Launch Analytics, a subscription-based service of Datamonitor, which focuses on the commercialization of innovations (i.e., market introductions itself) rather than the development of those innovations (i.e., research-and-development expenditures). 8 We used the same data source as Sorescu and Spanjol (2008).
The number of retailer innovations is operationalized as the number of innovations introduced in the United States by the (2000 and 2005) top 100 U.S. grocery retailers.
Consistent with Corstjens and Steele (2008) and Kumar and Steenkamp (2007), we find that retailers are rarely involved in innovation activities (as opposed to me-too products). Thus, a relative measure for innovation does not make sense. However, we derive an aggregate private-label innovation comovement elasticity that includes all retailer innovations across the categories by year. Although we cannot use either of the aggregate comovement measures in our regression Models 7 and 8, which are specified at the category level, we provide for the first time important information on the extent to which retailers exhibit pro- or countercyclical advertising and innovation behavior. Finally, we obtained GDP figures, expressed in constant 2000 prices, from the U.S. Bureau of Economic Analysis.
Results
We first report the results on the three building blocks of our research framework (Figure 1): the cyclical sensitivity of marketing conduct (
For hypothesis testing, we use one-tailed tests of statistical significance. Considering the small sample size (106 CPG categories), in addition to tests of significance at p < .01 and .05, we also report tests of statistical significance at p < .10 (for a similar practice, see Grewal, Chakravarty, and Saini 2010).
How Sensitive Are Marketing Conduct and Private-Label Share to Business Cycles?
Cyclical marketing conduct:
(Equation 3)
Table 3 summarizes the cyclical behavior of our seven marketing instruments. We focus on the meta-analytic results that combine evidence across all categories, rather than on the individual, category-specific, parameter estimates. We perform the meta-analysis on comovement elasticities derived from Equation 3 using the method of adding weighted Zs (Rosenthal 1991). Each individual parameter estimate is based on a maximum of 21 observations, which limits the statistical power of the tests. When combining the evidence across 106 categories, the statistical power is increased considerably, and more generalizable insights are obtained (Lipsey and Wilson 2001).
Cyclical Marketing Conduct and Private-Label Share

The average is weighted by the precision of the parameter estimates, using the inverse of the standard errors (Lipsey and Wilson 2001).
The meta-analysis reports Z-values and one-sided p-values, obtained by the method of adding weighted Zs (Rosenthal 1991).
Notes: N = 106. NBs = national brands, and PLs = private labels.
Our results show that marketing conduct indeed varies systematically across the business cycle. For six of the seven instruments, the overall comovement elasticity is significant and positive, indicating a generalized tendency toward procyclical marketing conduct. As the economy winds down, national-brand managers tend to reduce the number of incremental innovations (mean comovement elasticity = 1.62, p < .01), the number of major innovations (
Regular price premium is the only instrument for which the expected generalized effect is not significant (p = .88). Unlike the other instruments, there is no dominant adjustment pattern to changes in the economy for price, with 52 (54) exhibiting a negative (positive) comovement elasticity, of which 22 (16) were significant.
The magnitude of the comovement elasticities is also instructive. Most elasticities exceed |1|, which indicates that in the CPG industry, market players react strongly to changes in general economic conditions. The strongest effect occurs for the promotion weapon, especially for TPR and display. The relative promotion pressure of national brands declines during economic downturns, just when brands need it the most to hold their own against private labels. Because national-brand promotions are a shared manufacturer–retailer decision, with the retailer having the final say, the observed decline in relative promotion activity can be affected by both manufacturers cutting back on price promotions and retailers reducing the percentage of pass-through. Both factors are plausible. In contractions, managers feel the urgent need to protect the bottom line, and many promotions are not profitable (Srinivasan et al. 2004). Retailers feel the financial pressure as well and may be inclined to reduce the pass-through to support their bottom line or to use this money to subsidize promotions for their own private label. In an expansion period, there is less pressure on both parties' bottom line, which could make them more prone to either spend more on promotions or be more lenient in terms of pass-through.
In general, the correlation between comovement elasticities is low (Table 4), the exception being the moderately sized correlations among the three promotional instruments. This suggests some uniformity in response to the business cycle across promotional instruments. Note, however, that correlations are standardized measures and thus do not take the magnitude of the elasticities into account, which is managerially at least as important. Table 3 already shows that the magnitude of the cyclical fluctuations in feature promotions is much smaller than that of the other two promotion instruments.
Correlations Between Marketing-Mix Comovement Elasticities

Notes: N = 106. NBs = national brands, and PLs = private labels.
As we mentioned previously, there are only few instances of private-label innovations per category. This makes it impossible to estimate category-specific comovement elasticities for relative innovation activity. Nonetheless, our data allow us to provide for the first time preliminary insights into the cyclicality of private-label innovation activity, albeit at an aggregate level (i.e., combined across all categories). We summed all private-label innovations introduced across all 106 CPG categories, as identified by Product Launch Analytics. Next, we applied the HP filter to this time series and regressed the cyclical component of this series on the cyclical component in real GDP. We find that retailers introduce private-label innovations countercyclically (
We followed the same approach for aggregate retailers' advertising expenditures. Although retail advertising may not necessarily feature store brands, it is still instructive to examine this measure to obtain insight into how retailers change their behavior because of economic fluctuations. Here, we find that retailers, like national-brand manufacturers, exhibit procyclical advertising behavior (
Temporary changes in private-label share due to the business cycle:
(Equation 5)
Manufacturers suffer temporarily when consumers switch to private labels during a contraction and then switch back in the following expansion period. The combined evidence across the 106 categories reveals that private-label share behaves countercyclically (
Permanent gains in private-label share due to contractions:
(Equation 6)
Table 5 reports the meta-analytic results for Equation 6. We find that the mean drift parameter δPLS is 2.26 (p < .01). This indicates that private labels are not just a contraction phenomenon but rather exhibit long-term growth of 2.26% per year. It is important to note that this growth figure is expressed in relative terms. For example, if current private-label share is 20%, a long-term growth rate of 2.26% in expansion years implies a total increase of .45% to 20.45%. The growth of private labels over time is due to a variety of factors, including a gradual improvement in private-label quality, an increasing number of retail chains adopting a private-label program, and the deepening (multiple tiers of store brands) and broadening (more stockkeeping units within a tier) of private-label assortments (Kumar and Steenkamp 2007).
Long-Term Private-Label Share Growth in Expansion and Incremental Long-Term Private-Label Share Growth in Contraction

The average is weighted by the precision of the parameter estimates, using the inverse of the standard errors.
The meta-analysis reports Z-values and one-sided p-values, obtained by the method of adding weighted Zs.
The parameters δPLS and ϕPLS are obtained from Equation 6.
Notes: N = 106.
Economic contractions result in an additional permanent loss for manufacturers. During contraction years, the incremental annual private-label growth rate (
The Effects on Temporary Changes in Private-Label Share Due to the Business Cycle
Table 6 (columns 2–4) reports the effects of the cyclical variation in the marketing-mix instruments (τk) on temporary fluctuations in private-label share (
Private-Label Share and Cyclical Marketing Conduct

p < .10 (one-sided, except for control variables for which no hypothesis was developed).
p < .05 (one-sided, except for control variables for which no hypothesis was developed).
p < .01 (one-sided, except for control variables for which no hypothesis was developed).
t-values are based on the bootstrap-corrected standard errors (Nijs, Srinivasan, and Pauwels 2007); Z-values for the indirect effects are based on Equation 10.
A negative (positive) sign for a predictor indicates that the temporary loss (gain) to private labels in a contraction (expansions) increases when the predictor behaves more procyclically (countercyclically).
A positive (negative) sign for a predictor indicates that the permanent loss to private labels due to contractions increases when the predictor behaves more procyclically (countercyclically).
Notes: N = 106.
Cyclical variations in the promotion weapon exhibit the strongest effects on temporary private-label share. If the relative feature pressure of national brands versus private labels is strongly procyclical, this significantly adds to the (counter)cyclical sensitivity of private-label share (τFEATURE = −1043, p < .01). The effect of relative display effort goes in the same direction but is weaker (τDISPLAY = -.0328, p < .10). By far, the strongest effect is when promotions directly involve the element that is foremost on the minds of consumers in contractions: price. The more national brands cut back on price promotions in contractions relative to their store-brand competitors, the stronger are the temporary gains for private labels (τTPR = -.2355, p < .01). Finally, a more procyclical price premium (i.e., a larger price premium of national brands than private labels during expansions than during the contraction) adds to pro-cyclical behavior in private-label share (τPRICE_PREMIUM = .0618, p <. 10).
The Effects on Permanent Gains in Private-Label Share Due to Contractions
Table 6 (columns 5–10) also reports the effects of the cyclical variation in the marketing-mix instruments and the cyclical variation in private-label share on permanent gains in private-label share due to contractions (
Direct effects: γPLS and γk (Equation 8)
As we expected, categories with higher temporary private-label-share increases in a contraction (i.e., more countercyclical and, thus, more negative βPLS) are also more likely to suffer permanent damage (γPLS = -.2022, p < .01). Moreover, if national-brand manufacturers tie the introduction of major innovations more strongly to the business cycle, this will result in a larger direct permanent share loss to private labels (γMAJOR_INNOV = .0547, p < .05). No significant direct effects occur for the other marketing-mix variables, which is consistent with the shorter duration interval of these instruments.
Indirect effects: σk (Equation 9)
We find strong evidence of indirect effects of marketing-mix instruments, through their impact on the cyclical sensitivity of private-label share. Cyclical behavior in national-brand advertising contributes to the long-term private-label growth (ΣADV = .0235, p < .10). Cyclical advertising behavior adds to the cyclical sensitivity of private-label share (τADV = -.1162, p < .05), which in turn contributes to the long-term growth in private-label share (γPLS = -.2022, p < .01). Taken together, this results in an indirect positive effect of cyclical national-brand advertising adjustments on long-term private-label share (σADV = .0235, p<.10). Thus, the dominant pattern of cutting back national-brand advertising in contractions (Table 3) leaves permanent scars on these brands' market share.
We also find indirect effects for two of the three promotion instruments. The cyclical sensitivity of both relative feature activity and relative TPRs is significantly related to the long-lasting effect of a recession on private-label share. In particular, procyclical behavior of relative feature promotions (σFEATURE = .0211, p < .05) and relative TPRs (ΣTPR = .0476, p < .05) contributes to the long-term growth in private-label share.
Differences between Product Classes
The focus in this article is on deriving generalized insights into the relationships among marketing conduct, the business cycle, and private-label share, rather than on specific product categories. Nevertheless, it is instructive and managerially relevant to examine whether differences exist between product classes; here, we distinguish between food and beverages, personal care, and household care. Table 7 reports for each product class the mean values on the variables included in our research framework. Given the modest number of categories in household care and personal care, the results should be considered indicative rather than definitive.
Cyclical Marketing Conduct and Private-Label Share for Three Product Classes

Notes: Means with different superscripts are significantly different from each other (p < .033, after Bonferroni correction), using the weighted two sample t-test (Bland and Kerry 1998). All means are weighted by the precision of the parameter estimates, using the inverse of the standard errors. NBs = national brands, and PLs = private labels.
We find that food and beverages exhibit stronger pro-cyclical behavior with respect to major innovations, TPR, and feature promotions than household care and personal care, while advertising behaves less procyclical and price premium behaves less countercyclically. Personal care stands out in that incremental innovation and feature activity are countercyclical, while they are procyclical in the other two product classes. Personal care also exhibits the strongest degree of countercyclical behavior with respect to pricing, indicating that in this product class, the price premium of national brands over private labels varies more strongly over the business cycle than in the other two product classes. The comovement elasticities for household care are typically in between the comovement elasticities of the other two product classes, the clear exception being display activity, which is significantly more procyclical than the other two product classes. In terms of private-label share, we find that personal care behaves most counter-cyclically and has the highest incremental long-term growth in private-label share due to contractions, while household care has the lowest.
In our regression analyses, we control for mean differences among the three product classes using dummies. However, it might be that the effect of marketing-mix instruments differs between product classes. This could be tested by adding interactions between the two product-class dummies and each predictor to Equations 7 and 8, but given the total number of observations, this is not feasible. Instead, we opted for a piecemeal approach in which we tested for each marketing instrument separately whether its effect differed among the three product classes by adding interactions with the household-care and personal-care dummies. For each equation, only 1 of the 14 interactions was significant at p < .10, a result that would be obtained by chance alone.
Robustness Checks
Alternative values of the smoothing parameter
We assess the sensitivity of our results to alternative values of the smoothing parameter λ (i.e., −50% and +50% of its original [yearly] value of λ = 10). Our substantive findings remain unchanged across alternative specifications, both in terms of the weighted average comovement elasticities and in terms of the effects found for our multivariate regression models.
Endogeneity
A loop of causality might exist between marketing behavior and private-label share in that marketing behavior of national brands and private labels may both affect and be affected by private-label share movements over the business cycle. This gives rise to endogeneity between marketing behavior and private-label share. To test for endogeneity in our models, we derived instruments from auxiliary regressions for each of the marketing variables by regressing the marketing-mix comovement elasticity vector on the weighted average comovement of all categories excluding the focal category (we did this for each of the 106 observations in our sample). 10 The predicted values from these regressions represent appropriate instruments, as they correlate highly with the original regressors (r's ranging from .79 to .98), while being unrelated to the error terms. The Hausman test indicates that endogeneity is not a problem in either Equation 7 (χ2(7) = 4.77, p > .10) or Equation 8 (χ2(7) = 7.10, p > .10).
The average is weighted by the precision of the comovement estimates using the inverse of the standard errors.
Multicollinearity
The modest correlation between the comovement elasticities (Table 4) and the low variance inflation factor values (<2) suggests that multicollinearity is not a serious problem. However, to examine this issue in more detail, we perform an additional analysis in which we randomly drop 10% of our observations from the cross-sectional analysis in Equations 7 and 8 and reestimate the parameter estimates. This procedure is repeated ten times. Table 8 reports the average of the estimates across the ten reduced samples and the mean average deviation (MAD) and the root mean square error (RMSE) between the full-sample estimates and each of the reduced-sample estimates. Our findings reveal a high degree of stability of the parameter estimates across subsamples.
Stability of the Parameter Estimates

Discussion
We summarize our findings around the research questions we set out to address in this study. First, how do managers of national brands and private labels adjust their behavior in response to economic up- and downswings? We document that six of the seven marketing instruments exhibit cyclical patterns. The introduction of incremental and major innovations, as well as advertising by national brands, increases in expansions, while they are cut back again in contractions. Similarly, promotional pressure of national brands relative to private labels is procyclical. With the exception of advertising, market behavior is elastic, in that the intensity of these marketing instruments exhibits greater fluctuations than the economy at large. The greatest fluctuations occur for the promotional weapon, with display and TPR exhibiting average fluctuations in relative intensity that are more than four times greater than the magnitude of the corresponding fluctuations in the state of the economy. This indicates that promotions are the marketing instrument that is most influenced by the state of the economy. Finally, the price premium of national brands over private labels is, on average, insensitive to business-cycle fluctuations. We document some notable differences in marketing conduct across the product classes of food and beverages, personal care, and household care.
Second, do these business-cycle-induced adjustments in marketing contribute to (1) temporary changes in private-label share and (2) permanent gains in private-label share? We find that the observed cyclicality of marketing conduct indeed affects private-label share and does so in a variety of ways. Procyclical advertising spending leads to countercyclical adjustments in private-label share, which in turn leads to a permanent increase in private-label share. This is also the case when the level of promotional support for national brands relative to private labels closely follows the business cycle. Procyclical movements in the price premium of national brands over private labels also add positively to the extent of cyclical variation in private-label share, but they have no significant long-term impact. Furthermore, procyclical activity with respect to major new product introductions by national brands is associated with a permanent loss of share to private labels. That the magnitude of the loss in market share to private labels should be of paramount concern to brand managers is highlighted by our findings. In expansions, long-term private-label share grows, on average, by 2.26% per year; in contractions, the annual growth rate accelerates to 7.65%.
Managerial Implications
Managers cannot prevent economic contractions from happening. However, our results indicate that they can mitigate or attenuate the impact of macroeconomic developments. In contractions, consumers increasingly switch to private labels, if only because they need to save money. Some of these contraction-induced losses to private labels are permanent—that is, they are not recovered in a subsequent expansion. However, by pursuing particular strategies, national-brand managers can limit the extent of their losses to private labels, whereas retailers can further boost the extent of these gains for their private labels.
Implications for National-Brand Manufacturers
We find that national brands tend to delay launching new products until demand expands again. Our results show that this current practice is justified for incremental innovations. Incrementally new products are less costly to introduce, but they are easier to imitate quickly and do not reduce private-label share. We find that major innovations are needed to limit private-label growth. They are more difficult to imitate, and keeping up their rate prevents national brands from losing a unique expertise/skill set that is difficult and time consuming to recoup in the subsequent expansion (Fatás 2000). However, this is not what brand manufacturers do. We document that the introduction rate of major new products is procyclical, while a more evenly spread strategy would help counter long-term private-label growth.
The prevailing practice to let advertising budgets swing with the business cycle also contributes to the erosion of the market share of national brands. Again, a missed opportunity can be identified. When the economy winds down, manufacturers should try to maintain their current spending or even raise advertising if that is financially feasible. In expansion periods, consumers are intrinsically less inclined to buy private labels, and advertising is less needed to insulate consumers from focusing too much on price. While advertising may still be called for as a competitive weapon against other national brands, it becomes relatively less relevant in the battle against private labels.
In contractions, national-brand promotional activity declines relative to private-label activity, just when brands need it the most. This results in a significant increase in private-label share in recessions, which subsequently leaves permanent scars on national-brand performance. The effect of TPRs is particularly strong. Cyclical behavior with this instrument has the strongest effect of all instruments considered.
The procyclical patterns in relative promotional activity disguise whether this observed behavior is due to national-brand manufacturers, private labels, or any combination in which one channel partner adjusts more or less than the other. To enhance our understanding on what is happening, in Table 9 we calculate the comovement elasticities for national brands and private labels separately, measured as the national brands' (private labels') volume sold in a specific promotional condition (i.e., display, feature or TPR) divided by total national-brand (private-label) volume sales. The findings shed light on the causes of the observed nature of the cyclicality of the relative promotional activity of national brands versus private labels. 11 The observed pro-cyclical pattern in relative display and feature activity is not because in contractions, national brands cut back on these activities while private labels intensify them, while the reverse happens in expansions, but rather because display and feature activity by private labels is much more countercyclical than display and feature activity by national brands. Conversely, procyclical behavior with TPR is only observed for national brands (an acyclical pattern occurs for private-label TPRs). These promotion results put brand managers in a bind. The TPRs directly hit the bottom line, which is already under pressure in contractions, and therefore we can speculate that retailers may be less inclined to pass on the entire promotion to consumers. This would mean that in tough times, brand managers need to work even harder to negotiate a high pass-through.
Promotional Activity Comovement Elasticities for National Brands and Private Labels

A cautionary note is warranted. The comovement elasticities for national brands and private labels separately should be treated as indicative rather than definitive because they suffer from endogeneity concerns. The denominator of national-brand (private-label) promotion activity is national-brand (private-label) sales, which comove with the business cycle. This would create endogeneity in our model. Our ratio-based approach, in which we divide national-brand volume bought on promotion by private-label volume bought on promotion, does not include such a direct linkage to volume sales and therefore is less susceptible to the issue. As reported previously, we explicitly test for reverse causality with our measures and find that this is not an issue. The endogeneity issue is the main reason we did not include these separate measures in Equations 7 and 8; another reason is that our model is already at the lower bound of the number of observations to number of parameters ratio.
Previous research has argued that a growing focus by national brands on price promotions hurts national brands' share in the longer run, because it stimulates price sensitivity (Mela, Gupta, and Lehmann 1997) and decreases brand distinctiveness (Mela, Gupta, and Jedidi 1998), which over time might enhance private-label popularity (Kumar and Steenkamp 2007). Our findings, however, show that national brands should nevertheless consider increasing TPRs during contraction years, as such countercyclical behavior helps attenuate the popularity of private labels induced by the downturn. We do not recommend to permanently increase the intensity of price promotions but rather suggest that national-brand managers should reallocate some of the price-promotion budget from good times to bad times (i.e., reduce the extent of procyclicality of their TPRs).
Finally, the national-brand price premium over private labels is, on average, insensitive to economic ups and downs. Still, temporary decreasing regular price for the national brands in contractions helps prevent consumers from switching to the private labels during contractions. A caveat should be noted though. Similar to promotional tools, the manufacturer sets wholesale prices, while consumer prices are set by the retailer. Nevertheless, it is reasonable to assume that brand managers can influence consumer prices in their negotiations with the retailer (Ailawadi et al. 2009, p. 43). However, given that both TPRs and reductions in regular price have a strong and immediate effect on the bottom line, and considering that price promotions have a much stronger temporary and permanent effect on private-label performance than the price premium, we recommend that managers spend their limited resources on the former.
Implications for Retailers
Contractions offer a golden opportunity for retailers to boost the share of their own brands. By judiciously using the right strategies, they can enhance private-label share even more, both during the contraction and afterward. Our finding that promotional support for private labels is more countercyclical than promotional support given to national brands is right “on target.” Private labels shift their promotional resources to that period in the business cycle when consumers are most susceptible to their lure. Overall, price premiums are insensitive to economic contractions and expansions. Still, temporary broadening the price gap (i.e., decreasing the private-label prices and/or increasing national-brand prices) in their stores could even further convince consumers to switch to their store-brand alternatives.
Given the only sporadic use of innovations and category-specific advertising to support retailers' private labels in our sample period, we were unable to derive category-specific comovement elasticities for these instruments. When aggregating across all CPG categories, the total number of new product introductions carrying a store-brand name increases during contractions and decreases during expansions. We speculate that this countercyclical new product activity enhances store-brand popularity in contractions and beyond, implying that retailers are doing a good job. With regard to advertising, retailers' spending (which is mostly generic) mimics national brands' behavior in that it is procyclical. Given that national brands also increase their spending during economic expansions, the competitive clutter will be considerably higher (Danaher, Bonfrer, and Dhar 2008). As consumers are also less sensitive to private labels' most favorable attribute (i.e., a low price) during such times, we question whether this is the most appropriate strategy for private labels. Instead, a countercyclical spending strategy may be advisable, as this would allow for more spending when competitive clutter is lower, when consumers are more open to the price argument, and when retailers need to communicate their increased private-label offering.
Limitations and Directions for Further Research
The promotional and price measures used in our analyses are relative measures, which can result from a variety of responses of national brands versus private labels to the business cycle. We reported comovement elasticities for national brands and private labels separately, but these findings are indicative rather than definitive because of endogeneity concerns, which need to be addressed in future research. Moreover, the promotional and pricing data are the net effect of manufacturer and retailer behavior. It would be worthwhile to determine whether retailer pass-through rates for manufacturer promotions change over the business cycle. For example, retailers might command greater wholesale support for a given level of retail support when power shifts in favor of the retailers (e.g., during an economic downturn).
We conducted our analyses at the category level. Within a category, individual brands will differ in their ability to fight store brands. For example, do market leaders react differently to economic swings than small brands? Are those leaders better able to sustain in a contraction when consumers face significant adjustments in their grocery budgets (Ma et al. 2011)? Are they better positioned than smaller players to recoup any losses in the subsequent expansion period? Furthermore, private-label market share in a category is not the only performance metric for national brands. Further research could consider brand-level performance metrics, such as brand profitability, loyalty, and price sensitivity, over the business cycle.
Conclusion
In summary, valuable lessons can be learned from marketing practice over the last 20-plus years. During that period, successive generations of national-brand managers and retail managers were confronted with economic contractions. The economic hardship caused by contractions provides a powerful impetus for private-label growth. Retailers' observed practice of supporting their own labels in contractions helps this contraction-enhanced private-label popularity even further. In contrast, national-brand manufacturers have been partially responsible for how much these contractions helped strengthen their fiercest enemy, the private labels owned by their very customers. National brands' tendency to reduce major new product introductions, advertising, and relative promotional pressure in contractions, while ramping them up only when the economy is again improving, is associated with temporary as well as permanent gains for private labels. Thus, opportunities to limit private-label growth have been missed.
We do not argue that national brands should just spend more on marketing in bad times. That may not be realistic and would play to a criticism frequently levied against marketing managers—that they always want to spend more. Rather, we recommend that national brands reallocate some marketing investments from good times to bad times. By spending not more but more smartly, national brands can be more effective in fighting private labels for the same marketing budget. This requires that national-brand manufacturers take a business cycle, multiyear perspective on marketing investments, rather than a short-term quarterly perspective on marketing expenditure. As slumps in the stock market offer great investment opportunities, slumps in the real economy offer great opportunities for the managers who invest in marketing. Our evidence indicates that a countercyclical strategy is associated with greater success in fighting the enemy you love to hate. If you wait until the good times come back again, you ignore the advice given by the legendary ice-hockey player Wayne Gretzky: “I skate to where the puck is going to be, not to where it has been.” We hope that our findings provide an impetus to follow Gretzky's advice.
References
Supplementary Material
Please find the following supplemental material available below.
For Open Access articles published under a Creative Commons License, all supplemental material carries the same license as the article it is associated with.
For non-Open Access articles published, all supplemental material carries a non-exclusive license, and permission requests for re-use of supplemental material or any part of supplemental material shall be sent directly to the copyright owner as specified in the copyright notice associated with the article.