
Abstract
Higher sales and margins are key goals for retailers promoting emerging products, such as organics, but little is known about their marketing effectiveness and their cross-effects on conventional product sales. Extant research reports conflicting results about price and promotional sensitivity for organic products and does not address the impact of organic assortment. This article calculates long-term own- and cross-elasticities of organic and conventional product sales in response to changes in assortment, price, and promotions. Using a rich data set of 56 categories, the authors test hypotheses on how different costs and benefits of organic products affect these elasticities. They find that enduring actions, such as assortment and regular price changes, have a higher elasticity for organics than for conventional products. In contrast with common wisdom, even “core” organic consumers are sensitive to these actions. Increasing organic assortment and promotion breadth yields higher profits for the total category, as do more frequent promotions on conventional products. The category comparison yields specific advice with regard to where larger assortment and lower prices versus more and deeper promotions are most effective.
Keywords
In today's marketplace, many retailers perceive a key opportunity in organic products, whose U.S. sales have grown 17%–21% each year, compared with 2%–4% growth in nonorganic (hereinafter “conventional”) product sales (Progressive Grocer 2009). The Great Recession has not dampened this growth (Brandweek 2009), which may be furthered by the appointment of an organics expert to the U.S. Agriculture Department's number-two post with a budget allocation of $50 million specifically to fund new organic initiatives. The majority of U.S. consumers eat organic products at least occasionally, and organic products are now available in more than 70% of traditional supermarkets, such as Kroger and Safeway (The Hartman Group 2008).
Retailers hope that promoting organic products will increase total category margins and store revenues, in addition to enhancing stores' long-term image, equity, and differentiated positioning (Chain Store Age 2009). Our interviews with retail managers of two large northeastern United States supermarkets revealed their belief that organic products will become more established, thus generating tangible benefits for retailers that are willing to invest in them. However, key questions remain as to where such investments pay off most and how they affect conventional product sales and retailers' category and store performance.
Current marketing literature is rich in how consumers make trade-offs among different conventional products in a category and how price and promotions affect such tradeoffs (e.g., Bijmolt, Van Heerde, and Pieters 2005; Sethuraman and Srinivasan 2002). However, retailers are unsure about how these general findings apply to organic products, given the mixed evidence on price elasticity (from −9.73 in Glaser and Thompson [2000] to -.001 in Kiesel and Villas-Boas [2007]), the surprising recent findings on promotional elasticity (negative in Ngobo [2011]), and the absence of research on how organic assortment benefits organic sales, category margin, and store revenues. Conceptually, some studies predict higher own marketing elasticities for organics because of the high price premium over conventional products (Glaser and Thompson 2000; Verhoef 2005). In contrast, Ngobo (2011) postulates lower own marketing elasticities (even of an opposite sign to conventional products) because consumers associate low prices and promotions with low-quality and “popular” products, jeopardizing the special status of organics. Indeed, research has not even established that cross-elasticities with conventional products are asymmetric in favor of (higher-priced) organic products (e.g., Blattberg and Wisniewski 1989; Sethuraman and Srinivasan 2002). Violating this general rule, the only econometric analysis on the subject reports asymmetry in favor of conventional products (Glaser and Thompson 2000). Finally, survey-based research indicates that consumer response to organic product marketing may differ by category and consumer segment. What is lacking is a large-scale study of what this means for the effectiveness of marketing organic products in driving organic sales and retailer performance.
Why might organics be “special” compared with other expensive products? Consumers state different motivations for buying and consuming organics, such as health, environment, and animal welfare concerns (Bourn and Prescott 2002; Fotopoulos and Krystallis 2002; Makatouni 2002; Zanoli and Naspetti 2002). Consumers have also expressed skepticism whether these motivations can be fulfilled in mainstream supermarket chains, and researchers have questioned the use of traditional marketing actions to promote organics (Ngobo 2011). In this context, our specific research questions are as follows:
What is the long-term own-effect of assortment, regular price, discount breadth and depth, and price specials for organic products versus conventional products?
How does the marketing of organic products stimulate purchases across different levels of consumer organic usage (i.e., “core” organic vs. “noncore”)?
How large are the cross-effects of organic product marketing activities on conventional product sales, and vice versa?
Which types of conventional products (i.e., top-tier and second-tier national brands and private labels) are affected the most by marketing actions of organics, and vice versa?
What is the effect of marketing organic products on category and store performance?
On the basis of the perceived benefits and costs of organics, we propose that enduring retail actions (assortment and regular price) generate higher consumer response for organics than for conventional products, but temporary actions do not. Our analysis across 56 categories identifies and quantifies how consumer response differs, which yields concrete insight for retailers into where and how to devote their marketing resources to increase category and store performance. In contrast with recent advice that retailers should keep organic prices high and avoid point-of-purchase promotions (e.g., Ngobo 2011), we find that organic sales increase strongly with lower regular prices, even for consumers with high intrinsic value for organics (the core organic segment). We also find substantial benefits of increasing organic assortment to overall category margin, especially in produce categories. In contrast with Glaser and Thompson (2000), we find that (price) promotions of conventional products do little harm to organic product sales, thus offering specific guidelines to retailers on how to strike a balance between emerging and mature products.
More generally, this article contributes to the burgeoning literature on the marketing and consumer adoption of sustainable/ethical products (e.g., Henderson and Arora 2010). Recently, issues pertaining to sustainability have received considerable attention not only from governmental agencies (e.g., U.S. Environmental Protection Agency green product programs) but also from firms (e.g., Clorox Green Works), which are investing considerable resources into the design and marketing of products or initiatives that create long-term societal value (e.g., Kotler 2011). Thus, implications from our research are germane to the design of programs that influence public policy, resource management, and health behavior.
Research Background
Organic Food Products at Conventional Retail Outlets
Currently, consumers in the United States buy more organic products in traditional supermarkets than in other outlets (TABS 2012). At the same time, traditional supermarkets are increasingly promoting organic products through various in-store marketing programs (e.g., increasing variety, displays). Because organics have higher gross margins—30% to 50% versus 20% to 25% for conventional products (Oberholtzer, Green, and Lopez 2006; Roheim and D'Silva 2009)—promoting them should enhance total category profits and store revenues. However, academic literature has yet to verify such performance effects of marketing actions for organics because it has focused instead on other supply-side and demand-side issues (Thompson 1998).
On the supply side, Dimitri and Oberholtzer (2009) find that organic farmers sometimes struggle to provide sufficient supply to keep up with the rapid growth in demand, and Ciu (2008) reports that some farmers have struggled to obtain the necessary certification to market produce as organic. Finally, Tondel and Woods (2006) find that organic supply is becoming more competitive and efficient, lowering prices throughout the supply chain.
On the demand side, previous research falls into three broad categories: (1) self-report surveys and interviews that uncover the motivations for consumers to buy organic products, and the category factors that favor organic adoption, (2) studies on product health claims and labeling, and (3) econometric analyses of how individual household characteristics and retail prices affect panelist demand for organic products and their reaction to marketing for organic products. We discuss these in turn.
Why Do Consumers Buy Organic versus Conventional Products?
Motivations for buying organics include health reasons, environmental concerns, nutritional value, and taste (e.g., Bourn and Prescott 2002; Fotopoulos and Krystallis 2002; Zanoli and Naspetti 2002) as well as considerations regarding ethics and animal welfare (Makatouni 2002). Some consumers also acknowledge that social approval plays a role in their purchase of organic products (Grunert and Juhl 1995). Self-reported obstacles inhibiting organic product purchase are their low availability and distribution, their price premium, and consumer lack of knowledge (Bonti-Ankomah and Yiridoe 2006). Consumers often begin with organics in categories such as produce, meat, and dairy, for which they perceive higher benefits from going organic (Oberholtzer, Green, and Lopez 2006; Organic Trade Association 2009a).
How Does Product Labeling Affect Consumers' Responses to Organic Products?
Studies in marketing have analyzed the role of product/nutrition claims in consumer food choices. Kozup, Creyer, and Burton (2003) report that consumers' positive attitudes toward products are enhanced when favorable nutritional (e.g., fortified with vitamins) or health (e.g., heart-healthy) claims appear on the packaging. In the context of our study, organic product labeling and certification logos have been shown to play an important role in stimulating consumer appeal for organics. Using Rokeach's (1968) theory of value and halo effects (Han 1989), Bauer, Heinrich, and Schafer (2012) report that organic labeling results in a higher level of perceived healthfulness, hedonism, environmental friendliness, and food safety. Janssen and Hamm (2012) hypothesize that because organic products are credence goods, a high degree of uncertainty is associated with them, and appropriate labeling might mitigate this uncertainty. Given these findings, third-party certification is superior because consumers have greater trust in independent certifiers than private manufacturers. However, consumers do not perceive all types of labels to be the same. Generic organic labels, which typically list the word “organic” on either the brand or the product description, do not elicit the same kind of trust that organic certification logos do (e.g., the U.S. Department of Agriculture [USDA] seal). Moreover, Janssen and Hamm (2012) find that well-known and trusted certification logos command the highest price premiums. Similar findings are reported by Kiesel and Villas-Boas (2007), who find that consumer response in the milk category is higher for certification (USDA) logos than for organic labels or other markers (e.g., rBGH-free [i.e., free of the recombinant bovine growth hormone]), especially after the National Organic Program went into effect. In this study, we consider organic products with the USDA seal (certification logo) and organic products without the USDA seal but with generic organic labels on the packages.
How Do Consumers React to Retail Marketing Actions for Organic Products?
A handful of studies use revealed data (typically scanner panel) to analyze how organic consumers react to retail prices. Glaser and Thompson (2000) report large price elasticity (between −3.63 and −9.73) for U.S. organic milk in the late 1990s. In contrast, Kiesel and Villas-Boas (2007) report small price elasticity (between -.001 and -.003) for U.S. organic milk in the 2000s. In the most recent study, based on French data, Ngobo (2011) finds that lower prices and wide distribution make shoppers less likely to buy organics up to a point; Ngobo concludes that organic products may be a poor fit for the typical marketing actions of traditional retailers. In summary, the magnitude, and even the sign, of organic price elasticity remains an empirical question.
An issue with these studies is their representativeness for all the shoppers at a mainstream retailer. Relying on a panel of households, they further restrict the panel to account for the paucity of organic purchase observations as opposed to the conventional ones. Thus, they focus on the core organic consumer segment while ignoring the noncore segment, whose purchase of organics represents a key opportunity and challenge for retailers. Moreover, most of the previous studies analyze a few, mostly similar categories. Finally, they do not analyze the effects of increasing organic assortment, which is a relatively costly and enduring decision for retailers. These limitations impede actionable insights into what marketing actions retailers can undertake and in which categories to increase overall retail performance (e.g., by increasing organic sales without decreasing conventional sales). This article contributes to this research stream by quantifying the long-term own- and cross-elasticities of organics and conventional product groups using store data across 56 categories spanning seven years. Next, we develop our hypotheses.
Hypotheses Development
We develop our hypotheses on the basis of consumers' perceived benefits and costs of buying organic versus conventional products. Perceived benefits of buying organics include health, nutritional value, taste, animal welfare, ethics, and environmental protection (e.g., Bourn and Prescott 2002; Fotopoulos and Krystallis 2002; Makatouni 2002; Zanoli and Naspetti 2002). However, buying organic products represents a cost to a mainstream retailer's consumers because organic products are typically (1) more expensive than conventional products and (2) more difficult to find in the exact form, flavor, and quantity the consumer prefers (Michelsen et al. 1999). The former represents an out-of-pocket monetary cost to the consumer, and the latter denotes a transaction cost. Our key assertion is that consumers weigh the potential benefits of organics by these costs, which are likely to endure throughout their future purchases of organic products. Indeed, assortments and regular prices are “sticky” compared with temporary actions such as displays, features, and promotions (Pauwels 2004). This assertion is grounded in previous literature on organics.
A regular, diverse, and accessible supply of organic products is vital for inducing higher organic sales (Silver-stone 1993). The wider the assortment of organics, the greater is the likelihood of the availability of specific flavors and/or package sizes, which creates more opportunities for customers to buy them (Aertsens, Mondelaers, and Van Huylenbroeck 2009). Reduced distribution would create more transaction costs, making it less worthwhile for the typical retailer's consumer to buy them (Campo, Gijsbrechts, and Nisol 2000). Likewise, if consumers perceive the price of organics as high, they will be less willing to purchase them (Michelsen et al. 1999; Verhoef 2005; Zanoli and Naspetti 2002). Thus, organics capture a larger category share when their price premium over conventional products is relatively low (Wier et al. 2003).
Would temporary actions such as price promotions, feature, and display have the same effect? They may if they represent a buying incentive as strong as assortment and regular price changes, with less potential for perceived quality erosion (Delvecchio, Henard, and Freling 2006). However, we assert that temporary actions will be less effective for organic products, which represent a more enduring involvement. Previous research has shown that consumers choose organics as a means of achieving important life values (Makatouni 2002). Therefore, consumers are likely to consider not just the costs and benefits at the current purchase situation (for which an organic product may be available at a low promotional price) but also the future likelihood that they can buy a suitable organic product at a reasonably low price. In summary, enlarging assortments and decreasing (regular) prices, but not increasing temporary promotions, should be more effective for organics than for conventional products.
The long-term own-elasticity of sales to (a) assortment and (b) regular price is greater for organic products than for conventional products.
The extent to which such enduring costs represent obstacles to buying organics should depend on the strength of a consumer's conviction regarding the benefits of organic products. Although it is typically not cost-effective for mainstream retailers to survey all shoppers on this matter, they can infer such conviction from revealed preferences (i.e., the consumer's general purchase patterns of organic products). Core organic consumers frequently buy organic products, revealing a higher intrinsic value for organic over conventional products. Previous research has shown that such consumers tend to be socially conscious (e.g., show greater environmental orientation) and also exhibit a greater concern for their health (Zanoli and Naspetti 2002). Consumers with such values should be less sensitive to the enduring costs of limited assortment and the high price of organic versus conventional products in any specific category. In contrast, noncore organic consumers have little experience with organics in general. A limited assortment and/or high regular price may be key deterrents for buying a specific organic product. Thus, the lower intrinsic value of organics should translate into a higher sensitivity to regular price and assortment.
The long-term own-elasticity of organic product sales to (a) assortment and (b) regular price is lower for core organic consumers than for noncore organic consumers.
Next to their intrinsic preference for organics, consumers' sensitivity to organic marketing may also depend on the perceived cost-benefit trade-off in a specific category. Category-specific costs include the category's expensiveness and share of the consumer's wallet and the organic price premium (over conventional products). Moreover, perceived costs of trying new, expensive products are lower in impulse purchase categories, which should stimulate organic sales. Perceived benefits from buying organic are greater for products with higher purchase frequency and products that are directly related to taste, environmental, animal welfare, and local farmer concerns (Fotopoulos and Krystallis 2002; Makatouni 2002). Such direct-from-the-farm categories include produce, dairy, meat, and poultry products (Davies, Titterington, and Cochrane 1995; Verhoef 2005). The health benefits of organic products are also more congruent with virtue products (connected with self-control goals) than with vice products, which provide immediate gratification (Wertenbroch 1998). Finally, storable products are visible longer at home to consumers (and their friends and family), which increases the salience of organic benefits. Note that previous literature has discussed the impact of such category characteristics only on organic appeal and sales (i.e., a main effect), not on consumer response to marketing in such categories. We expect that greater organic appeal in a category may also translate into higher consumer reactions to organic marketing in that category.
When organic marketing activities succeed in raising organic sales, how will this affect the sales of conventional products in the same category? Consumers may simply add the organic product to their shopping basket (e.g., when a newly introduced organic product adds a salient attribute to the category) (Boatwright and Nunes 2001). Impulse-buy categories are especially prone to this behavior. In general, however, such “free lunch” for the retailer is unlikely: Consumers tend to focus on the perceived value of organic versus conventional products and thus substitute the conventional product with the organic product (Durham and Andrade 2005; Kiesel and Villas-Boas 2007). Thus, successfully promoting organic products should reduce demand for conventional products in the same category.
Cross-elasticities with conventional products should be asymmetric in favor of higher-priced organic products if, as we believe, the asymmetric price competition literature applies (Allenby and Rossi 1991; Blattberg and Wisniewski 1989; Kamakura and Russell 1989; Sethuraman and Srinivasan 2002; Sivakumar and Raj 1997). In addition, if organic products bestow intrinsic quality benefits to the consumer (e.g., provide health benefits, taste better), switching back to conventional products would represent a loss in those benefits, which consumers aim to avoid (Bronnenberg and Watthieu 1996).
Long-term cross-effects are asymmetric; organic marketing activities hurt conventional products sales more than vice versa.
Finally, which type of conventional products should experience most harm from organic marketing activities? In addition to the price-tier effect (e.g., Nowlis and Simonson 2000), previous literature has shown that brands whose prices are closer have higher cross-price effects than brands that are priced further apart (Sethuraman and Srinivasan 2002; Sethuraman, Srinivasan, and Kim 1999). Thus, we maintain that organic marketing activities will hurt sales most for brands that are more similar to organic brands in terms of expense—first top-tier national brands, followed by second-tier national brands and private labels.
Methodology
Our research questions suggest a methodology for analyzing marketing effects on sales and aggregate retailer performance (sales revenues and profits), while accounting for potential marketing endogeneity. Therefore, we chose the persistence modeling approach (Dekimpe and Hanssens 1995), which has previously been applied to long-term marketing effectiveness for conventional products (e.g., Nijs et al. 2001; Pauwels, Hanssens, and Siddarth 2002), offering a basis for comparison. This approach involves four steps. First, unit root and cointegration tests investigate whether the performance and marketing variables are stationary, evolving, or cointegrated (Enders 2004; Johansen, Mosconi, and Nielsen 2000). Second, using the test results, we estimate a vector autoregressive (VAR) model or a vector error correction (VEC) model (Dekimpe and Hanssens 1999). Third, we compute impulse response functions, which track the effect of a marketing variable on the performance variables of interest over time (Pesaran and Shin 1998). Fourth, we perform a weighted least squares regression of the estimated long-term elasticities on the product category factors, using the inverse of their standard errors as weights (Srinivasan et al. 2004).
The econometric specifications have been well documented in previous literature (e.g., Trusov, Bucklin, and Pauwels 2009). The researcher chooses (1) the endogenous variables that are explained by the model, (2) the exogenous variables that may affect the endogenous variables but are not themselves affected, and (3) the lag length (p), based on the Bayesian information criterion, which trades off prediction accuracy and model complexity. After model estimation, we perform the required diagnostic checks on the residuals (Franses 2005) and report on the explanatory power of each model. The VAR model has the general specification shown in Equation 1 for each category (e.g., Srinivasan et al. 2004):

The holidays are Easter, Memorial Day, Independence Day, Labor Day, Halloween, and Thanksgiving as well as the week after Thanksgiving, Christmas, and New Year's.
We assess H1 and H3 in our sales model, which connects organic and conventional product sales with their respective marketing actions. Thus, the endogenous variables in the model are (1) the logarithm of assortment size, unit price, promotion breadth, promotion depth, and price specials, respectively, for organic and conventional products (marketing variables) and (2) the logarithm of volume sales for organic and conventional products (performance variables).
We assess H2 by replacing the two performance variables with organic and conventional sales from the core organic and noncore organic segments. We assess which conventional brands are hurt most by replacing conventional sales and marketing variables with the corresponding variables of first-tier national brands, second-tier national brands, and private labels. To avoid overparameterization in this model, we use price and assortment and promotion breadth and depth separately as endogenous variables, while including the remaining marketing variables as exogenous. Finally, to analyze store performance, we replace the performance variables with category profits and store revenues. Further models investigate the robustness of our findings to, respectively, quadratic price effects, social influence, different definitions of “organic” products, and store heterogeneity.
After VAR model estimation, we obtain long-term marketing elasticities through generalized impulse response functions (Pauwels, Hanssens, and Siddarth 2002). We calculate the “long-term marketing elasticity” (because we have a log-log model specification) as the cumulative effect (i.e., summing up all significant impulse response coefficients). Note that we do not recalibrate the model for insignificant impulse response values, as these are derived from the estimated coefficients (Pauwels 2004). In the final step, we use the estimated long-term marketing elasticities in the weighted least squares regression (using the inverse of their standard errors as weights) to investigate how they are related to the category characteristics (Nijs et al. 2001; Srinivasan et al. 2004):

We include in Equation 2 the virtue nature of the product (VIRTUE) and whether the category is of the type corresponding to dairy, meat, and poultry or produce (PRODUCE). In addition, we include the characteristics related to category purchase frequency, storability, impulsivity, category expensiveness, market concentration, category share of consumer wallet, organic price premium (over conventional price), organic penetration (current base), and organic growth rate, which may capture unobserved category-specific factors. We collectively refer to these variables as (the vector) Zi in Equation 2. Table 1 presents our operationalization of the category drivers.
Variable Operationalization for Long-Term Marketing Elasticities Regression Equation

In addition to persistence modeling, we examine the relationships of interest with the Koyck model (Franses and Van Oest 2007), which allows for all same-week effects specified in the VAR model and for some dynamic marketing effects through autoregressive and moving average terms. Equation 3 shows the Koyck model for organic sales (Org_Volt):

The independent variables in the preceding equation—Org_GPt, Org_PBt, Org_PDt, Org_PSt, and Org_Astt as well as Con_GPt, Con_PBt, Con_PDt, Con_PSt, Con_Astt—refer to regular price, promotion breadth, promotion depth, price specials, and assortment for organic as well as conventional products, respectively. We estimate the same Koyck model specification with conventional product sales as the dependent variable. Maximum likelihood estimation yields the coefficient estimates for the models (Franses and Van Oest 2007). Compared with the VAR model, the Koyck model is more parsimonious but imposes exponential decay (vs. more flexible dynamic effects, such as wear-in and wear-out), and the feedback effects among the performance and marketing variables are absent. We investigated for the presence of such feedback effects with Granger (1969) causality tests.
Data
The data come from a large retail chain in the northeastern United States that operates 75 stores. The store-level data contain purchase transactions for volume sales, actual prices, and retailer/manufacturer discounts for each stock-keeping unit (SKU). In addition, we have data pertaining to the costs (or wholesale prices) for each SKU for the entire chain, which enables us to calculate retailer gross profits. Using this information, we compiled a data set that spans 355 weeks (January 2004 to October 2010) across the 49 food and 7 nonfood categories (for detailed data description, see Appendix B).
We analyzed all food and nonfood categories in which the retailer had at least two organic SKUs. All food organic SKUs have the USDA seal, which is permitted for two classes of products: 100% Organic and (at least 95%) Organic (the seal is not permitted for two other classes: Made with Organic Ingredients and Less than 70% Organic Ingredients). In the case of nonfood products, USDA labeling is mostly absent, so we use the Organic and Made with Organic Ingredients classification instead.
Because the focal retailer follows a chain-level strategy with respect to assortment, pricing, and promotions, we decided to aggregate the data from the store level to the chain level, as well as from the SKU level to the product group (organic vs. conventional) level in each category. We operationalize weekly assortment as the number of unique SKUs the retailer carries. Price is operationalized as price per unit calculated for each SKU and then share weighted by the SKU market share using constant weights for each store (Pauwels and Srinivasan 2004). We define “promotion breadth” as the percentage of SKUs that are promoted in a given week for a given store. To obtain the promotion depth variable, we first calculated the per unit dollar discount, which is the difference between the promotion price and the regular price. We define the regular price as the average of the previous four nonpromoted prices (see Hendel and Nevo 2006). We then obtain the promotion depth as a percentage by dividing the unit dollar discount by the unit regular price. Price specials capture the feature and display activities, and we set them to 1 if a particular SKU is on a price special; we then aggregated them to the category level using constant weights for each store. We aggregated all the variables to the chain level using store sales as weights.
In our analysis, we considered all organic and conventional SKUs. The focal retailer has actively marketed organics since 2004. The organic products are stocked both near the conventional products and in specially designated sections of the store. (The retailer uses a mix of integration/separation strategies with respect to organics.) Moreover, store features contain advertising for both organic and conventional products, and displays are used for both types of products throughout the store. Thus, consumers are exposed to the marketing activities of both organics and their conventional counterparts.
Marketing activity differs substantially not only for organic versus conventional products but also across categories at the focal retailer. We find that product assortment for organics is 25% of that for conventional products, on average, with their largest assortment (both absolute and relative to conventional products) being in processed food categories (e.g., cereal, crackers, jams/jellies) and the smallest in produce. The gross prices for organics are higher than those of conventionals in each category, but this price premium varies substantially. Notably, conventional products experience more promotional activity: promotion breadth, depth, and frequency of price specials. Again, the differences between categories are striking; for example, organic products are on price specials quite often for dairy, produce, cereal, salad dressing, and jams/jellies. Retail margins are, on average, 25.18% higher for organics; this difference is the highest for frozen pizza and the lowest for grapes. Average annual growth rates for organic products are approximately 17.85% versus 2%–3% for conventional products, in line with U.S. trends during the analysis period (Organic Trade Association 2009b). Organic penetration ranges from a high of 27.71% (greens: salad/others) to a low of .35% (cheese), while organic premium ranges from a high of 182.30% (eggs) to a low of 5.72% (tomatoes). In general, organic premiums are high for dairy, meat, and poultry categories (e.g., eggs, beef, milk) and low for produce categories (e.g., tomatoes, lemons, grapefruits), which are dominated by generic rather than branded organics.
Although store-level data have the benefit of covering all purchases, they do not allow us to distinguish consumers who frequently buy organic products (the core organic segment) and those who do not (the noncore organic segment). To this end, we obtained panel data, which record individual transactions covering 95.4% of all purchases made at the retailer. The panel data cover the same period and categories as the store-level data. We grouped consumers into core and noncore segments according to their individual organic purchase histories. Our two classification alternatives are (1) a median split based on organic volume purchases in the category over the entire data duration and (2) a median split based on overall organic purchases at the retailer during the past 12 months (with four purchases as the threshold). We also used a nested logit model that consists of category incidence and product choice to differentiate core and noncore organic consumers (see Appendix C). We randomly selected 700 consumers in each category who made at least two purchases of organics for analysis. From the intercept term of product choice, which can be interpreted as consumers' organic intrinsic preference, we classified them as belonging to core (higher than the mean intercept) or noncore (lower than the mean intercept) segments. Using these classifications and relevant variables, we conducted the VAR analysis separately for each segment. We calculated the long-term assortment and price elasticities on the basis of the segment-level VAR estimates. On comparison, we found that the elasticities obtained through the segment-level analysis using the nested logit and organic volume purchases are similar.
Results
We first relate the key variables in a median split for organic products sales share, the correlation matrix of main variables, and the analysis results of the Koyck model. We then discuss the analysis pertaining to the Granger causality, unit root, and cointegration tests. After reviewing model specifications and estimation, we present the substantive findings of the VAR models, which relate back to the hypotheses.
Figure 1 compares organic premium, organic growth rates, category expensiveness, and frequency of purchase in a median split by organic sales share in the category. Categories with above-median organic sales share have a lower organic premium (47.06% vs. 51.84%) but a higher annual purchase frequency (9.89 vs. 7.28). Table 2 reports both the overall and the specific correlations between top-tier and second-tier national brands, private labels of conventional products, and organic products. As the table shows, conventional top-tier brands have a higher correlation in sales and marketing actions with organic products than second-tier national brands and conventional private labels. This is consistent with our classification of organic products as top tier in the category.
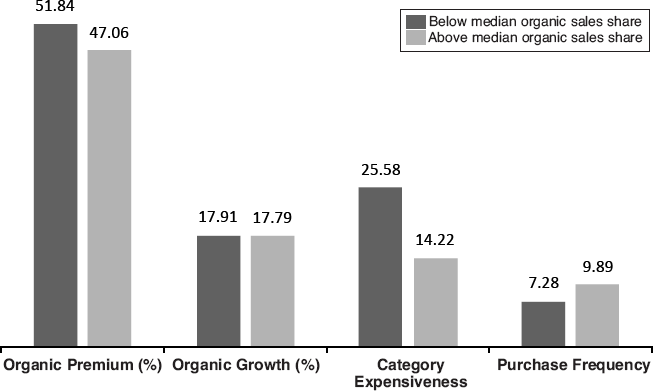
Category Characteristics by Median Split of Organic Sales Share
Correlation Results

Notes: Con = conventional, Org = organic, Vol = sales volume, RP = regular price, PB = promotion breadth, PD = promotion depth, PS = price specials, Ast = assortment, NB = national brand, PL = private label, TT = top-tier, and ST = second-tier.
We begin with the Koyck model results (Table 3). We focus on the coefficients of interest: own- and cross-elasticities of organic versus conventional products for the five analyzed marketing actions. First, organic products have a higher own price elasticity (-3.00) than conventional products (-1.95), and the same holds for own assortment elasticity (2.63 vs. 1.69). In contrast, own promotional elasticies are not significantly different for organic than conventional products. Second, the cross-elasticities indicate that promotional breadth and depth on organic products hurt conventional product sales more than vice versa. Other differences are not significantly different from zero. We next investigate dual causality in our data to gauge the need for a more complicated VAR model.
Organic and Conventional Long-Term Elasticities Using Koyck Model for Overall Sales
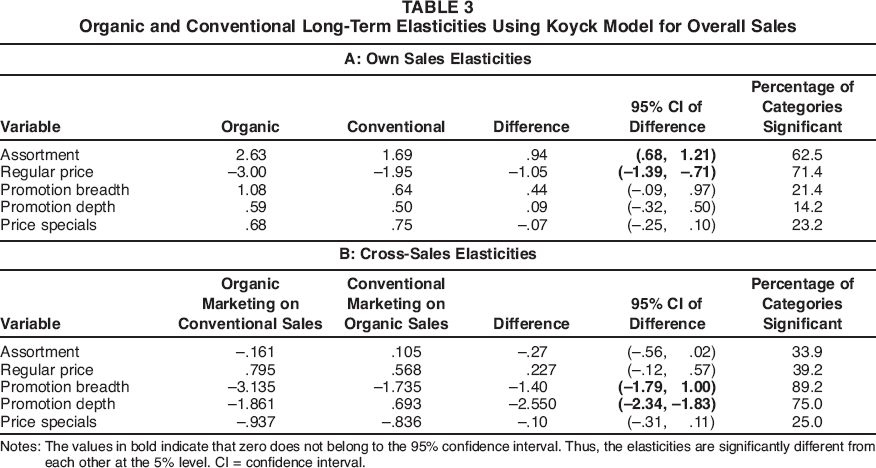
Notes: The values in bold indicate that zero does not belong to the 95% confidence interval. Thus, the elasticities are significantly different from each other at the 5% level. CI = confidence interval.
Granger Causality Tests
We focus on the Granger causality among organic and conventional product sales and retail marketing actions. First, the results (available upon request from the authors) show that virtually all marketing activities Granger-cause sales for the intended products (e.g., organic price on organic sales). Second, organic marketing actions Granger-cause conventional product sales in 44% of categories, while conventional marketing actions Granger-cause organic product sales in 70% of categories. Third, organic marketing activities Granger-cause conventional marketing in 14% of all cases (43% for organic price Granger-causing conventional price), while conventional marketing activities Granger-cause organic marketing in 16% of all cases (52% for conventional price Granger-causing organic price). Thus, the retailer shows some evidence of coordinating marketing across product groups. Finally, we find several cases of performance feedback (i.e., sales are Granger-causing marketing for the same product group). In summary, the Granger causality tests confirm the dual causality loops among organic marketing, conventional marketing, and retailer performance captured by the VAR model.
Model Specification Choices and Model Estimation
Conventional product sales are evolving in only 3.6% of cases, consistent with previous research (Nijs et al. 2001; Srinivasan et al. 2004). In contrast, organic sales are evolving in 8.9% of all cases. Moreover, sales are trend stationary (i.e., only stationary after we account for a deterministic time trend) for 33.9% of organic cases (16.07% of conventional cases). Such a time trend may capture gradual gains in awareness/appeal of organics because of factors outside the retailer's control (e.g., health concerns). In all cases of organic sales evolving or trending, the sales series is growing, while 41.6% of the conventional sales with evolution and time trend are declining. Thus, our data reflect the stronger growth in organic versus conventional product sales observed in the business press but also indicate that such growth is not self-evident: Most organic sales series are mean stationary.
Cointegration is present among organic marketing and performance in 2.67% of cases and among conventional marketing and performance in .89% of cases. This rare occurrence of a long-term equilibrium between marketing and performance is consistent with previous research (e.g., Bronnenberg, Mahajan, and Vanhonacker 2000; Nijs et al. 2001; Srinivasan et al. 2004). We use the VEC specification in the case of cointegration and the VAR specification either in levels or first differences otherwise. The optimal lag length of 1, selected by the Bayesian information criterion, yields a good model fit for all models/categories (average R2 = .80, and adjusted R2 = .78) and is superior to that of the Koyck model in all cases. For example, in the case of organic and conventional volume sales, the adjusted R-squares for the VAR and Koyck models are .84 versus .72 and .81 versus .69.
Substantive Findings from Impulse Response Analysis
We focus on the long-term elasticities (Pauwels, Hanssens, and Siddarth 2002). We observe that only 1.04% (organic) and .59% (conventional) of marketing-sales effects are permanent. 2
To compare them with cases that show only temporary effects, we calculated the net present value of the permanent effect by using a weekly discount rate of .15%, after discussion with the retailer. We then added this net present value to the immediate and adjustment effects to calculate the total, long-term elasticity of the performance variable to the marketing action. We verified that our substantive results remain the same when ignoring these infrequent and small permanent effects.
Long-term own sales elasticities
Table 4 displays the average elasticities across the 56 analyzed categories, either without weighting (“simple average”) or weighting the category results by the respective category's contribution to the overall store revenues.
Organic and Conventional Long-Term Elasticities for Overall Sales
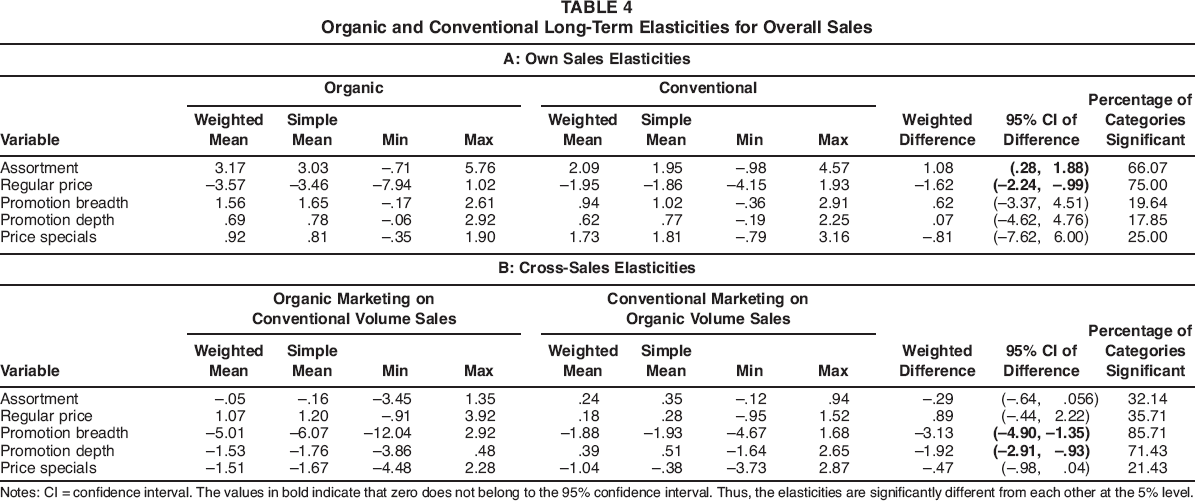
Notes: CI = confidence interval. The values in bold indicate that zero does not belong to the 95% confidence interval. Thus, the elasticities are significantly different from each other at the 5% level
In support of H1, the sales elasticities for assortment and regular price are significantly higher for organic than conventional products. In contrast, organic products do not enjoy higher sales elasticities for promotional activities. Figure 2 shows the impulse response graph for a representative category, tortilla chips. Note that product assortment effects show a similar pattern over time for organic and conventional products, with a long wear-out of approximately 30 weeks. The key difference is the size of the effect: three times as large for organic as for conventional products. In contrast, consumer reactions to regular price changes differ in both magnitude and pattern for organic versus conventional products. A regular price decrease only significantly benefits the average conventional tortilla chip product for 1 week, whereas it benefits the average organic tortilla chip for 28 weeks (four months). This pattern is consistent with our argument that consumers perceive a more enduring commitment to organic products; lowering the regular price induces higher sales for several months.

Sales Response to Assortment and Price Changes for Organic Versus Conventional Products in the Tortilla Chips Category
How does the higher regular price elasticity for organics differ across segments? Table 5 reports our results for the segment-level model based on organic loyalty, which we define using a median split of organic volume purchases. We obtained similar results when using other operationalizations. In support of H2, we find that the elasticities for the enduring activities are higher and significantly different for the noncore than the core segment.
Elasticities for Organic Usage Segments
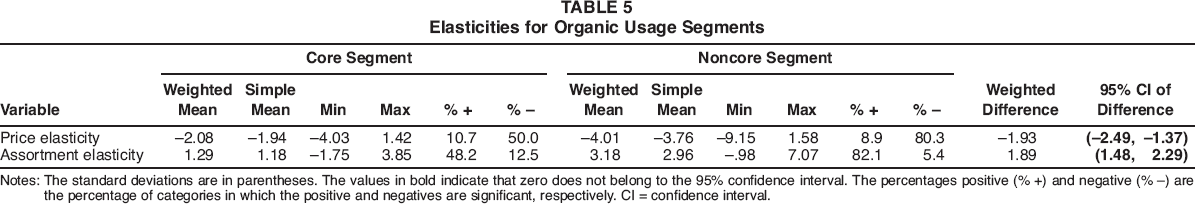
Notes: The standard deviations are in parentheses. The values in bold indicate that zero does not belong to the 95% confidence interval. The percentages positive (% +) and negative (% -) are the percentage of categories in which the positive and negatives are significant, respectively. CI = confidence interval.
As for category-specific costs and benefits, first, our second-stage analysis indicates a higher sensitivity to organic promotions for products with high purchase frequency, of a virtue nature, and that come directly from the farm (produce, dairy, meat, and poultry). Second, product storability and impulsivity increase consumer sensitivity to product assortment. While deep promotions induce higher consumer response in storable and impulse-buy categories, regular price reductions are less effective. Third, expensive categories show lower consumer sensitivity to regular price and price specials for organic products. This indicates that the higher price of organics is not such an obstacle for buying organics in categories in which prices are generally high. Likewise, regular price sensitivity is lower in categories with a high organic price premium, indicating a greater willingness to pay for organics. Plausibly because of this high willingness to pay, consumers are more responsive to assortment additions in categories with high price premiums. Fourth, high organic penetration is associated with higher sensitivity to assortment and price, consistent with our finding of high sensitivity to these enduring actions by noncore consumers (who tend to constitute a larger part of organic buyers in categories with high organic penetration). Finally, retailers obtain higher organic sales benefits with promotions and price specials when organics are already growing strongly in the category.
Long-term cross-sales elasticities
We report the cross sales elasticities in the bottom panel of Table 4. In support of H3, we observe an asymmetry: Organic marketing activities hurt conventional product sales more than vice versa. These differences are significant at the 5% level for promotion breadth and promotion depth. In Table 6, we report elasticities across the different combinations of conventional products and organics. As expected, we find that promoting organic products hurts top-tier national brands the most, followed by second-tier national brands and private labels of conventional products.
Cross-Elasticities Between Different Conventional Types and Organics

Notes: The standard deviations are in parentheses. The percentages positive (% +) and negative (% -) are the percentage of categories in which the positive and negatives are significant, respectively.
Overall retailer performance
In light of the large own-and small cross-elasticities of enlarging the organic assortment, this activity seems desirable if the retailer wants to increase sales of organics without hurting conventional product sales. Even in the case of cannibalization, the higher unit margin on organics may still increase overall category and store performance. Table 7 reports the results of our overall performance model.
Organic and Conventional Long-Term Elasticities of Overall Retailer Performance
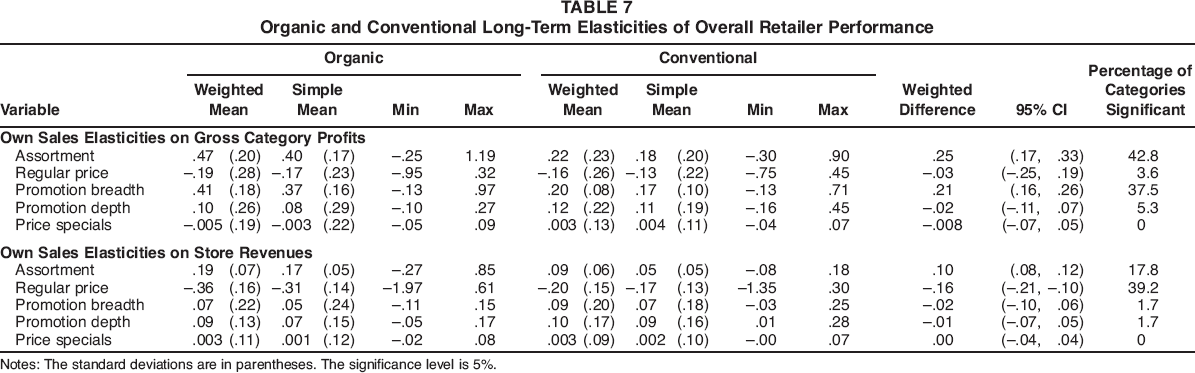
Notes: The standard deviations are in parentheses. The significance level is 5%.
Considering the long-term performance elasticities, we find that organic assortment and organic and conventional promotion breadth have a significant, positive effect on gross category profits. The long-term elasticities in this case are .47, .41, and .20, respectively. Compared with the same actions for conventional products, we find a significant category margin advantage for higher assortment and more frequent promotions on organic products (last column of Table 7). Do these activities also improve overall store revenues? We find few significant effects, consistent with previous promotion studies for conventional products (e.g., Srinivasan et al. 2004). The two exceptions are enlarging the organic assortment and decreasing organic regular prices in the category, which yield a long-term elasticity on store revenues of .19 and -.36, respectively. Again, these actions have higher store revenue elasticity for organic products than for conventional products. Regarding category-specific factors driving overall retailer performance variables, we find that the gross category margin elasticity is significantly higher in produce categories for changes in organic assortment, regular price, and price specials.
Long-term elasticities and organic product labeling
Given previous research on the importance of organic product labeling, we compare our results on products with the organic USDA seal with those labeled “organic” without the USDA seal and with those labeled “natural” (i.e., products that do not contain any artificial flavoring, color ingredients, chemical preservatives, or artificial or synthetic ingredients). We find that our substantive results hold when we combine organic products with and without the USDA seal as organic products in the analysis, with a similarly high power explaining sales (this model: R 2 = .815; the main model for food categories: R 2 = .790). However, using only the organic products without the USDA seal yields a lower explanatory power (R 2 = .695) and effect estimates that, while direction-ally similar in many cases, are substantially lower than those for the organic product with the USDA seal (our main model). Finally, using “natural” products yields an even lower model fit (R 2 = .515) and shows hardly any significant differences in own and cross-elasticities between natural and conventional products (without any organic or natural claim). From these results, we conclude that organic labeling is quite important across categories, consistent with consumer decision-making literature on organic labeling.
Additional analyses
We performed several additional analyses to gain further insight into our main results. We checked for quadratic price effects (as in Ngobo 2011) and found that they failed to improve model fit. We included a social influence variable from sampled consumers' self-reports of such influence on their organic buying decisions. We found that the social influence variable is significant and improves the model fit, implying that it is a driver of organics. However, our substantive results held after we controlled for social approval.
Our final robustness checks consider aggregation bias, store trade area characteristics, and changes over time. First, to determine whether our results are sensitive to aggregation bias, we estimated the models on a store-by-store basis and computed the weighted mean using stores' sales as weights; we found that the results are substantially similar. Second, to check the sensitivity of the results to store trade area characteristics, we conducted the same analyses for another chain operating in a geographically distinct area catering to a different clientele. 3 We found similar results. Third, to check for changes over time, we estimated our main models on semiannual periods and fit a local trend model through the time variation in the estimates. No discernible over-time pattern appears, while regular price elasticity varies between −3.17 and −4.01 for organic products and −1.75 and −2.2 for conventional products. Thus, we find no evidence that our findings are sensitive to these potential issues.
This chain operates 90 stores in the mid-Atlantic United States and does not compete with our focal chain. The clientele for this chain differs in terms of income, education, and ethnic composition and average store size.
Discussion and Implications
Buying organics represents a rather enduring commitment, which involves both transaction costs (finding organic products with the right flavor, size, and so on) and out-of-pocket costs (the price of organics). Therefore, lowering transaction and monetary costs by increasing the organic assortment and decreasing organics' regular prices represents the enduring marketing actions most likely to induce consumers to buy organics. Our findings offer new insights into the ongoing debate on the place of organic products on the (mainstream) retail shelf. We distinguish implications for shopper response, manufacturer strategy, retailer marketing strategy, and policy makers and organics advocates.
First, we find that shoppers react differently to enduring marketing actions for organic versus conventional products. We observe these differences for both organic products with and without the USDA seal but not for “natural” products. Thus, labeling and branding do seem to play an important role, as both the USDA seal and organic branding yield sales benefits. Our distinction among consumer organic usage levels reveals that increasing assortments and reducing the regular price for organics is especially effective for noncore organic consumers but also stimulates purchase by core organic consumers. Such core organic consumers should therefore not be taken for granted: Although they have much experience buying and consuming organics, the greater perceived benefits do not mean that they will buy organics at any cost. A strategy of first getting consumers “hooked” on organics with low prices and then increasing prices seems ill-advised in light of our findings.
Second, manufacturers of top-tier national brands have the most to lose from organic product growth and thus should be the first in line to either develop their own organic products with brand names that are distinct from their own or acquire organic brands of smaller companies. The latter is advised for minimally processed products (e.g., produce, milk, yogurt, cereal), for which we found a higher sales impact for small/independent than large manufacturer brands in an additional analysis.
Third, mainstream retailers should consider increasing assortment and lowering regular prices, especially for the noncore organic segment, but also for the core organic segment. The highest return for such actions materializes for products with high purchase frequency, of a virtue nature, and that come directly from the farm (produce, dairy, meat, and poultry). In contrast, regular price reductions are less effective than deep promotions in storable and impulse-buy categories. Thus, retailers can keep the regular price a bit higher in such categories, while offering deep promotions to induce impulse buying and stockpiling.
Our study also has implications for policy makers, sustainability proponents, and advocates of organic products. In contrast with Ngobo (2011), we find that typical actions of mainstream retailers, such as broadening assortments and lowering prices, substantially increase sales of organics. However, these are enduring actions for the retailer, which thus are unlikely to be swayed by temporary subsidies. The full supply system should be considered: It is easier for retailers to increase organic assortment and reduce regular prices if manufacturers of organic products do the same. Transparent certification is important in this regard: The USDA seal increases consumer response to marketing actions for organic products.
Conclusion
What makes marketing organics special in mainstream U.S. retail settings? Not as much as Ngobo (2011) implies: Reducing price and increasing price promotions and assortment strongly increase organic product sales in our large-scale analysis over 56 categories. Moreover, reducing prices on organic products hurts conventional product sales more than vice versa, consistent with the asymmetric price competition literature (Sethuraman and Srinivasan 2002). However, marketing organic products is special to the extent that retailers need enduring actions (assortment and regular price) to overcome the perceived costs of going organic, especially for shoppers with currently low intrinsic value for organic products. Increasing organic assortment is also superior to increasing conventional assortment in terms of category margin and store revenues.
In light of recent contradictory findings, we note the large (negative) price elasticity of organic products in each of our 56 analyzed product categories. What might explain the difference between some of the results of our study and those of previous research? First, we base our analysis on data that also include transactions by customers who (almost) never buy organic products, whereas other studies focus solely on the core organic consumer. Indeed, we find that the core organic consumer is not as price sensitive as the noncore organic consumer. Second, we use more recent data in which the organic penetration is approximately 5%. Thus, we believe we are capturing a more current state of organic demand and supply characteristics. Industry reports confirm that organic sales have remained strong during the recession, mostly because manufacturers and retailers decreased organic prices (Supermarket News 2011).
Limitations of the current study include the absence of data on competing retailers' marketing, actions by suppliers of organic products, category advertising, and consumer perceptions of the store and its organic offering. As in any econometric study, our focus was on the sign and size (i.e., the “what” and “how much”) of consumer purchase actions, not on the “why.” Further research should unravel the motivations behind these observed actions and generalize our findings to other retail settings. For example, we find little evidence that marketing organics can increase store revenues at the studied retailer. A more focused repositioning, even fully converting to organic products (e.g., Whole Foods), may be needed to achieve this.
This study represents an important step forward in resolving the “balancing act between the old and the new” for conventional retailers (Progressive Grocer 2008). Our analysis implies that organic products are compatible with conventional retailers and marketing actions. With the inspiration from high-profile role models (e.g., Michelle Obama starting a White House organic garden) and the practical support of mainstream retailers, the future of organics looks healthy indeed.
Footnotes
Description of the VAR/VEC Models Estimated

| Model Number | Model Description | Endogenous Variables | Exogenous Variables | Comments |
|---|---|---|---|---|
|
|
||||
| 1 | Overall sales interactions between Org and Con |
PV: Org Vol, Con Vol MV: Org RP, Org PB, Org PD, Org A, Org PS, Con RP, Con PB, Con PD, Con A, Con PS |
Seasonal and holiday dummies, time trend | Store-level data on 56 categories. |
| 2 | Sales interactions between Org and Con for core and noncore organic segments |
PV: Core segment Org Vol, Con Vol MV: Org RP, Org PB, Org PD, Org A, Org PS, Con RP, Con PB, Con PD, Con A, Con PS |
Seasonal and holiday dummies, time trend | Panel data on 56 categories. |
| 3 | Overall sales interactions between top-tier NBs, second-tier NBs, Con PLs, and Org for price and assortments |
PV: TT Vol, ST Vol, CPL Vol, Org Vol MV: (either) TT RP, TT A, ST RP, ST A, CPL RP, CPL A, Org RP, Org A (or) TT PB, TT PD, ST PB, ST PD, CPL PB, CPL PD, Org PB, Org PD |
(either) TT PB, TT PD, TT PS, ST PB, ST PD, ST PS, CPL PB, CPL PD, CPL PS, Org PB, Org PD, Org PS (Or) TT RP, TT A, TT PS, ST RP, ST A, ST PS, CPL RP, CPL A, CPL PS, Org RP, Org A, Org PS seasonal and holiday dummies, time trend | Store-level data on 38 categories. No branding information for produce. The two models are estimated separately. |
| 4 | Overall retailer performance effects vis-à-vis Org and Con |
PV: Store revenues, store margins (profits) MV: Org RP, Org PB, Org PD, Org A, Org PS, Con RP, Con PB, Con PD, Con A, Con PS |
Seasonal and holiday dummies, time trend | Store-level data on 56 categories |
| 5 | Overall sales (performance) between Org and Con analyzed with quadratic price gap |
PV: Org Vol, Con Vol (store revenues, store margins) MV: Org RP, Org PB, Org PD, Org A, Org PS, Con RP, Con PB, Con PD, Con A, Con PS, OrgRP – ConRP)2 |
Seasonal and holiday dummies, time trend | 56 categories used. |
| 6 | Overall sales interactions between Org and Con analyzed with social influence for survey consumers |
PV: Org Vol, Con Vol MV: Org RP, Org PB, Org PD, Org A, Org PS, Con RP, Con PB, Con PD, Con A, Con PS |
Seasonal and holiday dummies, time trend, social influence | 56 categories used. |
| 7 | Overall sales interactions between Org and Con with all types of organic products including 100% Organic and organic (at least 95%) |
PV: Org Vol, Con Vol MV: Org RP, Org PB, Org PD, Org A, Org PS, Con RP, Con PB, Con PD, Con A, Con PS |
Seasonal and holiday dummies, time trend | 49 food categories used. The USDA seal is prominent only for foods. |
| 8 | Overall sales interactions between Org and Con for Org with less than 70% organic ingredients and “Made with organic ingredients”—no USDA seal |
PV: Org Vol, Con Vol MV: Org RP, Org PB, Org PD, Org A, Org PS, Con RP, Con PB, Con PD, Con A, Con PS |
Seasonal and holiday dummies, time trend | 49 categories used. |
| 9 | Overall sales interactions between only natural products and Con |
PV: Nat Vol, Con Vol MV: Nat RP, Nat PB, Nat PD, Nat A, Nat PS, Nat RP, Nat PB, Nat PD, Nat A, Nat PS |
Seasonal and holiday dummies, time trend | 49 categories used. |
| 10 | Overall sales (performance) interactions between Org and Con analyzed store-by store | PV: Org Vol, Con Vol (store revenues, store margins) | Seasonal and holiday dummies, time trend | 56 categories used. |
Notes: PV = performance variables, MV = marketing variables, RP = regular price, PB = promotion breadth, PD = promotion depth, A = assortment, Vol = volume, PS = price specials, NB = national brand, PL = private label, TT = top-tier national brands, ST = second-tier national brands, Org = organic products, Con = conventional products (C is used in some cases as well), CPL = conventional private label, and Nat = natural products.
Data Summary Statistics

| Category | Assort Size (Number) |
Gross Price (Cents/Unit) |
Promotion Breadth (%) |
Promotion Depth (%) |
Price Special Frequency (%) |
Retail Margins (%) |
Organic Growth Rate (%) | Organic Penetration (%) | Organic Premium (%) | ||||||
|---|---|---|---|---|---|---|---|---|---|---|---|---|---|---|---|
| O | C | O | C | O | C | O | C | O | C | O | C | ||||
| Apple juice | 10 | 52 | 16.17 | 9.03 | 34 | 66 | 9 | 23 | 13 | 23 | 61.9 | 56.05 | 16.7 | 6.35 | 79.07 |
| Apples | 10 | 46 | 13.18 | 11.20 | 14 | 23 | 5 | 10 | 3 | 29 | 40.56 | 21.72 | 23.4 | 2.34 | 17.68 |
| Beef | 14 | 50 | 72.37 | 43.71 | 11 | 27 | 7 | 35 | 6 | 33 | 35.54 | 32.9 | 58.1 | 2.01 | 65.57 |
| Blueberries | 3 | 6 | 102.11 | 73.16 | 48 | 69 | 5 | 20 | 5 | 12 | 60.14 | 50.97 | 23.3 | 3.05 | 39.57 |
| Mac and cheese | 9 | 23 | 23.61 | 18.79 | 52 | 75 | 8 | 17 | 2 | 17 | 44.96 | 38.27 | 22 | 13.79 | 25.65 |
| Butter | 11 | 26 | 33.02 | 23.14 | 27 | 59 | 7 | 25 | 2 | 17 | 47.95 | 41.58 | 6 | 1.33 | 42.70 |
| Canned chick peas | 5 | 17 | 11.08 | 7.14 | 28 | 42 | 6 | 11 | 4 | 9 | 43.56 | 30.82 | 16.7 | 4.62 | 55.18 |
| Canned green beans | 5 | 13 | 11.14 | 8.14 | 15 | 33 | 7 | 22 | 1 | 3 | 55.12 | 52.56 | 25.2 | 1.65 | 36.86 |
| Canned kidney beans | 4 | 8 | 9.60 | 7.96 | 36 | 38 | 6 | 13 | 1 | 7 | 38.02 | 35.32 | 20.3 | 7.51 | 20.60 |
| Canned tomato paste | 5 | 27 | 10.20 | 7.87 | 25 | 55 | 3 | 17 | 1 | 7 | 39.4 | 31.12 | 14.5 | 1.59 | 29.61 |
| Carrots | 8 | 18 | 13.35 | 11.46 | 24 | 28 | 16 | 25 | 9 | 11 | 55.54 | 41.64 | 45 | 18.13 | 16.49 |
| Cereal | 99 | 346 | 31.29 | 24.25 | 31 | 39 | 5 | 18 | 18 | 55 | 53.7 | 40.8 | 14 | 3.44 | 29.03 |
| Cheese | 23 | 100 | 53.31 | 29.15 | 12 | 16 | 3 | 17 | 1 | 29 | 46.07 | 32.25 | 23 | 0.35 | 82.88 |
| Chicken | 8 | 41 | 30.16 | 16.13 | 31 | 27 | 17 | 37 | 2 | 36 | 55.16 | 34.7 | 32 | 1.57 | 86.98 |
| Conditioners | 9 | 61 | 39.42 | 26.92 | 11 | 44 | 3 | 13 | 1 | 11 | 55.8 | 33.01 | 12.5 | 1.02 | 46.43 |
| Cookies | 25 | 170 | 27.68 | 22.07 | 25 | 43 | 7 | 22 | 5 | 27 | 49.1 | 39.3 | 14.3 | 2.92 | 25.41 |
| Crackers | 27 | 149 | 42.69 | 25.31 | 29 | 39 | 5 | 20 | 3 | 42 | 56.5 | 45.44 | 13.7 | 2.63 | 68.67 |
| Creams (dairy based) | 7 | 19 | 40.60 | 27.85 | 22 | 30 | 10 | 37 | 2 | 9 | 96.78 | 85.42 | 7.5 | 1.95 | 45.78 |
| Diced tomatoes | 9 | 44 | 11.25 | 7.06 | 27 | 47 | 4 | 15 | 12 | 38 | 39.79 | 35.11 | 9.2 | 1.55 | 59.35 |
| Dish detergent | 7 | 29 | 12.71 | 10.41 | 9 | 37 | 5 | 15 | 1 | 12 | 45.51 | 30.03 | 5.7 | 2.85 | 22.09 |
| Eggs | 8 | 27 | 17.22 | 6.10 | 54 | 33 | 4 | 11 | 27 | 20 | 60.6 | 50.17 | 7.9 | 2.38 | 182.30 |
| Fabric softener | 8 | 28 | 14.70 | 11.97 | 6 | 21 | 3 | 16 | 1 | 10 | 39.33 | 30.83 | 6.1 | 1.97 | 22.81 |
| Grapefruits | 3 | 11 | 8.73 | 7.48 | 3 | 13 | 3 | 8 | 1 | 6 | 49.34 | 45.89 | 55 | 1.48 | 16.71 |
| Grapes | 5 | 20 | 20.76 | 18.67 | 30 | 65 | 10 | 30 | 7 | 25 | 53.47 | 51.78 | 18 | 1.44 | 11.19 |
| Greens: salad/others | 10 | 20 | 17.12 | 15.90 | 31 | 56 | 9 | 19 | 3 | 5 | 56.97 | 39.4 | 10.4 | 27.71 | 7.67 |
| Jams/jellies | 37 | 89 | 23.15 | 10.82 | 17 | 19 | 8 | 10 | 11 | 34 | 66.01 | 52.05 | 15 | 1.9 | 113.96 |
| Ketchup | 15 | 69 | 15.26 | 6.99 | 26 | 38 | 10 | 14 | 4 | 23 | 79 | 62.26 | 10 | 2.01 | 118.31 |
| Laundry detergent | 19 | 75 | 10.65 | 7.92 | 22 | 47 | 9 | 20 | 2 | 17 | 43.8 | 29.2 | 8.4 | 3.07 | 34.47 |
| Lemons | 2 | 5 | 60.02 | 49.97 | 12 | 33 | 17 | 17 | 2 | 15 | 56.12 | 45.27 | 21 | 4.54 | 20.11 |
| Milk | 18 | 54 | 6.02 | 2.57 | 34 | 32 | 9 | 28 | 26 | 69 | 146.6 | 109.6 | 12 | 2.93 | 134.24 |
| Mouthwash | 10 | 61 | 27.14 | 16.12 | 14 | 36 | 3 | 10 | 1 | 13 | 38.57 | 36.26 | 4.8 | 1.25 | 68.36 |
| Mushrooms | 3 | 16 | 24.45 | 19.10 | 4 | 16 | 3 | 10 | 2 | 13 | 77.52 | 50.2 | 36 | 1.49 | 28.01 |
| Oats | 29 | 76 | 22.55 | 17.47 | 17 | 32 | 6 | 16 | 7 | 41 | 76.05 | 56.83 | 18 | 1.92 | 29.08 |
| Onions | 3 | 9 | 7.31 | 6.35 | 7 | 18 | 4 | 15 | 4 | 14 | 97.21 | 85.57 | 21 | 1.75 | 15.12 |
| Oranges | 7 | 11 | 9.40 | 7.81 | 8 | 24 | 13 | 16 | 6 | 12 | 106.5 | 98.33 | 28 | 5.01 | 20.36 |
| Orange juice | 7 | 59 | 6.27 | 5.19 | 26 | 31 | 19 | 25 | 6 | 43 | 102.2 | 82.56 | 18 | 7.64 | 20.81 |
| Pasta | 36 | 142 | 12.47 | 8.56 | 18 | 26 | 12 | 20 | 2 | 19 | 71.9 | 65.9 | 6 | 1.26 | 45.68 |
| Pasta sauce | 25 | 118 | 19.68 | 11.85 | 25 | 28 | 15 | 17 | 10 | 28 | 81.85 | 69.7 | 28 | 2.1 | 66.08 |
| Peaches | 2 | 11 | 12.87 | 10.21 | 17 | 59 | 3 | 26 | 2 | 14 | 60.96 | 50.13 | 19 | 2.42 | 26.05 |
| Peanut butter | 9 | 71 | 31.93 | 13.86 | 42 | 38 | 7 | 10 | 11 | 34 | 79.6 | 72.5 | 13 | 4.17 | 130.38 |
| Pizza: frozen | 17 | 79 | 44.42 | 25.14 | 14 | 19 | 7 | 17 | 3 | 33 | 143 | 87.46 | 4 | 1.75 | 76.69 |
| Potato chips | 27 | 113 | 48.43 | 27.20 | 21 | 25 | 9 | 25 | 18 | 67 | 91.97 | 64.37 | 9 | 3.01 | 78.05 |
| Potatoes | 7 | 50 | 6.67 | 5.12 | 13 | 34 | 4 | 20 | 9 | 17 | 51.46 | 48.08 | 16 | 2.03 | 30.27 |
| Ready-to-eat packaged salads | 11 | 23 | 28.70 | 23.96 | 21 | 31 | 8 | 18 | 10 | 34 | 192.6 | 142.9 | 19 | 22.4 | 19.78 |
| Ready-to-drink teas | 37 | 107 | 15.92 | 13.37 | 19 | 29 | 15 | 27 | 11 | 24 | 45.34 | 39.78 | 12 | 3.57 | 19.07 |
| Salad dressing | 29 | 134 | 27.45 | 16.93 | 25 | 27 | 17 | 21 | 14 | 33 | 56.77 | 53.2 | 18 | 1.59 | 62.14 |
| Sauces: canned | 37 | 116 | 31.65 | 22.69 | 20 | 33 | 12 | 17 | 10 | 26 | 82.79 | 62.27 | 22 | 1.39 | 39.49 |
| Shampoo | 27 | 203 | 38.40 | 20.18 | 12 | 35 | 3 | 15 | 2 | 31 | 51.4 | 36.3 | 7.2 | 1.69 | 90.29 |
| Soup: canned | 49 | 254 | 16.93 | 12.04 | 21 | 27 | 7 | 29 | 9 | 52 | 44.06 | 41.31 | 8 | .75 | 40.61 |
| Soymilk | 25 | 34 | 7.51 | 5.26 | 40 | 38 | 3 | 7 | 12 | 35 | 53.77 | 48.53 | 20 | 8.9 | 42.78 |
| Strawberries | 3 | 13 | 26.12 | 24.70 | 47 | 53 | 12 | 31 | 16 | 34 | 47.97 | 45.48 | 53 | 3.06 | 5.75 |
| Toothpaste | 26 | 136 | 95.98 | 52.95 | 11 | 38 | 8 | 18 | 2 | 41 | 45.81 | 31.35 | 8 | 1.37 | 81.27 |
| Tomatoes | 5 | 11 | 19.76 | 18.69 | 19 | 22 | 11 | 20 | 19 | 29 | 87.9 | 78.43 | 19 | 3.89 | 5.72 |
| Tortilla chips | 25 | 58 | 27.92 | 16.89 | 26 | 28 | 10 | 18 | 13 | 35 | 81.5 | 72.22 | 9 | 3.45 | 65.30 |
| Turkey | 3 | 15 | 259.05 | 139.2 | 3 | 17 | 2 | 12 | 1 | 23 | 26.27 | 18.82 | 7 | 1.62 | 86.10 |
| Yogurt | 28 | 71 | 13.64 | 10.17 | 37 | 22 | 7 | 20 | 17 | 26 | 51.23 | 26.66 | 10 | 2.67 | 34.12 |
Notes: O = organic, and C = conventional.