
Abstract
Social media sites have created a reverberating “echoverse” for brand communication, forming complex feedback loops (“echoes”) between the “universe” of corporate communications, news media, and user-generated social media. To understand these feedback loops, the authors process longitudinal, unstructured data using computational linguistics techniques and analyze them using econometric methods. By assembling one of the most comprehensive data sets in the brand communications literature with corporate communications, news stories, social media, and business outcomes, the authors document the echoverse (i.e., feedback loops between all of these sources). Furthermore, the echoverse has changed as online word of mouth has become prevalent. Over time, online word of mouth has fallen into a negativity spiral, with negative messages leading to greater volume, and firms are adjusting their communications strategies in response. The nature of brand communications has been transformed by online technology as corporate communications move increasingly from one to many (e.g., advertising) to one to one (e.g., Twitter) while consumer word of mouth moves from one to one (e.g., conversations) to one to many (e.g., social media). The results indicate that companies benefit from using social media (e.g., Twitter) for personalized customer responses, although there is still a role for traditional brand communications (e.g., press releases, advertising). The evolving echoverse requires managers to rethink brand communication strategies, with online communications becoming increasingly central.
We view this new environment as a reverberating “echoverse” in which consumer-generated brand buzz plays a key role. The term “echoverse” is a conjunction of “echo” and “universe.” The term “verse” signals that managers must be aware that brand attention can flare up across a “universe” of “actors”: news media, consumers, and firms. The “echo” portion reflects complex feedback loops between each pair of actors. Thus, we define the echoverse as the entire communications environment in which a brand/firm operates, with actors contributing and being influenced by each other's actions. Firms as actors can contribute to the echoverse in several ways, such as advertising and press releases. Consumers contribute through online WOM, attitudes, and behaviors. We refer to this next “level” as “sources” to distinguish them from “actors,” because they are the sources from which we observe actors’ communications. We use “components” to refer to communications generated by the sources. For example, in the case of the actor of the firm, there is one source, the firm itself, and several components aligned with it: Twitter volume and valence, press release volume and valence, and advertising spending.
Although firms experience the echoverse in practice, and both theoretical and empirical evidence supports the existence of different parts of it, it has yet to be conceptualized and empirically demonstrated as a holistic system of reverberating relationships. Given the dramatic changes to the modern communications environment with the growth of the Internet (Keller 2009), along with evidence that firms differ significantly in their abilities to adjust their communications practices to effectively incorporate social media (Swayne 2015), exploring variation in firms’ experiences helps reveal performance implications of different strategies for managing their contributions to, and monitoring the discourse in, the echoverse. Thus, we aim to theoretically conceptualize and empirically demonstrate the nature of this system and. in doing so, address five main questions:
RQ1: What is the strength of the echoverse? That is, to what extent do communications from each source affect the other sources? RQ2: What is the nature of the echoverse? That is, what is the direction of the impact between echoverse components (i.e., positive or negative)? RQ3: Are there asymmetries in the echoverse? That is, is the direction of influence between some sources (e.g., consumer WOM, traditional media news stories) more one-way than two-way? RQ4: How has the echoverse changed over time? That is, as social media use has grown, have relationships between the echoverse sources changed over time, with some becoming more significant and some less? RQ5: How do the response dynamics to the various communications components in the echoverse differ across companies? That is, do some firms experience stronger responses to their use of certain communications components than others?
Answers to these questions will help inform managers’ communications strategies in today's communications environment, including which of their contributions are likely to have the greatest impact on responses by other actors, and to which sources and components they should pay particular attention in anticipating impacts on key firm outcomes. By answering these questions, we aim to fill gaps left by existing theories that have been used to explain relationships among particular sets of components rather than offering an overarching conceptual framework.
We built an extensive longitudinal database of brand communications data in the U.S. financial services industry. This industry has experienced dramatic brand-related events in the last decade and continues to see declining images among leading firms (Adams 2014). Focusing on the four leading U.S. banks, we use text mining and computational linguistics to measure the volume and valence of traditional media news stories, online WOM, and firm communications. We use time series modeling to relate these communications to both consumer sentiment and business outcomes. We use quantified measures to address each research question.
We document feedback loops in which the different components, including firm communications, news media, consumer WOM, and consumer sentiment, echo each other and feed back on themselves. We show for our sample of firms that the echoverse has changed over time and reveal the particular impact of online WOM. We reveal that although one-to-many firm communication (i.e., advertising and press releases) still has a role in the modern online context, one-to-one communication (i.e., direct customer responses via social media) can be very effective. By contrast, customer communication has trended in the opposite way, with social media enabling one-to-many communication. We find large variation in the value of firms’ communications. Exploring effective versus ineffective firms, we find that high-volume, consistent, moderately toned Twitter strategies can help manage online WOM, consumer sentiment, and firm outcomes. 1
For firm communication, we use “moderate” for lower-valence messages and “positive” for higher-valence messages because firms are rarely truly negative in their own communications. For media and online WOM, we use “negative” and “positive.”
Marketers have traditionally focused on influencing consumer sentiment and firm performance through advertising and other communications. However, social media offers marketers, consumers, and other parties in the brand communication environment (e.g., the news media) a greater voice to influence the discourse. On the one hand, having an alternative that enables a one-on-one dialog can facilitate greater influence. On the other hand, social media may increase complexity for managing brand strategies. Marketers increasingly must use resources to monitor contributions by and exchanges among various sources and decide whether and how to modify their actions to influence other echoverse components, including business outcomes.
Existing Studies on Components of the Echoverse
Many studies have investigated how traditional brand communications such as advertising and promotions influence consumer sentiment (Ahluwalia, Burnkrant, and Unnava 2000; Ahluwalia, Unnava, and Burnkrant 2001) or behavior (Reimer, Rutz, and Pauwels 2014; Trusov, Bucklin, and Pauwels 2009). Others have studied advertising's influence on stock performance and/or risk (Joshi and Hanssens 2009, 2010), sales (Cleeren, Van Heerde, and Dekimpe 2013; Van Heerde, Helsen, and Dekimpe 2007), or brand performance (Dinner, Van Heerde, and Neslin 2014; Van Heerde, Helsen, and Dekimpe 2007).
A meta-analysis by Sethuraman, Tellis, and Briesch (2011) offers inconclusive support for advertising's impact on firm performance, with more than 40% of the long-term advertising elasticities in 402 studies falling between 0 and .1. Using field experiments, Lewis and Rao (2015) also find fairly weak advertising effectiveness. Neither their study nor a meta-analysis by Assmus, Farley, and Lehmann (1984) included other echoverse components. A broader analysis may yield insight into how advertising relates to other communications in the modern social media context.
The finding that advertising (a sponsored form of communication) does not have strong effects does not imply that all communication effects are weak. In a recent meta-analysis, online WOM was shown to have an elasticity of .24 (You, Vadakkepatt, and Joshi 2015), which is more than twice the average advertising elasticity of .11 (Sethuraman, Tellis, and Briesch 2011). This implies that in today's communication environment, firms must take into account not only their own advertising effects but also other communication tools at their disposal (e.g., press releases, social media) as well as online WOM, traditional media, and consumer sentiment.
Studies linking advertising with other echoverse components have yielded mixed results. Whereas Feng and Papatla (2011) find a link between advertising and online WOM volume, both Carter (2006) and Cleeren, Van Heerde, and Dekimpe (2013) report a nonsignificant relationship between advertising and news media. Trusov, Bucklin, and Pauwels (2009) include media volume and promotional event activity in a model predicting new sign-ups for a social networking site. However, they do not test the link between them and do not examine the effect of social media, but rather the effect of WOM e-mail referrals on the sign-up process for a social network. In addition, Tirunillai and Tellis (2012) include advertising spending and media citations as controls.
There is a growing body of literature on the role of consumer WOM and firm online communications. Tirunillai and Tellis (2012) explore the impact of advertising on online WOM. Although the meta-analysis of You, Vadakkepatt, and Joshi (2015) includes both of these components, it does not explore the link between them. Finally, Homburg, Ehm, and Artz (2015) and Kumar et al. (2013) examine firm social media use's impact on consumer sentiment or behavior (spreading WOM). Numerous studies have focused on the relationship between online WOM and consumer sentiment (Moe and Schweidel 2012; Stephen and Toubia 2010) or behavior (Sweeney, Soutar, and Mazzarol 2014). Research has also explored performance impacts of online WOM (Chevalier and Mayzlin 2006; Godes and Mayzlin 2009) and how owned and earned media, including social media, affect sales (Stephen and Galak 2012). Other researchers have studied influences on WOM volume and/or valence, such as what makes online WOM go viral (Berger and Milkman 2012).
Our study builds on two previous studies that notably advanced knowledge in this domain. First, Stephen and Galak (2012) include traditional news media, social media, and firm-generated media in exploring how traditional and social earned media affect sales. We build on this study by including (1) the influence of nonsocial paid advertising, arguably the most important traditional brand communication, (2) both valence and volume of online brand communications, and (3) consumer sentiment. Next, Trusov, Bucklin, and Pauwels (2009) link member acquisition for a social networking site to firm marketing through WOM referrals and firm-sponsored promotional events. We build on this study by including (1) both valence and volume of WOM, (2) firm social media communications, (3) firm press releases, and (4) consumer sentiment.
Contribution
Although major headway has been made in understanding some relationships among components in the brand communication environment, this study is unique in three notable ways. First, it is the first to assess how a rather comprehensive set of components can influence each other. Second, we include both volume and valence for traditional media, social media WOM, and firm-sponsored WOM. Capturing both volume and valence is important because both have been shown empirically to influence other echoverse components (see Table 1). In addition, firms can control the volume and valence of their communications and monitor and control their responses to both aspects of others’ contributions. We recognize that content of communications is important, but it is better explored using studies of finer granularity, whereas we aim to take a more systemic view. Third, we demonstrate feedback loops for each path. Understanding feedback loops is vital because each action by echoverse actors is intended to evoke a response by at least one other component. Firms issue press releases to gain news coverage, the media attempts to create social media buzz with news articles, and so on.
Empirical Studies Including Echoverse Components

Godes and Mayzlin (2009) created a campaign through which customers/agents created WOM but were provided with information by the firm.
Trusov, Bucklin, and Pauwels (2009) capture the volume of promotional events as opposed to investment in advertising via dollars spent.
Notes: An “X” indicates that the study empirically assesses the impact of a particular component or the impact of other components on that component.
Table 1 summarizes relevant research, highlighting our contribution. We identify the components each study addresses—traditional media news stories (volume and valence), advertising, firm social media volume and valence, press release volume and valence, online WOM by others (volume and valence), consumer sentiment, and firm performance.
Conceptual Framework
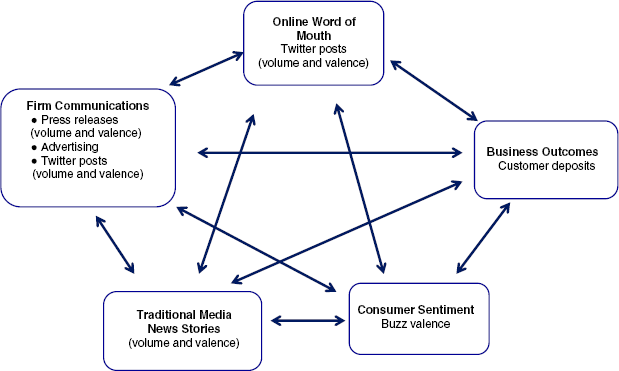
We theorize the concept of the echoverse (see Figure 1). This concept extends the notion of the “megaphone effect” described by McQuarrie, Miller, and Phillips (2013) as individuals acquiring mass audiences by posting content online. Echoverse actors can grab the “megaphone” and attract attention, influencing individual echoverse components. This results in a reverberating system, unlike the case in which communications have impact in isolation. Research has offered evidence that this system consists of three key interconnected actors: the firm, the media, and the marketplace (consumers). Actors contribute in numerous ways. Consumers contribute through online WOM, their attitudes (captured through consumer sentiment), and so on, and firms contribute through advertising, press releases, and so on. Thus, there are five “sources” of actions: firms, news media, online WOM, consumer sentiment, and business outcomes, shown in the five boxes in Figure 1. There are 11 components associated with the five sources: firm advertising spending, firm social media (e.g., Twitter) volume and valence, press release volume and valence, consumer sentiment, consumer online WOM volume and valence, traditional media news stories’ volume and valence, and business outcomes. Next, we offer evidence regarding links between the sources as it aligns with our research questions.
The Echoverse
Strength and Nature of the Echoverse (RQ1 and RQ2)
The brand crisis literature supports the relationship between firm communications and traditional news media. The communications literature also offers evidence that firm communications can influence news (An, Gower, and Cho 2011). Support for the firm communications–consumer sentiment link has also been found in research demonstrating the influence of firm responses to negative events on brand perceptions (Ahluwalia, Burnkrant, and Unnava 2000). The market orientation literature, drawing on the premise that firms leverage customer information to make marketing mix decisions, provides support for the impact of consumer sentiment on firm actions.
The traditional media's link to online WOM has received surprisingly little coverage in the literature. An exception is a study by Berger and Milkman (2012). The traditional media–consumer perceptions link is explored in research on how news influences consumer perception (Ahluwalia, Burnkrant, and Unnava 2000; Ahluwalia, Unnava, and Burnkrant 2001). Research has also shown firm communications’ impact on performance through consumer sentiment (Bart, Stephen, and Sarvary 2014; Vakratsas and Ambler 1999; Zarantonello, Jedidi, and Schmitt 2013). Finally, Wang, Zhang, and Ming (2009) argue that advertising adds intangible firm value through its influence on consumer mindsets and behavior. Our study is also unique in exploring the impact of firm performance on other echoverse components.
Asymmetries in the Echoverse (RQ3)
We also aim to understand whether influences among echoverse sources are symmetrical or whether they can be asymmetrical, and we aim to identify how managers should prioritize their firms’ contributions. Detecting the dynamics in the echoverse should facilitate such decisions. In line with the megaphone concept (McQuarrie, Miller, and Phillips 2013), if one actor systematically controls the discourse, asymmetries may result. We explore the nature of such asymmetries.
Changes in the Echoverse over Time (RQ4)
We also aim to understand changes in the echoverse over time, particularly in light of the influence of social media on brand communications. McQuarrie, Miller, and Phillips (2013, p. 153) view the Internet as providing “new forms of consumer behavior.” We similarly expect social media to provide new forms of activities among all sources in the echoverse. For example, there is evidence of the changing role of news media such that consumers increasingly look to social media sites such as Twitter for content they previously would have obtained through traditional media (Barthel et al. 2015). Similarly, the market research firm Forrester estimated that by 2016, advertisers would spend as much on interactive marketing over the Internet as they did on television in 2011 (VanBoskirk, Spivey-Overby, and Takvorian 2011). Thus, with changes in how actors can leverage echoverse components to influence one another, we explore changes in the overall dynamics across echoverse relationships.
Company Differences in Managing the Echoverse (RQ5)
There is evidence that firms may differ in their ability to manage the echoverse. Studies on brand crises have found that firm communications can vary in effectiveness on the basis of factors such as the message used (Cleeren, Van Heerde, and Dekimpe 2013), price (Van Heerde, Helsen, and Dekimpe 2007), and brand equity (Dawar and Pillutla 2000). The communications literature has also shown varying effectiveness of press releases (Choi and Park 2011). Anecdotally, the varying ability of firms to manage social media “firestorms” supports such differences. For example, the firm ING-Diba was able to quiet an onslaught of consumer dissatisfaction on its Facebook page, emerging with an even stronger image (Pfeffer, Zorbach, and Carley 2014), whereas the firm Kryptonite was unable to quiet such a firestorm. Of interest is the nature of these differences, which remains an empirical question, and how firms can manage echoverse relationships. Next, we discuss our method for testing our conceptual framework.
Method
Data and Sources
We test our conceptual framework in the financial services industry. We focus on the four top U.S. financial service firms—Bank of America, Citibank, JPMorgan Chase, and Wells Fargo—and study the period 2007 to 2013. This period in banking was particularly tumultuous. Legislative changes, the competitive landscape, the mortgage and global financial crises, and rapid growth of social media conspired to create a taxing environment for brand communications and for managing firm performance. Thus, our findings are particularly relevant for marketers facing an increasingly complex brand communications environment. Next, we describe the data used to represent each echoverse component.
Traditional media news stories
Using Factiva (Dow Jones), we captured news articles mentioning any of the four banks during our study's time period. Factiva includes the world's top media outlets, including offline publications and web sites. Because articles are frequently duplicated, we limited our universe of articles to those published by one or more of the top 25 media outlets based on average circulation across our time frame, obtained from the SRDS database (Kantar Media). Circulation figures enabled us to assess reach for each article. Our analysis includes the 14 outlets accessible through Factiva in the top 25; the remaining 11 were unavailable due to Factiva academic licensing restrictions. 2 Web Appendix A provides a list of publications.
As a robustness check, we also used an alternative set using only the accessible publications from the top 10. The correlation of model variables (news article volume and valence) with the alternative set variables was .97–1.00.
We classified 65,261 articles in line with the banks mentioned, which enables us to count articles for multiple different banks when more than one is mentioned. We ran the resulting text through the Linguistic Inquiry and Word Count (LIWC; Pennebaker and Francis 1996) software to extract quantitative data about the underlying text. The LIWC software reads files word by word, matching each word against a dictionary of words that are defined for different types, such as positive and negative emotional, money-related, and anger words. It outputs 80 distinct measures varying from general descriptors (e.g., total word count) to linguistic elements (e.g., auxiliary verbs) to psychological constructs (e.g., cognitive words). We focus on the valence and volume of news articles. We obtained the percentage of positive and negative words using LIWC, then weighted articles by outlets’ weekly circulation to obtain a weighted percentage of positive and negative words (e.g., 3.1% and 1.1%, respectively). Subtracting weighted negative word percentages from the weighted positive word percentages (e.g., 3.1% – 1.1% = 2%) yields weekly valence scores.
Online WOM
Twitter data are a particularly useful proxy for social media. In contrast with Facebook, which contains more personal conversation, or blogs, which tend to be written by full-time commentators on an industry, Twitter tends to focus on information sharing and communications directly between consumers about firms (Kwak, Lee, and Moon 2010). In addition, because the default for Twitter is that all tweets are public, they are more likely to have a broadcast-like effect on consumer decisions than Facebook discussions, where the default is private. Finally, Twitter data are publicly available for a limited time, and historical data can be purchased. Thus, studies using Twitter data are replicable, unlike those using other, more proprietary forms of social media data. We captured online WOM activity for each bank with tweets mentioning at least one of the focal firms over the study's time period.
We purchased raw tweets from Gnip (now owned by Twitter). We provided Gnip with a list of phrases to pull tweets matching those terms for the study's time period (a total of 18,577,733 tweets). Web Appendix B lists the phrases. We aggregated these data into weekly counts either from or about each bank, enabling us to track whether tweets were firm created or created by others. We used a standard Twitter sentiment analysis tool (Go, Huang, and Bhayani 2009) to score each tweet as positive or negative on a scale of −1.0 through +1.0. We then averaged positive and negative tweet values separately over each week. For example, there may have been 800 positive tweets with an average valence of +.6 and 200 negative tweets with an average valence of −.3. We then weighted these values by the number of positive and negative tweets to obtain a weekly Twitter valence score for that bank that week. In the example, the valence score would be (800 × .6 + 200 × −.3)/1,000 = .42. Thus, we obtain four Twitter-based measures: (public) online WOM volume and valence and firm Twitter volume and valence.
Consumer sentiment
We assess consumer sentiment with an attitudinal index, the BrandIndex database (YouGov). Using this database, we captured weekly reporting of the BrandIndex overall buzz metric, calculated as the percentage of respondents who heard or saw something positive or negative about a brand in the past two weeks. The net score is between −100% (all respondents report negative buzz) and +100% (all respondents report positive buzz).
Firm communications
We captured firms’ participation in social media through tweets originating from firm-sponsored Twitter accounts, as described previously. Next, from firm websites we compiled press releases issued between 2007 and 2013 and aggregated them by week. A total of 5,376 press releases were converted into plain text files from Word using the opendocx Python module (https://pypi.python.org/pypi/docx). Dates were automatically pulled from documents through regular expression matching using Python code. We then processed these data through LIWC in a similar fashion as for news articles, using positive and negative emotion percentages to create valence scores by subtracting negative word percentages from positive word percentages. To assess advertising spending, we used the Ad$pender database (Kantar Media), which reports monthly firm-level advertising spending.
Business outcomes
Because of the consumer's key role in the echoverse, we choose a performance metric that closely represents customer behavior. A key outcome used in bank marketing return on investment models is the level of deposits held; it is linked very closely with customer behavior and less influenced by factors such as firm income adjustments from write-offs, lawsuits, and so on. In addition, “core deposit growth drives net interest income growth, and net interest income growth drives earnings growth” (BernsteinResearch 2014, p. 1). As such, deposits are a key indicator of future performance. Using Bloomberg, we captured business outcomes through quarterly levels of deposits held by each of the focal firms. We used linear interpolation to obtain weekly values for customer deposits to align them with the observation frequency of the other variables.
Model-free evidence for the echoverse
Before discussing the econometric model, we show time series charts illustrating some of the echoverse dynamics. Figure 2 shows for Bank of America how three metrics evolved over our study's time span: online WOM volume (Figure 2, Panel A), news article volume (Figure 2, Panel B), and consumer sentiment (Figure 2, Panel C). Figure 2 indicates that several events affected the banking industry (e.g., the 2008 global financial crisis), and Bank of America in particular (e.g., the 2011 debit card fee debacle). Figure 2 shows how spikes in online WOM volume echo in news volumes and drops in consumer sentiment, and vice versa. To disentangle these effects and determine their strength and duration, we need an econometric model, discussed next.

Model-Free Evidence of the Echoverse
Econometric Modeling
In this subsection, we present the model for the relationships among the echoverse variables. We use models in the vector autoregressive (VAR) tradition because they enable us to treat all variables as endogenous, consistent with the nature of the echoverse. Almost all variables are (near) continuous, so they can be modeled adequately with a VAR model. The press release volume variable has a more discrete distribution (with most values between 0 and 10). However, its residuals are near normally distributed, so we do not need a discrete distribution such as Poisson.
Unit root tests
In a first step, we test whether variables in the echoverse are stationary or evolving. We use the augmented Dickey–Fuller panel data unit root, stacking each variable across the four banks while allowing for different unit root processes across banks. For customer deposits, the test indicates a unit root (we cannot reject the null of a unit root), so it needs to enter the VAR model in first differences. For the other variables, the test rejects the null of a unit root (p < .05), so these variables enter the model in levels.
VAR-X model
To study the interrelationships between the echoverse variables, we use a VAR-X model that allows for instantaneous (same period) or lagged (later periods) effects between endogenous variables. We include control variables, denoted by the “X” in VAR-X. We estimate two versions of the model: (1) a panel data VAR-X model with homogeneous response parameters across firms (with fixed effects for firms for level differences) and (2) separate VAR-X models per firm with heterogeneous response parameters. The panel data VAR-X enables us to obtain general conclusions about the echoverse, whereas firm-specific VAR-X models show differences between banks.
3
The panel VAR-X model is specified as follows:

In earlier analyses, we estimated a panel data VAR (PVAR) model using hierarchical Bayes to accommodate response parameter heterogeneity (e.g., Chakravarty and Grewal 2011). Results for the hyperparameters were very similar to classical PVAR model results. We decided against a Bayesian PVAR model because the number of cross-sections is rather limited (four banks), making it difficult to estimate the parameter heterogeneity distribution reliably.
where b = 1, …, B (= 4) banks and t = 1, …, T (= 343) weekly observations, from July 2007 to December 2013 (total of 1,372 observations). Table 2 defines the vector of endogenous variables.
Variable Operationalizations and Descriptive Statistics

Notes: All data are weekly (N = 343 weeks) except for customer deposits, which is observed quarterly. We used linear interpolation to obtain weekly values for customer deposits.
Firm fixed effects (Db)
In Equation 1, a1,0, …, a11,0 are the intercepts and Db are bank dummies: Db = 1 for bank b and 0 otherwise; the Bth bank serves as a reference category. These bank fixed effects account for any time-invariant bank factor. This means that in terms of identification, the model uses within-bank over-time variation to estimate the parameters. Because we have a long time series (6.5 years of weekly data), this poses no problems.
Effects between endogenous variables
Equation 1 captures the contemporaneous effect between variables through the error term
Schwarz Criteria to Test the Optimal Lag Length in the VAR-X Models

Notes: The bold number with the asterisk (*) is the optimal lag length corresponding to the lowest Schwarz criterion (= Bayesian information criterion).
Cross-bank effects (Cmbt)
In Equation 1, Cmbt captures cross-bank effects parsimoniously by including five variables for competitor actions averaged across the three nonfocal banks: C1bt = competitor Twitter volume; C2bt = competitor Twitter valence; C3bt = competitor press release volume; C4bt = competitor press release valence; and C5bt = competitor advertising. 4
A much less parsimonious alternative approach would be to stack all competitors in one long vector of endogenous variables. This would enlarge the state space considerably and potentially make the model intractable. In our setting, with 11 endogenous variables and four competitors, we would go from having an 11-variate endogenous variable to a 44-variate endogenous variable, with a corresponding 44 × 44 set of dynamic effect parameters fi,j,1.
Time-varying control variables (Ept)
The echoverse components are also likely to be affected by time-varying external shocks that are common across firms. In the context of consumer banking, we consider three key types of industry-wide shocks that drive consumer attitudes and behavior: consumer confidence levels, unemployment rates, and personal saving rates. If consumers feel more confident about the economy, they are likely to make different saving and investment decisions (e.g., choose more risky assets than bank deposits) than when they are more downbeat. If the unemployment rate increases, more consumers face shortfalls in income levels and may have to draw from their bank deposits. The higher the personal savings rate, the more attractive bank deposits are for consumers, ceteris paribus. To account for these observable shocks, Equation 1 includes E1t = consumer confidence levels and E2t = unemployment rate (both in first difference because they have unit roots), and E3t = personal savings rate. Equation 1 also contains E4t, a dummy that is 1 for Wells Fargo in the quarter in which Wells Fargo took over Wachovia (and 0 otherwise), which caused an increase in its customer deposits. Finally, Equation 1 includes E5t, a time trend to account for general trends (e.g., online WOM growing over time). Web Appendix C shows the sources and descriptive statistics for the control variables.
An alternative way to account for industry-wide shocks is time fixed effects (a dummy per time period). We decided to include five time-varying control variables instead of using time fixed effects because the key shocks to this industry are readily observable and the control-variable approach is much more parsimonious than time fixed effects (T fixed time effects would absorb T − 1 = 342 d.f.). The argument is also that these control variables compensate for the time fixed effects if a shock is given at a time period. In other words, while a fixed effect would account for all of the unobserved shocks, the time-varying control variables account for all of those unobserved shocks that are usually expected.
Separate VAR-X models
The separate VAR-X models per bank use the same set of variables. The difference with Equation 1 is that all parameters are now bank-specific:
Results
Granger Causality Tests
Before reporting the VAR-X results, we first discuss the outcomes of Granger causality tests between variables. There are 11 variables in the echoverse. Therefore, there are 11 × 10 possible bivariate effects of one variable on another. Out of these 110 possible effects, 55 (50%) show significant Granger causality (p < .1) using a panel Granger test with a lag of 1. Each of the 11 variables is Granger-caused by at least one other variable, and on average each variable is Granger-caused by five other variables. For a more complete understanding of the echoverse, we need a multivariate analysis provided by VAR-X models.
We first discuss the results for the panel VAR-X Model 1 that informs us about the overall echoverse for the representative firm. Next, we report how the echoverse has changed over time. Then, we examine the difference between banks based on the VAR-X models per bank. Finally, we extend the analysis by including multiple sources of online WOM.
Model Fit
Table 4 (second column) summarizes panel VAR-X Model 1 fit. The R-squares show reasonable model fit, with more explanatory power for volume variables than for valence variables. Detailed parameter estimates (including for control variables) are available in Web Appendix C. Web Appendix D reports a holdout analysis for the panel VAR-X model.
Model Fit: R-Squares

What is the Strength of the Echoverse (RQ1)?
We summarize effects between the endogenous variables through generalized impulse response functions (IRFs), showing the full dynamic impact of a standard deviation shock in one variable on others (Pesaran and Shin 1998). We obtain 121 IRFs for the response of 11 endogenous variables to shocks, applied in turn, to each variable. The IRFs show mean responses and 90% confidence intervals for the representative bank. The effect of one variable on another is significant if there is at least one period in the IRF with a significant effect (two-sided tests, at p < .1).
To measure the strength of the echoverse, we note that it incorporates contributions from five sources: firms, online WOM, news media, consumer sentiment, and customer deposits (Figure 1). Thus, there are, in principle, 5 × 5 = 25 arrows between sources representing the effects of each source on every other source (20 in total), or the effect of each on itself (5 in total). Within each of the 25 possible arrows, we use the IRFs to assess whether there is a statistically significant effect either contemporaneously or with a lag.
Figure 3 reports the results. We find that for 22 out of all 25 arrows (or for 17 out of 20 between-source arrows), there is at least one statistically significant effect. Thus, there is clear statistical evidence for the echoverse. In particular, there is a clear and symmetric echo between traditional media stories and online WOM, with 100% significant effects both ways. Firm communications influence the traditional media (50% significant), consumer sentiment (40% significant), online WOM (30% significant), and business outcomes (60% significant).

The Calibrated Echoverse: Arrow Width Reflects the Percentage of Significant Effects
What is the Nature of the Echoverse (RQ2)?
To measure the nature of the echoverse, we consider the sign (positive or negative) of one component's effect on another within the set of significant IRFs. Table 5 summarizes these findings. We focus on the most prominent patterns and illustrate these with corresponding IRFs.
Nature of the Significant Effects in the Echoverse

Notes: These effects are significant at the 10% level (two-sided tests) in the panel VAR-X model. For company communication, we use the label “moderate” for a lower-valence message and “positive” for a higher-valence message, because firms are hardly ever truly negative in their own communications. For media and online WOM, we use the labels “negative” and “positive.”
Bad news spiral
A key observation in our context is that bad news spreads fast and wide. In line with findings regarding negative experiences being shared to a greater degree than positive experiences (Anderson 1998), negative messages (as opposed to positive messages) spread quickly both within a medium (e.g., traditional news media) and across media (e.g., from the news media to online WOM). To illustrate this pattern, Figure 4, Panel A, shows how a negative shock in valence of news articles leads to an increase in online WOM. 5 More online WOM leads to a drop in consumer sentiment (Figure 4, Panel B), which in turn increases the number of news articles (Figure 4, Panel C). More negative online WOM also leads to more news articles (Figure 4, Panel D). Importantly for firms, all of this matters because more negative consumer sentiment leads to lower customer deposits (Figure 4, Panel E), as does an increase in the volume of online WOM (Figure 4, Panel F).
As a point of clarification, this effect is obtained using a model that is symmetric. If the valence of news was in the opposite direction, the effect would be of the same magnitude, but with the opposite sign. Thus, a positive shock in news article valence leads to a decrease in online WOM. The same principle applies to the other effects in Figure 4.
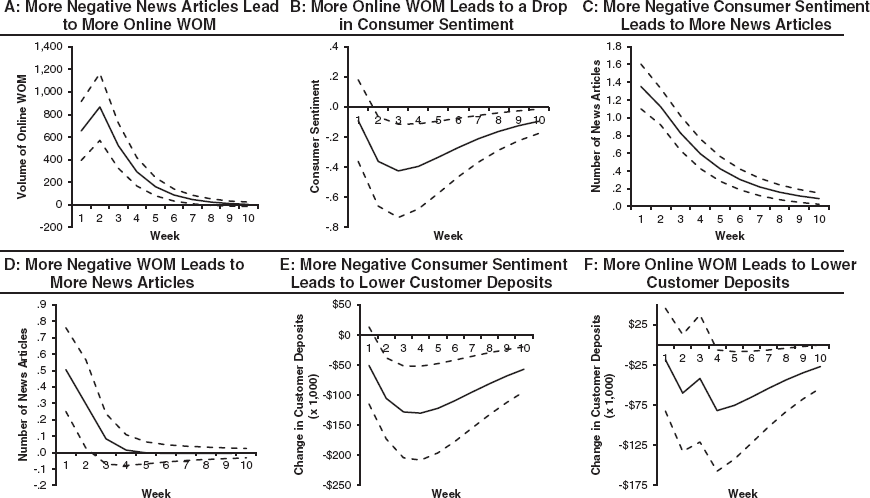
Bad News Spreads Fast and Wide in the Echoverse (Full Time Period)
Firm's impact on the echoverse
What can firms do about a spiral of negative news? Our analysis provides several suggestions. First, company tweets can calm things down. An active Twitter strategy pays off because the volume of company tweets is successful in driving down both the volume of online WOM (Figure 5, Panel A) and the number of news articles (Figure 5, Panel B). It also lifts consumer sentiment (Figure 5, Panel C). Having an active Twitter strategy to counter firestorms that develop online or in the news media seems an effective approach to essentially deprive the fire of oxygen.

The Impact of Firm Actions on the Echoverse (Full Time Period)
A second finding is that press releases can be surprisingly effective. When we started this research, we were agnostic about the effectiveness of press releases, as this is a variable that rarely appears in the marketing literature (see Table 1). Notably, more positive press releases can lift the tone of online WOM (Figure 5, Panel D). A more upbeat press release tone is picked up in the valence of public tweets. This can be explained by the fact that press releases are available to the public through Twitter and other online portals (Swallow 2010). We also find that more press releases, especially more positive press releases (Figure 5, Panel E), are effective in lifting customer deposits.
A third key takeaway is that advertising bypasses the echoverse. Advertising does not significantly affect traditional media, online WOM, or consumer sentiment. It does, however, positively affect customer deposits (Figure 5, Panel F). This finding is in line with the notion that advertising is typically not meant to counter short-term matters being discussed online or in the media, but rather to influence consumers’ long-term perceptions and preferences. Advertising gives consumers positive reasons to choose a firm, which leads to positive business outcomes.
Are There Asymmetries in the Echoverse (RQ3)?
To assess asymmetries, we consider whether one echoverse source has a higher percentage of significant effects on another source (A affecting B) than the other way around (B affecting A). Figure 3 shows that one key asymmetry is that firm communications respond more to online WOM (50% significant) than to consumer sentiment (20% significant). This result is in line with the notion that firms increasingly attend to online WOM rather than more classical, survey-based consumer sentiment. Another key asymmetry is the finding that consumer sentiment responds to online WOM (50% significant), but online WOM does not respond to consumer sentiment (0% significant). This finding is in line with the opinion leadership role of the Twittersphere: as it leads the way, the general population (polled to measure consumer sentiment) changes their minds. Finally, online WOM drives business outcomes (50% significant), but the reverse path is not present (0% significant). Thus, consumer chatter matters for business outcomes but tends to ignore these outcomes.
How Has the Echoverse Changed over Time (RQ4)?
Given the rapid growth in Twitter usage since its inception in 2006, its role in the echoverse may have changed over our study's time period. To explore this possibility, we run a moving-window analysis of the panel VAR-X model, shifting a four-year window by half a year at a time. That is, we estimate the model separately for six moving windows: (1) mid-2007 through mid-2011, (2) the beginning of 2008 through the end of 2011, (3) mid-2008 through mid-2012, (4) the beginning of 2009 through the end of 2012, (5) mid-2009 through mid-2013, and (6) the beginning of 2010 through the end of 2013. The moving windows yield enough observations to estimate the model reliably and are short enough to enable us to spot echoverse changes over time.
Table 6 shows which echoverse effects change meaningfully over time. We define “meaningfully” as being significant in at least two of the first three windows and insignificant in the final three windows, or vice versa; alternatively, it refers to the sign of the effect changing from significant positive to significant negative, or vice versa (with at least two sign changes). To avoid clutter, Table 6 does not show intrafirm responses (e.g., press releases to advertising; these results are available on request).
Changes in the Echoverse over Time

Because of the importance of this outcome variable for Customer Deposits, we also include changes that happen in at least one window for this dependent variable.
Notes: This table compares the first three moving windows of four years (mid-2007 through mid-2011, the beginning of 2008 through the end of 2011, and mid-2008 through mid-2012) with the final three windows (the beginning of 2009 through the end of 2012, mid-2009 through mid-2013, and the beginning of 2010 through the end of 2013). Effects are only included in the table if they change meaningfully over time.
One key conclusion from our results is that the nature of online WOM has completely reversed. In the early days of Twitter (first three windows), there was a “positivity spiral”: a positive impact of online WOM valence on online WOM volume, and vice versa. More positive messages led to more messages, leading to more positive messages, and so on. More recently (most recent three windows), this event turns into a “negativity spiral”: the impact of online WOM valence on volume (and vice versa) turns negative. More negative messages lead to more volume, which leads to a more negative tone, and so on. This result is in line with Anderson's (1998) finding of a greater likelihood of sharing negative experiences and anecdotal evidence of the greater impact of negative versus positive social media (Diamond 2015). We also find that traditional media are increasingly in a negativity spiral: more negative news increasingly leads to more news articles.
Another major change is that classical consumer sentiment has lost impact on online WOM and on customer deposits over time. The latter finding is illustrated in Figure 6: whereas in the first time window there is a positive effect of consumer sentiment on customer deposits (Figure 6, Panel A), the effect turns insignificant in the most recent time window (Figure 6, Panel B).

Change over Time in the Impact of Consumer Sentiment and Company Twitter Volume on Customer Deposits
Table 6 also shows that firms have changed their strategies over time. They are increasingly countering negative consumer sentiment with more positive press releases. Similarly, they increasingly use more positive tweets when confronted with a surge of online WOM, especially negative WOM. However, in terms of volume of tweets, firms increasingly hold back when there is a surge in online WOM about the firm or a spike in news coverage.
Notably, firm Twitter strategy increasingly affects business outcomes. Whereas the volume of firm tweets has no effect on deposits in the first time window (Figure 6, Panel C), it starts to have an impact in the final period (Figure 6, Panel D). Although the effect is significant for only one time window (the final one), it is promising to see that an online communication strategy is starting to pay off. We also find that a more moderate-in-tone (vs. overly positive) Twitter strategy starts to have an impact in the most recent time window (Table 6).
Are There Company Differences in the Echoverse (RQ5)?
We next turn to differences between banks based on firm-specific VAR-X models estimated across the full time period. We conducted a nested-model F-test that shows that the homogeneity of firm-level coefficients needs to be rejected (F(61, 1,269) = 3.26, p < .001). Table 4 shows model fit for the firm-specific models, and detailed parameter estimates appear in Web Appendix D. For each bank, we obtain 121 IRFs showing the response of 11 echoverse variables to shocks, applied in turn to each variable. Drawing on IRFs for each bank, Table 7 formulates proposed actions to handle crisis situations, defined as a surge in negative online WOM or negative news coverage and/or a drop in consumer sentiment. The goal is to lift the mood (valence) in online WOM, news coverage, consumer sentiment, and, ultimately, customer deposits. Table 7 documents how some firms are better at managing the echoverse than others.
Are Some Firms Managing the Echoverse Better Than Other Firms?

This is a counterintuitive effect of advertising by Citibank. A possible reason is that Citibank has a somewhat different business model than the other banks, with much heavier (advertising) focus on credit card offerings as opposed to checking or other deposit accounts. Thus, its advertising messages may have less of an impact on overall attitudes toward the company than enterprise-level messages often used by the other firms.
We find remarkable contrast in the effectiveness of Twitter strategies across banks, particularly between Bank of America and Wells Fargo. Bank of America is the only bank that is able to drive down the volume of online WOM by increasing the number of its own tweets (Figure 7, Panel A), whereas Wells Fargo is not (Figure 7, Panel B). Likewise, the same strategy pays off for Bank of America (and also Chase) in driving down media coverage (Figure 7, Panel C), whereas it does not pay off for Wells Fargo. Bank of America can lift customer deposits through more company tweets (Figure 7, Panel E), whereas this result does not hold for Wells Fargo (Figure 7, Panel F) or the other banks.
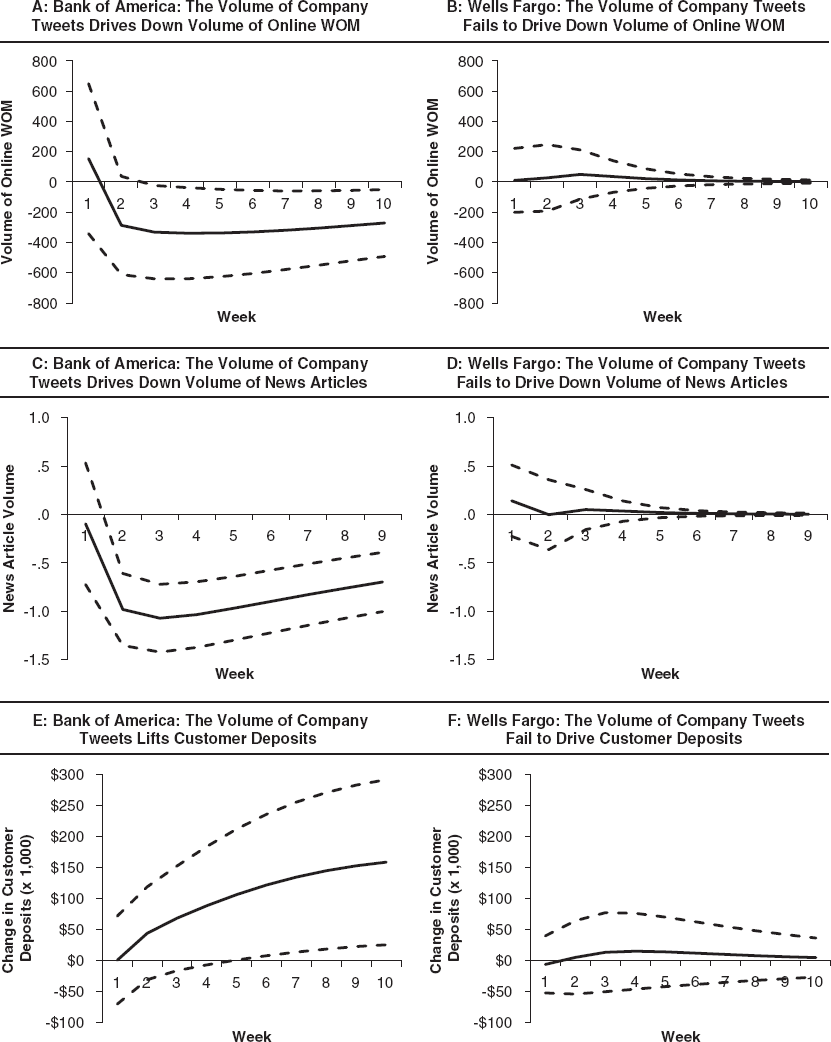
Differential Impacts of the Twitter Strategies of Bank of America and Wells Fargo
So what is the difference in Twitter strategy between Bank and America and Wells Fargo? To explore this, we conduct a follow-up analysis of tweets. As Table 1 shows, Bank of America averages far more weekly tweets (272) than Wells Fargo (52). However, the average valence of Bank of America's tweets (.16) is far lower than Wells Fargo's (.65). Thus, Bank of America's tweets are, on average, much less positive in tone than Wells Fargo's. Notably, the standard deviation in firm Twitter valence for Bank of America (.20) is barely half that for Wells Fargo (.42). We infer that Bank of America has a higher volume of tweets, which are more consistent (lower standard deviation) and more moderate in tone than Wells Fargo's. This high-volume, consistent, and reasonably toned Twitter strategy apparently strikes a chord with consumers, tempers online WOM, and enhances customer deposits. Wells Fargo's strategy of issuing (too-) positive tweets may ring hollow to consumers, thus lacking impact or even backfiring. Consistent with this inference, Table 7 shows that for Wells Fargo, more moderate tweets may help contain online WOM volume and lift consumer sentiment and news valence.
Further evidence for different Twitter strategies can be found by examining the distribution of tweets across firm-sponsored Twitter accounts. Table 8 shows the number of tweets across accounts used primarily for customer service versus accounts related to news, information, and promotion across the four banks. Tweets were also scanned for individual Twitter usernames. We tallied total mentions (tweets containing a username), replies (username at the beginning of a tweet), or retweets (containing any form of the letters “RT” at the beginning). As Table 8 shows, Bank of America uses Twitter for customer service more than the other banks, with more than 90% of its tweets originating from customer service accounts versus 60%–70% for the other firms. In addition, tweets from customer service accounts across all banks are more likely to be in the form of mentions or replies. Chase and Citibank are more likely than the others to use promotional Twitter accounts, and Chase is most likely to engage in one-on-one promotional communications through Twitter (26.55% of replies from promotional accounts).
Percentage of Tweets Across Different Bank-Sponsored Accounts

Differences in banks’ Twitter strategies were also described in a report by Sparkcentral, a customer experience software developer (Vu 2012). The report notes that, as of 2012, Bank of America's customer service responses “are wildly higher than any other bank” and that the firm has a policy of answering most of its complaints, whereas the other banks tend to largely ignore complaints and “let people vent.” Responding to complaints would arguably yield less positive tweet valence than using Twitter for promotional purposes. Importantly, responding to individuals versus broadcasting messages seems to distinguish the banks’ Twitter strategies.
Robustness Check: Other Forms of Online WOM
So far, the analysis has focused on one major source for online WOM: Twitter. Although Twitter has become a key facilitator for consumers’ raves and rants, it is not the only source of online WOM, and additional WOM channels might also be analyzed (Schweidel and Moe 2014). As a robustness check, we gathered additional data from BrandWatch (www.brandwatch.com), a social media intelligence firm, through an academic license. Unfortunately, we were unable to obtain data that matched our previous data exactly. The BrandWatch data set was from July 2010 to August 2015 and covered only two firms (Wells Fargo and Bank of America) because of access limits. We processed the BrandWatch data into seven new time series describing firm mentions on various channels (Twitter, Facebook, blogs, image, video, reviews, and forums; www.brandwatch.com/sources). Valences of almost all of these signals were positively correlated with one another. There were some differences in correlations of the volume of the data, but Facebook and Twitter are positively correlated with each other for both banks. The correlation within 11 out of 12 bank-years is positive for both banks between blog and Twitter volume. Because both valence and volume time series are fairly highly correlated across social media, and other social media sites are problematic in terms of availability, we chose to keep our model simple and focus on Twitter as a social media data source.
Discussion
Summary of Findings
RQ1 and RQ2: What is the strength and nature of the echoverse?
From a study of four leading banks, our findings clearly support the existence of the echoverse. Traditional media news stories, online WOM, and firm communications all reverberate and echo one another (and themselves). Negative news travels fast and wide between consumers (online WOM) and the news media. Consumer sentiment and online WOM significantly affect customer deposits, the latter confirming the centrality of online WOM in driving business outcomes. During the study's time period, social media use increased markedly. Twitter use increased from approximately 5,000 tweets per day in 2007 to more than 300,000 per day in 2008, to more than 500 million tweets per day in 2013 (http://www.internetlivestats.com/twitter-statistics/#trend). Firm communications (e.g., Twitter, press releases) also affect online WOM and news media, whereas advertising bypasses the echoverse to influence customer deposits directly.
RQ3: Are there asymmetries in the echoverse?
There are some strong asymmetries in the echoverse. One is that consumer sentiment follows online WOM, but not the other way around, confirming the opinion leadership role of online WOM. Moreover, online WOM drives business outcomes, but not the other way around. Finally, firms respond more to online WOM than to traditional consumer sentiment.
RQ4: How has the echoverse changed over time?
Our results show that the echoverse is changing as online WOM proliferates. Online WOM has plunged into a negativity spiral, with negative news receiving greater impact on WOM volume over time, and traditional news media have fallen into the same negativity spiral. Traditional consumer sentiment measures have less impact on performance. Firms have changed their communication strategies over time and are increasingly able to drive firm outcomes through social media strategies.
RQ5: How do the response dynamics to the various communications sources in the echoverse differ across companies?
Our findings show different levels of effectiveness in managing the echoverse across companies. For example, Bank of America has a relatively effective Twitter strategy compared with Wells Fargo. As noted previously, Wells Fargo tends to use Twitter as a positive “broadcast” medium, rather than responding to individual customers. This strategy may not resonate with consumers. In contrast, Bank of America tends to use Twitter as a vehicle for personalized responses to customers, matching this much higher volume of Twitter use with a more moderate tone in terms of content.
Theoretical Contributions
This study expands on the echo chamber idea widely postulated in the popular business press. It builds the conceptual framework of a reverberating echoverse, in which all brand communications vehicles echo all others (and themselves). Consumer sentiment and business outcomes are theorized to link to the brand communications vehicles in the echoverse. Whereas previous research has tended to focus on isolated aspects of the echoverse (e.g., online WOM, press releases, advertising, firm Twitter posts, traditional media news stories), we consider all of these sources to be one system and then theorize and measure their feedback loops.
Our results contribute to existing theoretical perspectives on the reverberation of messages among components of the brand communication environment and extend the notion of the megaphone (McQuarrie, Miller, and Phillips 2013) to illustrate how each echoverse actor can grab attention. McQuarrie, Miller, and Phillips (2013) suggest that social capital can be built more effectively by repeated and responsive social media messages as with Bank of America's Twitter strategy.
Our finding that both online WOM and traditional media news stories have reversed in terms of their effects on each other (showing a positivity bias early in our study's time frame and then plunging into a negativity spiral) potentially extends findings regarding the negativity effect, or tendency of consumers to focus on negative information because consider it more diagnostic (Ahluwalia, Burnkrant, and Unnava 2000). Curiously, this result supports Berger and Milkman's (2012) finding that consumers are more likely to share positive content on social media during earlier windows and then reverse in later windows. Our use of a seven-year window may expose limits in the ability of previous research to reveal a longer-term dynamic consistent with the view of social identity theory that, when content is related to a salient social categorization, consumers accentuate similarities between themselves and in-group others (Duck, Hogg, and Terry 1999), which may sway what they share on social media. Although Berger and Milkman (2012) argue that consumers will share content they believe reflects positively on them, their findings can be viewed as consistent with social identity theory because consumers may perceive positive content as consistent with in-group others’ views. As consumers see more negative content, they may perceive that views of in-group others have become more negative and that sharing negative content would reflect positively on them.
Our finding that consumer sentiment loses its impact on customer deposits over time, and that advertising bypasses the echoverse, expands understanding of how advertising affects performance. Wang, Zhang, and Ming (2009) argue that advertising affects performance through its role in the brand value chain (i.e., it helps create, reinforce, and accumulate brand knowledge, the foundation of consumer-based brand equity; Keller 1993). This may explain our finding that advertising affects customer deposits in the long run (Figure 5, Panel F) but not consumer sentiment. Although we did not measure brand equity and are unable to test this relationship, our results appear consistent with advertising's influence on performance outside of the influence of the echoverse, contributing to brand equity, which has a more stable impact on consumer behavior.
Managerial Contributions
This study offers insights about how marketing managers can have a greater impact on the echoverse and, ultimately, on firm performance. Our findings also have important implications for how managers make sense of the evolving communications environment in which they operate. We discuss implications both outside and under firms’ control, as demonstrated in our sample.
Factors outside firms’ control:
Within the consumer–consumer dyad, the media–media dyad, and the consumer–media dyad, negative news has stronger reverberations than positive news in terms of driving up volumes. Higher volumes, in turn, tend to lead to a more negative tone, or a negativity spiral. This means that scandals and crises tend to self-propel across the echoverse. This is a fact of life for firms, but fortunately our research offers tips on how to counter this, as we explain next. Traditional consumer sentiment measures may be growing less predictive of business outcomes as online WOM has become more influential. The rapid growth of predictive analytics offers evidence that many firms are shifting their focus at least in part to monitoring social media WOM. The business intelligence industry, including predictive analytics, is expected to grow to as high as $136 billion by 2020 (Robb 2012). This result suggests that this growing investment in “social listening” may be warranted (Aarons-Mele 2015).
Factors under firms’ control:
Confirming popular perception, online WOM has become a critical component of the echoverse, whereas traditional measures of consumer sentiment have become less important. This shows that online WOM marketing strategies are now central to driving business outcomes. A personalized Twitter strategy, focused on responding to individual customers, may be more effective than a “broadcast” Twitter strategy that essentially uses social media as a promotional medium. A high-volume, moderate-tone Twitter strategy is able to calm both online WOM and traditional media by reducing the volume of messages about the firm. A recent Forrester study found that advertising spending accounts for 83% of marketers’ social media budgets (Elliott et al. 2015); however, another study also found that only 4% of marketing managers report seeing substantial returns on their companies’ current social media investments (McKinsey 2014). Given the stakes for firms investing significantly in social media advertising, our results thus offer help in guiding those efforts for potentially greater returns. Press releases can be surprisingly effective: they not only enhance the tone of online WOM but even drive business outcomes. This finding may be of particular interest to marketers given the perception that other marketing activities are more valuable. For example, by one estimate, marketers typically invest up to 30 times more in advertising than in public relations activities such as issuing press releases (Galant 2012). On aggregate, advertising does not affect the news media, online WOM, or consumer sentiment, but it does directly influence business outcomes. This result offers supporting evidence to marketers needing to justify maintaining investments in advertising, especially given the continued growth in total U.S. advertising spending (eMarketer 2014), while marketing is increasingly expected to demonstrate its contribution to the bottom line.
In summary, our findings suggest that brand communications strategies should consider the whole echoverse to include both online and traditional offline elements. Online WOM is gaining importance over time, so relatively more emphasis should be given to online communications as social media sites continue to grow. At the same time, traditional public relations activities have a new role to play in driving online WOM, whereas traditional advertising offers a means to move business outcomes by bypassing the Twittersphere and news coverage.
Limitations and Directions for Further Research
Despite this study's expansiveness, it has some limitations in its scope and granularity as well as the rapidly evolving WOM context. This study quantitatively investigated only one industry: financial services. Further research could assess whether our results hold in other industries. Next, our study is limited in the specific data used to represent the echoverse components (i.e., Twitter as the sole indicator of social media WOM and consumer deposits as the sole performance indicator). There are other channels used by firms, consumers, and the media not captured here. In addition, our analysis relied on fairly broad measures such as volume and valence. Future studies might address more granular aspects of brand communications, breaking them into specific topics and dimensions. One challenge is that if we were to add variables for content, the vector of endogenous variables would expand considerably, compromising the ability to estimate VAR models and IRFs. Online WOM vehicles are also still very young, and the online environment is evolving rapidly. We already identified changes in the echoverse over seven years. As the echoverse evolves, new insights can be drawn, with the promise of informing not only magnitude of channel use but also content of communications.
Further research should study in more depth how the echoverses of competitors interact with each other. This extension will also lead to a sizable increase in the vector of endogenous variables, which may mean that other models than VARs need to be used. Finally, another potential limitation is our use of YouGov's BrandIndex metric, which may be influenced by news and other factors outside of firms’ control to a greater extent than traditional brand health metrics. This may explain the lack of relationship between advertising and consumer sentiment. Future studies could include more traditional metrics, such as brand attitudes or satisfaction.
Conclusions
We conclude that a reverberating echoverse exists. That is, traditional media news stories, online WOM, and firm communications all echo one another. This echoverse is changing as online WOM assumes greater importance. Thus, firms must manage the echoverse to get the desired business outcomes, which increasingly implies effectively managing online WOM (public and firm). Traditional consumer sentiment measures may be declining in relevance as online WOM becomes more important. As consumer brand communications increasingly move from one to one (e.g., conversations) to one to many (e.g., social media), communications should shift emphasis from one to many (e.g., advertising) to one to one (e.g., personalized tweets), making online marketing increasingly a brand communications centerpiece.
References
Supplementary Material
Please find the following supplemental material available below.
For Open Access articles published under a Creative Commons License, all supplemental material carries the same license as the article it is associated with.
For non-Open Access articles published, all supplemental material carries a non-exclusive license, and permission requests for re-use of supplemental material or any part of supplemental material shall be sent directly to the copyright owner as specified in the copyright notice associated with the article.