
Abstract
This study examines customization as a coordination problem in transactions with business customers. Marketing research has investigated challenges associated with customized offers from the customer side; however, scant research has examined the supplier's challenges and their performance implications. The authors distinguish between project revenues and costs to reveal a fundamental dilemma that suppliers face during customization. Analyses of dyadic survey data collected from a software supplier and its business customers, as well as objective revenue and cost data, reveal a tension between project revenues and costs. The outcomes of customization depend on factors that relieve the coordination problem, such as customer demand ambiguity, customer participation, product modularity, project team technological capability, and relational embeddedness. These findings provide a basis to assess the value of customization as a tool to implement a customer-oriented business-to-business marketing strategy.
Keywords
Customization is a key practice for implementing customer-oriented marketing strategies geared toward creating unique value for individual customers (Dellaert and Stremersch 2005; Franke, Keinz, and Steger 2009). Particularly in business-to-business (B2B) markets, customization is an important route to building and strengthening relationships with customers (Ghosh, Dutta, and Stremersch 2006). However, firms face challenges in providing customized solutions that are also profitable (Tuli, Kohli, and Bharadwaj 2007). Customization can increase sales revenue by better serving customer needs, but it can also lead to higher costs associated with the complex coordination processes required to define the specific needs of individual customers and make relevant adaptations to existing products (Piller, Moeslein, and Stotko 2004). For example, to satisfy the unique needs of health care start-ups such as Preventice, Samsung customized its hardware and software, which prompted higher revenues from its customers but also huge customization costs (Burrows 2012). Suppliers even may lose money if the added costs of customization exceed the increased sales revenue (Stanley and Wojcik 2005). Managing this balance is crucial to enable suppliers to profit from their customization projects. Accordingly, we attempt to address two research questions: RQ1: What effects does project customization have on a supplier's project revenues and costs? RQ2: Given the tension between project revenues and costs, how should the supplier manage its customization to increase revenues and reduce costs?
With dyadic survey data from 134 pairs of B2B software suppliers and customers, as well as objective revenue and cost data, we analyze sales projects that involve varying degrees of customization. Our results confirm the presence of a tension between revenue and cost; customization does not always lead to greater profitability. Instead, project outcomes depend on factors that worsen or relieve coordination problems. In particular, low customer demand ambiguity, high product modularity, and high relational embeddedness magnify profitability by increasing project revenues or reducing project costs due to customization, whereas high customer participation magnifies both project revenues and costs.
These results represent several contributions. First, most prior research has focused on challenges from the customer side, such as unclear customer preferences, complexity, or mass confusion (e.g., Dellaert and Stremersch 2005; Franke, Schreier, and Kaiser 2010). We focus on the supplier's perspective and thereby reveal the tension between project revenues and costs that results from customization. The boundary conditions associated with this tension in turn provide a basis for assessing customization as a strategic tool that suppliers can implement to ensure the customer orientation of their B2B marketing strategies.
Second, prior research has considered various types of coordination in vertical relationships, such as information sharing, resource integration, joint development, or formal governance structures (e.g., Fang 2008; Grewal, Chakravarty, and Saini 2010; Kumar, Heide, and Wathne 2011; Lee, Hoetker, and Qualls 2015); we extend this understanding by investigating customization as a coordination problem, as well as its interactions with coordination mechanisms, to determine the financial performance of a customization project.
Third, by undertaking a scenario analysis, our study provides specific guidance to B2B managers to implement customization projects: Aligned, strong coordination mechanisms (i.e., low customer demand ambiguity and high customer participation aligned with high product modularity and project team technological capability, together with high relational embeddedness) lead to the highest profitability (26%), approximately 8 percentage points greater than an average project in our sample (18%). Alignments in the opposite direction instead lead to the lowest profitability (14%), approximately 4 percentage points lower than average. These results help clarify when and how firms should involve their B2B customers in developing customized offers.
Literature Review
Customization involves interactions between customers and suppliers to coordinate specific offerings. Marketing researchers have highlighted the challenges customers face in determining the value of customized products, despite their potential benefits compared with off-the-shelf products (see Table 1). Customization tends to increase the complexity of product configurations and designs, and customers also might experience difficulties expressing their specific preferences, choosing product designs, or recognizing the value of customized products (Dellaert and Stremersch 2005). From this perspective, prior research has examined the contingent value of customization to customers, which depends on customers’ involvement, expertise, trust in the supplier, or awareness as a creator (Franke, Keinz, and Steger 2009; Franke, Schreier, and Kaiser 2010; Simonson 2005). Prior operations management research has also revealed that the value of product customization depends on the supplier's production operations, including its customization capability and efficient, flexible practices (Liu, Shah, and Babakus 2012; Squire et al. 2006; Tu, Vonderembse, and Ragu-Nathan 2001). As such, prior research has shown that customization does not always lead to greater value for customers, but it mainly is realized through the efforts of both suppliers and customers.
Summary of Selected Literature on Customization
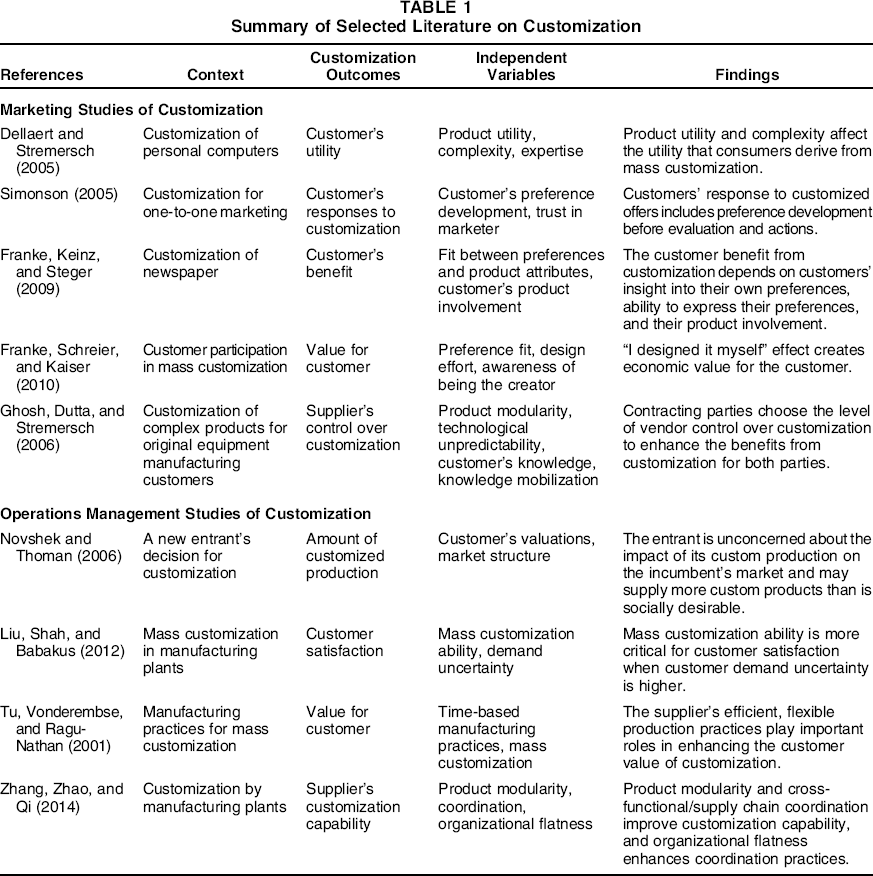
For the supplier, customization represents a relationship strategy that can be combined with joint development, customer participation, or customer education (Stump, Athaide, and Joshi 2002). Suppliers make various customization-related decisions, including their level of control over the customization (Ghosh, Dutta, and Stremersch 2006), market entry, and the amount of customized production (Novshek and Thoman 2006; Syam and Kumar 2006; Zhang, Zhao, and Qi 2014). Customization provides an effective means to continue or maintain a B2B relationship and improve relationship satisfaction (Stump, Athaide, and Joshi 2002). To be successful though, prior research has shown that customization requires the supplier to possess customization capabilities, which might stem from product attributes, close relationships with customers, or effective learning processes (Huang, Kristal, and Schroeder 2008, 2010; Tu et al. 2004).
Although these findings indicate the contingent value of customization, prior research has paid scant attention to the potential financial outcomes of such customization for suppliers. In particular, we know little about the outcomes at the project level, at which customization is a specific B2B transaction type. Research into broader, buyer–seller, vertical relationships has considered product-level performance, using measures of product innovativeness or development speed (Bonner and Walker 2004; Fang 2008) as well as firm-level performance (Chan, Yim, and Lam 2010; Fang, Lee, and Yang 2015). Yet such measures cannot capture the financial outcomes of customization projects, which would reflect how well customization works for the supplier. That question requires consideration of project-specific outcomes such as project costs, revenues, and profitability.
Theoretical Framework
Coordination Problems and Mechanisms for Customization
Customization can be regarded as a coordination problem between a buyer and a supplier that aims to implement adaptations to meet the specific needs of individual customers. Customized offers, achieved through coordination with the customer, have greater potential than standardized offers to increase supplier revenues, but the challenges of customization suggest that it also can impose costs on the supplier, creating a tension between revenues and costs. As Figure 1 illustrates, we develop a contingency model to predict boundary conditions that might magnify or relieve this inherent tension, according to the coordination mechanisms. Coordination may reside in the unilateral efforts of individual firms and bilaterally in the properties of the relationship itself between the two firms.

Effects of Project Customization on the Supplier's Project Revenue and Cost
First, the product attributes and technological capability might relieve or worsen the coordination problem associated with customization. Product modularity reflects the degree to which functional components of a product interact in standardized, specified ways, such that they allow for the substitution of components without requiring changes to the design of other components (Sanchez 1999). A modular product design ensures flexibility in product modifications (Zhang, Zhao, and Qi 2014), so this product attribute should affect the coordination problem during customization (Srikanth and Puranam 2014). Because this form of coordination also relies on the supplier's capability to accommodate the specific needs of the customer, we consider project team technological capability, or the project team's ability to develop technological competencies and processes that enable it to transform innovative ideas into new products (Dutta, Narasimhan, and Rajiv 1999).
Second, interactions or relationships between the two firms in the customization process may affect coordination efforts to determine the scope and specific form of adaptation. Customer participation, or the extent to which a customer engages directly in the supplier's customization activities, facilitates customer-oriented product development activities (Carbonell, Rodríguez‐Escudero, and Pujari 2009; Fang 2008) in that it entails intensive interactions and thus can affect the benefits of customization. At the same time, an existing relationship between a buyer and a seller can help them develop mutual understanding and routines, which in turn allow for more effective coordination (Gulati 1995; Hoang and Rothaermel 2005). Relational embeddedness is the extent to which relationships among firms are reciprocal and close (Rindfleisch and Moorman 2001).
Third, poorly defined customer demands create a significant hurdle to coordinated efforts for effective customization (Franke, Keinz, and Steger 2009). Customer demand ambiguity refers to the extent to which the customer lacks an accurate assessment of its own product attribute needs (Franke, Keinz, and Steger 2009; Kramer 2007). This can be due to customers’ lack of knowledge about the product category or rapid technological changes, factors that make it difficult for customers to describe their needs as specific product attribute demands (Ghosh, Dutta, and Stremersch 2006).
Effects of Customization on the Supplier's Project Revenues and Costs
A higher level of customization can increase the value offered to individual customers by better solving the specific problems that any particular customer faces (Tuli, Kohli, and Bharadwaj 2007), which in turn generates more sales revenue for the supplier. Through customization, the supplier better defines its offerings to match its customers’ specific needs. Unlike standard product offerings, customization requires the two firms to share product and demand information so they can arrive at optimal product offerings tailored to the customer's needs (Simonson 2005). Thus, customization reflects a supplier's coordination efforts with its customer to leverage their respective capabilities.
Customized solutions also may entail coordinated efforts and further investments, such as new solutions or adaptations of standard products (Hallén, Johanson, and Seyed-Mohamed 1991). For example, to satisfy unique customer requirements, Toyota reconfigured its organizational systems to pursue continuous improvement (Pine and Victor 1993). When it involves coordinated information sharing and partner-specific investments, customization enables suppliers to design product features that better fit their customers’ preferences. The improved fit also increases the expected benefits of customization to the customer and, thus, the price the customer is willing to pay, leading to greater revenue for the supplier.
However, if we conceive of customization as a coordination problem, it must also invoke costs. First, the process is complex because of the need for intensive interactions with individual customers (Simonson 2005). A customized project demands more setup costs before being initiated, including efforts to determine the project scope or product attributes to be customized, the role of each party, and the criteria for evaluating outputs (Piller, Moeslein, and Stotko 2004). Customization also increases organizational complexity, in that it requires cross-functional coordination to integrate the different resources and capabilities (e.g., hardware, software, services) necessary to develop customized solutions (Zhang, Zhao, and Qi 2014). Second, the investment required to implement customized solutions can make it difficult to achieve economies of scale, such that the unit cost of each offering is higher (Piller, Moeslein, and Stotko 2004). The supplier's sales activities then are less cost efficient by definition. Because a higher level of customization incurs higher costs, we propose a baseline hypothesis regarding the inherent tension between supplier revenues and customization costs arising from customization. H1: For the supplier, customization (a) increases project revenues and (b) increases project costs.
Moderating Effects of Unilateral Coordination Mechanisms
Product modularity
Modular products provide flexibility that allows for product adaptation and can meet the specific needs of individual customers (Sanchez and Mahoney 1996). Integrative, nonmodular products instead increase the complexity of and uncertainty about customization because changes to any one part create a need for further changes in other parts. Because modular products support “mixing and matching” of the components, they can result in a wide range of product variations on a single, existing platform, with less uncertainty (Ghosh, Dutta, and Stremersch 2006; Sanchez 1999). The supplier has more product options available to respond to a customer's specific needs, such that the coordination effort required to align the supplier's products and the customer's needs becomes more efficient. Tu et al. (2004) thus show that modular product design improves the supplier's capability for customization. Furthermore, modular products enable the supplier to apply common parts across its product range, reducing the investments required to make changes to existing products (Sanchez 1999). Thus, the supplier can achieve economies of scale while still serving specific customer needs. Because modular products increase the value of customization through increased product variety while also mitigating the costs of customization, we predict the following: H2: When product modularity is higher, customization has (a) a more positive effect on the supplier's project revenues and (b) a less positive effect on the supplier's project costs.
Project team technological capability
A project team with greater technological capabilities will be more effective in coordinating with customers because the team can identify and interpret customers’ needs accurately and incorporate them explicitly into product specifications (Cohen and Levinthal 1990). A team with greater technological capability also can implement innovative solutions more readily (Dutta, Narasimhan, and Rajiv 1999), which likely helps the supplier accommodate customers’ specific needs. These elements in turn should increase the revenue generated through customization.
Although building technological capability requires additional investments over time, a project team with this capability can coordinate and invest in customization efficiently, with less trial and error, as well as reduce coordination complexity with individual customers during the customization process (Xiong and Bharadwaj 2011). Building on its technological capability, the project team also can invest more efficiently in designing customized solutions. Thus, H3: When project team technological capability is higher, customization has (a) a more positive effect on the supplier's project revenues and (b) a less positive effect on the supplier's project costs.
The Moderating Effect of Bilateral Coordination Mechanisms
Customer participation
Coordination requires the active participation of the customer. A more involved customer makes the customization process more effective, in terms of ensuring fit between the supplier's products and the customer's needs (Duray et al. 2000; Franke, Keinz, and Steger 2009). Through their active participation, customers directly define and adapt products to meet their specific needs; they also provide the supplier with privileged access to downstream information and resources, which can facilitate the invention of new solutions (Klein 2007; Uzzi 1997). Tuli, Bharadwaj, and Kohli (2010) argue that connections between the supplier and the customer boost information sharing, which helps the supplier acquire valuable information about customer needs. By facilitating coordination, customer participation enables the supplier to customize its products better, which should increase the value of project customization for the customer and improve the supplier's sales performance in turn (Carbonell, Rodríguez‐Escudero, and Pujari 2009).
Customer participation also may make interactions more efficient, such that the costs decrease. There might be some additional costs of customer participation, because it requires more interactions, but the supplier can avoid costs associated with miscommunication by involving customers directly in the customization process. Furthermore, investments might be more efficient by targeting the precise needs of individual customers who participate. Therefore, H4: With greater customer participation, customization has (a) a more positive effect on the supplier's project revenues and (b) a less positive effect on the supplier's project costs.
Relational embeddedness
Relational embeddedness entails trust, overlapping identities, and closeness resulting from lasting, durable relationships (Nahapiet and Ghoshal 1998). It reflects the quality of social relations and determines firms’ willingness to share their resources and capabilities with partners (Moran 2005). For example, prior research has examined various aspects of relational embeddedness, such as the concentration of transactions (Uzzi 1997), the duration or repetition of relationships (Fischer and Pollock 2004; Kraatz 1998), and the types of relationships that require resource commitment (Rowley, Behrens, and Krackhardt 2000). Embedded relationships can act as coordination mechanisms that facilitate robust, collective actions between the project team and the customer by aligning their motivations. In particular, when the project team and customer are closer, they likely are more cooperative in terms of sharing information to define a specific form of customization (Tu et al. 2004), and they commit more resources to implementing the customized solution. These embedded relations reduce the uncertainty surrounding the exchange as well by facilitating exchange-inducing norms and sanctions against partners’ opportunistic behaviors (Coleman 1990; Moran 2005). Thus, embedded relations improve the customization process, which increases the value of customized offers and produces more revenues from customization. The project team also can minimize some of the costs of customization, such as the time and resources they need to devote to developing background knowledge about the customer and its specific needs. H5: When relational embeddedness is higher, customization has (a) a more positive effect on the supplier's project revenues and (b) a less positive effect on the supplier's project costs.
Customer Demand Ambiguity Worsens the Coordination Problem
The value of customized offers depends on the extent to which the customer can define its needs accurately (Franke, Keinz, and Steger 2009). Extant research has suggested that accurate customer input is vital for effective customer-oriented marketing activities (Fang, Palmatier, and Evans 2008; Lee, Naylor, and Chen 2011). Product modifications face a greater risk of losing their direction or relevance during customization in the presence of high demand ambiguity. For example, Huffman and Kahn (1998) show that customization based on poorly defined demands can cause customer confusion and diminish the overall value. Thus, customer value and the revenue created from adaptation is limited to the extent that the customer's demand can be clearly defined.
Demand ambiguity also increases the cost of customization to the supplier. Ambiguous needs are likely tacit and difficult to transfer, so customization requires more interactions with the customer to clarify the ambiguous demand and to transfer this information from the customer to the supplier (Hansen 1999). Ambiguous demands also make an investment in customization less efficient because the customer's requirements likely change as the customization materializes. Customers with unclear demands may construct more specific or altered demands along the way, such that the customization process becomes increasingly complicated and costly (Simonson 2005; Slovic 1995). Offering more customized solutions thus may be more expensive when customer demand is ambiguous. H6: When customer demand ambiguity is higher, customization has (a) a less positive effect on the supplier's project revenues and (b) a more positive effect on the supplier's project costs.
Method
Research Setting
We test our hypotheses with dyadic data collected from one of the largest enterprise resource planning (ERP) software suppliers in China and its business customers. Because ERP software supports various operational activities—such as planning, purchasing, financing, human resources, marketing, and customer services—this context provides some important advantages for testing our hypotheses. First, ERP software sales and deployment typically involve varying customization levels (Dittrich, Vaucouleur, and Giff 2009). In interviews with managers, we confirmed that customized products were key features of the firm's product offerings. Even if the core function of the software remains unchanged, the unique needs of the supplier's business customers prompts it to adopt different levels of customization involving various product components, implementation methods, software upgrades, and maintenance contracts to help customers integrate various business operations, including supply chain planning, purchasing, manufacturing, sales and marketing, distribution, accounting, and customer service.
Second, project-based customization to implement the enterprise software provides an ideal context for testing project-level outcomes (Shanks 2000), such as project revenues and costs. The focal supplier has a dedicated project team and manager for each B2B customer, and the project team manager determines the level of customization, through interactions with the customer. Some customers choose the precise specifications of the system and contract with the supplier for their supply, with little customization. In other cases, the supplier teams work proactively with customers to develop software specifications or design products that fulfill particular functional criteria.
Third, B2B customers in various industries use ERP software products widely. The customers in our data set thus represent various industries, including information technology, manufacturing, construction, real estate, telecommunication, and hotels. Our test of customization involves business practices that occur across diverse industries.
Fourth, the supplier's products feature various components, assembled in different ways to fit customers’ needs. Depending on the components, different products exhibit distinct levels of modularity. Furthermore, the different teams contain members with varying expertise, so each team has unique technical capabilities. These features should ensure sufficient variation in the constructs of this study.
Fifth, depending on the level of customization, the customer and supplier agree ex ante about the minimum price a customer will pay and contractually specify any contingencies, such as more development time, greater investments in the features required by the customer, or more training sessions, that might invoke additional payments.
Data Collection
We collected dyadic survey data from both customers and suppliers, as well as objective revenue and cost data from the supplier. The supplier reasonably should have more information about project characteristics, such as costs and revenues, customization, product modularity, and project team technological capabilities. In contrast, the customer should be more knowledgeable about its own demand, environment, and relationship with the supplier. The survey respondents represented diverse teams and possessed sufficient knowledge to answer the survey questions. To ensure that these key informants were qualified to respond to the questionnaire on behalf of their respective firms, we also included questions about the extent to which they were knowledgeable about the customization project, using a seven-point Likert scale. The mean values were 5.75 (SD = .69) for buyers and 6.09 (SD = .39) for the supplier.
Business customers
We started the data collection with the customers. Using the complete customer list provided by the software supplier, we randomly selected 500 B2B customers, to avoid any sampling bias that might arise if the supplier chose customers (e.g., bias toward the most important or successful projects). Ghosh, Dutta, and Stremersch (2006) suggest that customers should be end users of software products, not resellers or distributors that sell standard products to mass customers without customization. In addition, we required that the supplier team deal directly with the customer, without any third-party agent (e.g., project consultants, system integrators), because direct B2B interactions are less likely in the presence of a third-party agent.
We e-mailed the survey to the customers, then reminded them about it in telephone calls one week later. The unit of analysis refers to the project level, so we asked respondents to identify the most recently completed project involving a purchase from the focal software provider. The informants in the customer firms were senior executives directly responsible for the software implementation. We offered a 100 RMB (US$15) telephone bill credit for each respondent as an incentive. Within two months, we received 197 customer responses (after dropping 3 responses for which the informant scored lower than four on a seven-point Likert scale measuring knowledge about the customization project); of these, 18 contained too much missing data and were discarded, leaving 179 valid responses (effective response rate of 36.2%).
Among the 179 responses, 100 came from state-owned firms, in which the government owns more than 50% of shares (55.25%), and the rest were private firms. In terms of size, the firms employed approximately 1,200 people on average, and their average contract value was 2 million RMB (approximately US$40 million). Nine firms represented the information technology industry (4.97%), 68 were manufacturers (38.12%), 31 firms were in the construction or real estate industries (17.8%), 37 firms came from telecommunications (20.67%), and 20 firms were in other industries (11.17%). To check for nonresponse bias, we compared firm size, project contract value, project duration, and industry (manufacturing or nonmanufacturing) between the responding and nonresponding firms. None of the t-statistics for these comparisons was significant, suggesting that response bias was not a threat in our sample.
Suppliers
In the questionnaire distributed to customers, we asked them to provide contact information for a team manager they knew from the supplier firm. Then we distributed 179 supplier questionnaires, referring to the specific project chosen by the customer. We first contacted the team manager by telephone or in person, then sent the survey by e-mail. One week later, we made telephone calls to remind these respondents of the survey. We received 136 questionnaires; we dropped 2 responses that scored lower than four on the seven-point Likert scale of respondents’ knowledge about the customization project. The 134 valid responses from suppliers represented an effective response rate of 75.1%. Ultimately, we had 134 matched supplier–customer dyads for our analyses.
Measurement
We developed the questionnaires using Churchill's (1979) and Gerbing and Anderson's (1988) recommended procedures. Initially, we conducted several interviews with executives from the supplier teams and their business customers. These early interviews, which lasted approximately ten hours in total, helped us develop the measurement scales and were instrumental in our attempts to craft the pretest survey. On the basis of these interviews and an extensive review of previous studies, we developed preliminary versions of the questionnaires. When possible, we adapted the existing scale items to our context. We initially developed the questionnaire in English, translated it into Chinese, and then back-translated it into English. This procedure ensured that the English and Chinese versions contained identical measures. We pretested the questionnaires with a sample of 16 pairs of supplier teams and business customers to verify the appropriateness of the terminology used and the clarity of the instructions. These results indicated that the survey instrument was generally sound, though we modified a few items for clarity. We provide the measurement items in Appendices A and B.
Project revenue and cost
The project revenue and cost data came from the supplier's archival records. This supplier keeps detailed records of the revenues and costs generated by each project. The costs derive from design, development, delivery, after-sales service, and other administrative activities. For parsimony, we only included direct costs during the contract period, such as materials and labor dedicated to product development, sales, and after-sales service. Labor costs reflect compensation paid to developers, salespeople, and after-sales service representatives for the length of the contract. Customization requires more labor inputs to coordinate customization, make product adaptations according to the customer's specific needs, or provide additional training on customized features for the customer's employees. Although relatively minimal for software, some customization projects encounter material costs too (e.g., personal computers, servers). We did not include indirect costs, such as when customized projects use components developed for prior customization projects, because it is very difficult (if not impossible) to track such indirect costs accurately. Other costs also might accrue after the contract expires, such as additional service requests from the customer, but it would be difficult to determine whether such service requests were due to customization or other factors. To avoid ambiguity, we focused on direct costs during the contract period. Both revenue and cost data are skewed, so we took the log transformation; after the transformation, both variables were normally distributed.
Project customization
We obtained measures of project customization from the supplier teams. We used a three-item, seven-point Likert scale to measure the extent to which each supplier team delivered standardized versus customized software to customers. We adapted this measure from Homburg, Müller, and Klarmann (2011). The coefficient alpha was .76.
Customer participation and customer demand ambiguity
We obtained measures of customer participation from the customer side. We used a four-item, seven-point Likert scale, based on Fang (2008), to measure the extent to which the customers were involved in the software development and delivery process on a limited versus extensive basis. The coefficient alpha was .801. For customer demand ambiguity, we developed a four-item, seven-point Likert scale to measure the extent to which the customers were clear about their demands for the software when purchasing it from the supplier. The coefficient alpha was .77.
Product modularity and project team technological capability
We obtained both these measures from the supplier teams. For product modularity, we followed Tu et al. (2004) and used a five-item, seven-point Likert scale to measure the extent to which the software could be easily decomposed into separate modules. The coefficient alpha was .80. For project team technological capability, we obtained the measure from the supplier teams and developed a four-item, seven-point Likert scale to measure how knowledgeable the supplier teams were about the development and delivery of the software. The coefficient alpha was .77.
Relational embeddedness
Relational embeddedness measures the degree of closeness between customers and the supplier (Uzzi 1997); we used a four-item, seven-point Likert scale adapted from Fang (2008). The coefficient alpha was .77.
Control Variables
We included several control variables that could affect project revenues and costs. At the project level, we controlled for project duration, measured as the number of months from the start to the end of the project, which reflects the amount of time devoted to customization. We also controlled for project type and complexity. For project type, we used a series of dummy variables (project type_1 = 1 if the project involves customer relationship management, project type_2 = 1 if it involves financial planning, and project type_3 = 1 if it involves production and order planning; 0 if not in each case). Project complexity captures the extent to which the development project entails complicated processes and technical knowledge, with measures adapted from Fang (2008). We also controlled for customer type (i.e., state-owned vs. private customers) because employees of state-owned firms have different incentives and objectives. We defined firms as state-owned if the government owned more than 50% of their shares.
At the relationship level, a firm's dependence on a partner can affect its bargaining power and ability to retrieve more revenues or projects from the relationship (Heide and John 1988). We included supplier dependence on customers, obtained from the supplier, and customer dependence on the supplier, obtained from customers (Fang, Palmatier, and Evans 2008). Furthermore, we controlled for the number of prior projects the supplier had undertaken with each specific customer, which might affect the level of customization or customization efficiency because firms grow to understand each other and develop routines for effective interactions through their past relationship experience (Anand and Khanna 2000).
At the industry level, we controlled for industry dynamism, or the degree of change and unpredictability in the market environment, with four items from Jaworski and Kohli (1993). A dynamic environment can induce additional costs by increasing the uncertainty associated with rapid, unexpected changes in the market (Teece 2007). Finally, we controlled for customer size, measured as the log of the number of employees of the customer firms.
Assessment of Measurement Models
We estimated two separate measurement models with the data sets from the supplier and customers, respectively. We restricted each scale item's loading to its a priori specified factor and allowed for correlations among factors. The fit indices for each model were good. Specifically, for the measurement model from the suppliers, we obtained χ2 = 68.13 (p > .10), comparative fit index (CFI) = .93, normed fit index (NFI) = .92, and root mean square error of approximation (RMSEA) = .04. The values for the measurement model with the customers were χ2 = 201.49 (p > .10), CFI = .92, NFI = .91, and RMSEA = .05. All factor loadings were positive and significant (p < .01), and the composite reliabilities were greater than .70 (see Appendices A and B). The average variance extracted by each construct was greater than the square of the latent correlation between it and all other constructs in the measurement model (Fornell and Larcker 1981). We conducted pairwise chi-square difference tests for each pair of constructs in the overall model (Bagozzi, Yi, and Phillips 1991) to test for discriminant validity, which exists if the unconstrained model demonstrates significantly better fit than a constrained model in which we constrain the correlation between those constructs to 1 (Δχ2 significant at p < .01). These analyses suggest discriminant validity among the constructs. We summarize the descriptive statistics and correlations in Table 2.
Means, Standard Deviations, and Correlations of Variables
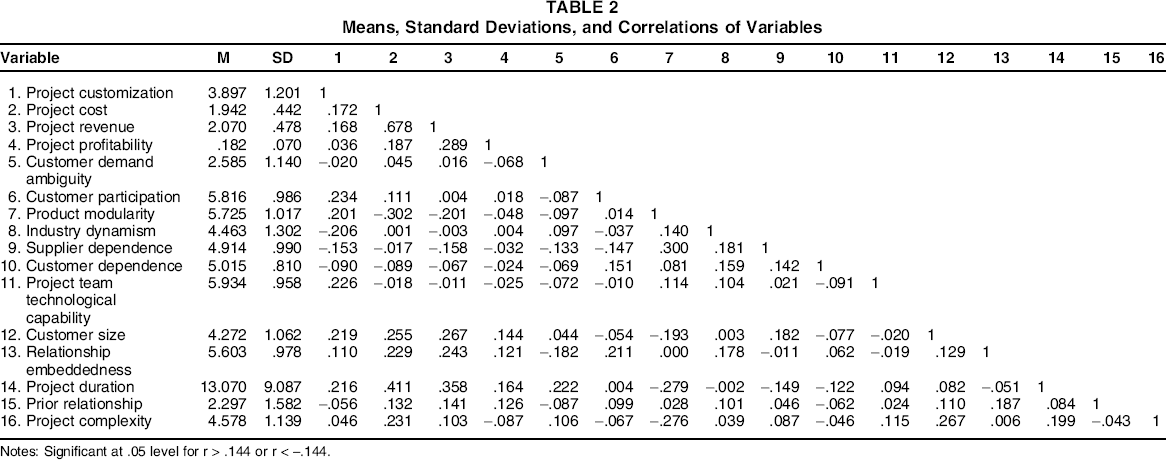
Notes: Significant at .05 level for r > .144 or r < -.144.
Model Estimation
Model Setup
We estimated two models using seemingly unrelated regressions to control for other unobserved factors that could affect the revenue and cost simultaneously (Fang 2008):


Self-Selection Correction
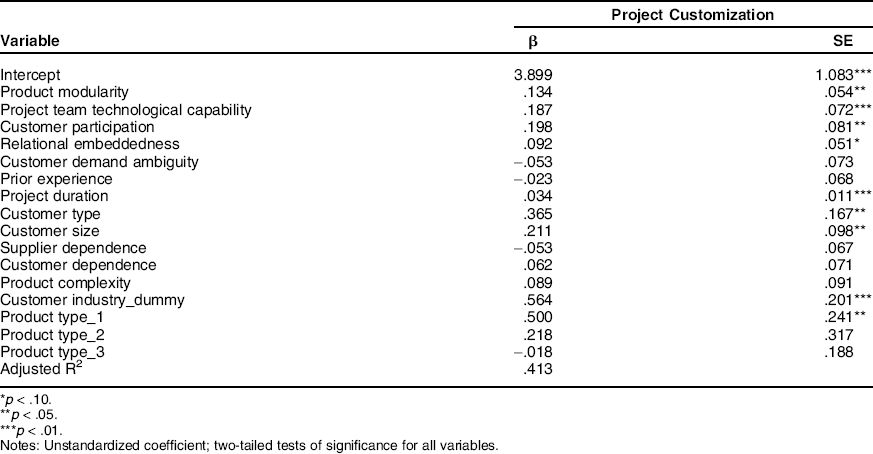
When estimating the two models, we addressed the potential for endogeneity; factors not included as covariates in Equations 1 and 2 but that appear in the error term could influence the level of customization. For example, the supplier team's unobserved, personal preferences about customization might affect the level of customization. The failure to address the influence of such unobserved factors could bias the estimation results from Equations 1 and 2. We therefore applied the control function approach (Petrin and Train 2010; Sridhar and Srinivasan 2012), for which the basic logic is that we include a new control variable in the choice regression equation (Equation 3). After accounting for the influence of the control variable on customization as a dependent variable in the choice regression equation, customization as an independent variable no longer correlates with the error term in the performance regression equation (Equations 1 and 2). Adding the control variable to the regression equation enables us to establish the independence assumption between project customization and the error term. Specifically, after accounting for its influence on project revenues and costs (dependent variables), project customization as the independent variable does not correlate with the error term (Sridhar and Srinivasan 2012).
Using Petrin and Train's (2010) approach, for each endogenous variable, we performed an estimation using as a covariate at least one exogenous (excluded) variable that affects the endogenous variable (project customization) but is not related to either project revenues or costs. The predicted residual provides effective control variables to address endogeneity concerns. We used customer industry_dummy (=1 for manufacturing, =0 for services), because customization generally is greater in service than manufacturing industries, due to their experiential nature (Gwinner et al. 2005). We found no evidence that project costs, revenues, or profitability differed systematically across these two industry groups. In addition, we included all independent variables in Equations 1 and 2 as control variables, because customer demand ambiguity, customer participation, product modularity, project team technological capability, and relational embeddedness could affect the decision to adopt different project customization levels. Thus,

After estimating this model (see Appendix C), we put the predicted residuals in the performance equations (Equations 1 and 2) to control for self-selection concerns.
Results
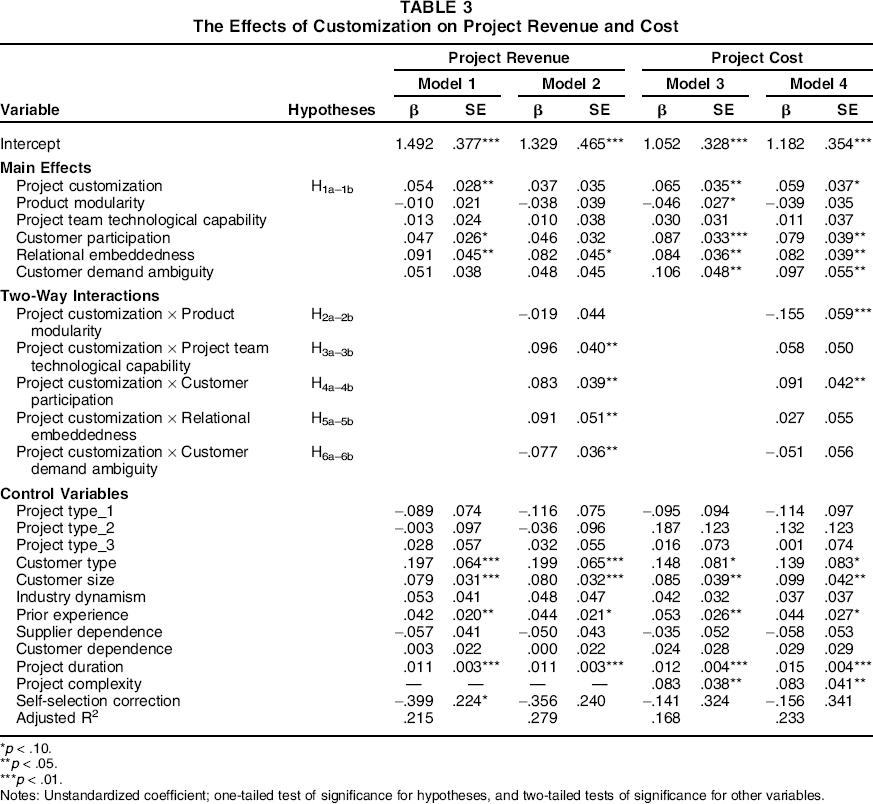
Table 3 presents the results of our empirical analysis. Regarding the main effects, Model 1 indicates that customization increases project revenues (β = .054, p < .05), and Model 3 indicates that it also increases project costs (β = .065, p < .05). These findings provide support for H1 and confirm the tension between the revenues and costs of customization.
The Effects of Customization on Project Revenue and Cost
p < .10.
p < .05.
p < .01.
Notes: Unstandardized coefficient; one-tailed test of significance for hypotheses, and two-tailed tests of significance for other variables.
In terms of the moderating effects of unilateral coordination mechanisms, we find in Models 2 and 4 that product modularity decreases project costs resulting from customization (β = –.155, p < .01), in support of H2b, but it has no significant effect on project revenues resulting from customization (β = –.019, n.s.). Low product modularity makes customization less efficient and increases customization costs. Furthermore, project team technological capability increases project revenues due to customization (β = .096, p < .05), with no significant effect on project costs (β = .058, n.s.). Consistent with H3a, technological capability is a coordination mechanism that can facilitate the benefits of customization.
For the moderating effect of bilateral coordination mechanisms, customer participation increases both project revenues and costs due to customization (β = .083, p < .05; β = .091, p < .05, respectively), such that it further heightens the focal tension. Although customer participation can enhance the project revenues associated with customization, in support of H4a, it also is accompanied by higher costs to accommodate the specific needs of actively engaged customers. We find that relational embeddedness increases project revenues resulting from customization (β = .091, p < .05) but has no significant effect on project costs (β = .027, n.s.). Consistent with H5a, these findings confirm the role of relational embeddedness in relieving coordination problems associated with customization and improving project revenues.
Finally, Models 2 and 4 indicate that customer demand ambiguity decreases project revenues resulting from customization (β = –.077, p < .05), but it has no significant effect on project costs (β = –.051, n.s.). In support of H6a, customization is less effective for sales in the presence of high demand ambiguity.
Robustness Analyses
To enhance confidence in our results, we conducted two robustness tests to evaluate the results: (1) including a squared term of customer participation to assess its possible curvilinear moderating effect on the customization–outcome relationships and (2) using an alternative measure of customer participation from the supplier side (i.e., supplier's perception of customer participation). None of the squared effects on revenues or costs was significant. In addition, the measure based on supplier perceptions of customer participation yielded results consistent with those in Table 3.
Additional Analyses
Impact on Profitability
Noting the tension between revenues and costs of customization, we conducted an additional analysis with profitability as the dependent variable to identify scenarios that led to the greatest or least profitability. After obtaining project revenue and cost information, we took the difference and divided it by project revenues to obtain a measure of project profitability. The results indicate no significant effect of customization on project profitability (β = .003, n.s.), as detailed in Table 4, Model 5. Model 6 shows that customer demand ambiguity decreases project profitability resulting from customization (β = −.033, p < .01), whereas project modularity and relational embeddedness increase it (β = .019, p < .05; β = .017, p < .10, respectively). These findings are consistent with the main findings for project revenues and costs in Table 3. Using these results, we conducted a scenario analysis to find alignments among the various moderating factors that induce the greatest and least profitability.
The Effects of Customization on Project Profitability

p < .10.
p < .05.
p < .01.
Notes: Unstandardized coefficient; two-tailed tests of significance for all variables.
We developed 32 scenarios with varying combinations of high and low levels of customer demand ambiguity, customer participation, product modularity, project team technological capability, and relational embeddedness. The high conditions were one standard deviation above the mean values; the low conditions were one standard deviation below them. Low customer demand ambiguity and high customer participation from the customer side, aligned with both high product modularity and high project team technological capability from the supplier side and high relational embeddedness (i.e., high coordination), led to the greatest profitability (around 26%)—approximately 8 percentage points higher than the profitability of an average project in our sample (around 18%). High customer demand ambiguity and low customer participation, aligned with low product modularity, low project team technological capability, and low relational embeddedness (i.e., low coordination), instead produced the lowest profitability (14%)—about 4 percentage points lower than the average project in our sample.
Tension Associated with Customer Participation
Although customer participation is an important part of customization, it appears to worsen the tension between project revenues and costs by increasing both of them. Therefore, we examined the potential moderating role of other coordination mechanisms (i.e., product modularity, project team technological capability, and relational embeddedness) and customer demand ambiguity with regard to the revenue–cost tension induced by customer participation in project customization. Empirically, we included relevant three-way interactions of customization and customer participation with other moderators in both the revenue and cost models. Table 5 presents the results.
Three-Way Interactions with Customer Participation

p < .10.
p < .05.
p < .01.
Notes: Unstandardized coefficient; two-tailed tests of significance for three-way interactions.
As Model 7 shows, we found no significant three-way interactions that affected project revenues, though the two-way interactions (cf. product modularity) were significant. In contrast, Model 8 shows that three-way interactions influenced project costs, except for project team technological capability. Thus, the paths through which coordination mechanisms affect project revenues versus costs differ: customer demand ambiguity and relational embeddedness directly moderate project revenues resulting from customization, but they affect project costs indirectly by moderating the customization–customer participation interactions.
The significant effects of these three-way interactions on project costs might arise because with greater customer demand ambiguity, customer participation increases the risks of cost increases due to customization. Coordination with an actively participating customer is more difficult when that customer's demand is unclear. Such a customer creates a strong risk of leading the customization process in the wrong direction, ultimately resulting in higher coordination costs for the supplier (Anderson, Chu, and Weitz 1987). In contrast, with less customer demand ambiguity, customer participation can facilitate the process of customization by guiding its direction (Weiss and Heide 1993), which should reduce project costs resulting from high customer participation during customization.
Relational embeddedness can serve as a governance mechanism for interfirm collaboration (Gulati 1995; Moran 2005) and also improve interactions with customers in customization projects. Mutual understanding and cooperative routines in embedded relationships (Tu et al. 2004; Uzzi 1997) help reduce coordination problems in interactions with actively participating customers and thus reduce project costs. Similarly, modular products provide more flexibility to coordinate with actively participating customers more efficiently during customization.
Using a simple-slope analysis with the results of the three-way interaction, we illustrate the effects of customization on project costs when customer participation is high (Aiken and West 1991). The high and low levels of the moderators represent one standard deviation above and below the mean, respectively. As we illustrate in Figure 2, customization leads to more project costs with high levels of customer participation, but in some scenarios, this effect is smaller or even insignificant. Specifically, customization with high customer participation does not lead to cost increases if customer demand ambiguity is low (β = .058, n.s.) or relational embeddedness is high (β = .019, n.s.). In other words, clearly defined customer demand or close relationships between the project team and its customer can resolve the tension between project revenues and costs caused by customer participation in project customization. Similarly, high product modularity, compared with low levels, can reduce cost increases as a result of customization with high customer participation (β = .067, p < .10 vs. β = .118, p < .05, respectively).
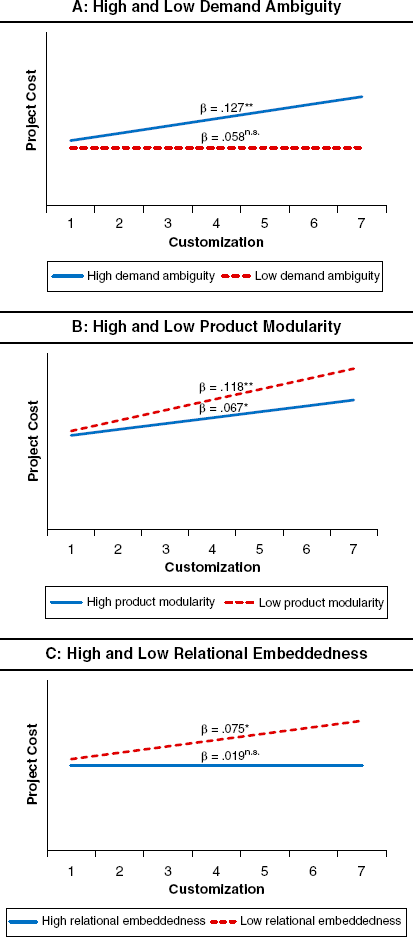
Effect of Customization on Cost Under High Customer Participation
Discussion
This study investigates customization as a key marketing practice in B2B markets. Previous empirical research on customization has focused primarily on the customer side; we provide important implications for the supplier. In particular, we clarify the challenges that suppliers face when offering customized solutions to business customers and present conditions that can help them overcome these challenges and thereby gain positive returns from their investments in customization. The findings have both theoretical and managerial implications.
Theoretical Implications
Prior customization research has highlighted the challenges to customers associated with customized products, such as confusion or difficulties defining their preferences ex ante (Dellaert and Stremersch 2005; Franke, Keinz, and Steger 2009). However, we present unique challenges that suppliers confront with their customization efforts. We identify the tension that arises between project revenues and costs when suppliers implement customized solutions for individual customers. Although customization fosters more sales opportunities by better serving individual customers’ needs, it also comes at a significant cost, associated with the complexity of coordination and the loss of economies of scale due to customer-specific investments (Homburg, Müller, and Klarmann 2011; Simonson 2005). The presence of this tension makes the benefits of customization indeterminate; our contingency model contributes to prior customization research in marketing and operations management by offering a theoretical basis for identifying methods to cope with the tension.
Specifically, clearly defined customer demands, project team technological capability, and relational embeddedness enable suppliers to improve the sales revenues they earn from customization projects, with little additional cost. Modular products also help reduce the costs of customization, though they do not directly increase project revenues. Customization projects that meet these conditions enhance the supplier firm's profitability; those that fail to do so induce greater costs, with little contribution to project revenues. With this foundation, it is possible to evaluate the value of customization to suppliers by considering not just the tension between revenues and costs but also the moderating factors that can intensify or help relieve this tension.
We contribute to literature on interfirm relationship coordination by regarding customization as a coordination problem and identifying factors to relieve it. Prior research has examined various types of coordination, including information sharing, resource integration, joint development, or governance structures (e.g., Fang 2008; Grewal, Chakravarty, and Saini 2010; Kumar, Heide, and Wathne 2011; Lee, Hoetker, and Qualls 2015). Our study advances understanding of coordination in a customization project and thereby sheds light on specific attributes related to the customer (demand ambiguity and participation), supplier (product modularity and technological capability), and their relationship (relational embeddedness) as mechanisms for relieving or worsening the coordination difficulty associated with customization.
The findings also inform the customer participation literature. Customer participation is a double-edged sword that can increase both costs and revenues. Prior research has emphasized the value of customer inputs for developing and implementing marketing activities more effectively (e.g., new product development, new market entries) and coping with environmental uncertainty (Fabrizio and Thomas 2012; Fang 2008; Griffin and Hauser 1993). We further explicate a dilemma that firms face when they involve their customers in developing customized solutions. Even though customer participation is vital for generating sales opportunities by facilitating access to downstream information and the transfer of tacit market knowledge (Fang, Lee, and Yang 2015), it also creates significant costs for the supplier, intensifying the customization tension between project revenues and costs. Our supplementary analyses suggest some boundary conditions that can relieve this tension by mitigating the project cost increases associated with customer participation. Clearly defined customer demand, modular product designs, and embedded relationships can help the supplier coordinate with active customers in customization projects.
Finally, our findings complement prior research from the customer side; together, they provide a more comprehensive understanding of customization as a dyadic process. The difficulties the customer faces with regard to customized products also become challenges for the supplier. Specifically, customer demand ambiguity, which can lead to customer confusion (Franke, Keinz, and Steger 2009), is a hurdle to the supplier, in that it increases project costs without contributing to project revenues. In this sense, our study extends previous findings from the customer side and derives implications for suppliers. We show that the challenges customers face when coordinating to develop customized products have direct impacts on the supplier, in terms of both project revenues and costs. This study accordingly enhances understanding of the dynamics between the supplier and the customer during customization projects.
Managerial Implications
Customization is an important practice for implementing customer-oriented marketing, and the findings of this study provide new insights into when firms should use customization to serve their business customers, as well as how to manage it. Broadly, suppliers should pay close attention to project revenues and costs when developing and implementing customized solutions. More specifically, when firms offer customization to customers, they need to identify and implement mechanisms to coordinate it, such as low customer demand ambiguity, high product modularity, project team technological capability, and relational embeddedness.
In addition, suppliers should pay special attention to the dilemma that customer participation creates, increasing both project revenues and costs, as well as the boundary conditions that can enable firms to benefit from customer participation. Our findings suggest that customer participation is viable only when customer demands are clearly defined, products have modular designs, or the project team and customer already have a close relationship. Our scenario analysis provides even more specific guidance by simulating the profitability of customization in various conditions. Suppliers can increase the potential value by offering customization to actively participating customers with clearly defined demand, in a modular product design, with high technological capability, and with high relational embeddedness.
Limitations and Further Research
This study is subject to several limitations that suggest directions for research. First, we focused on customization projects in the software industry, though the B2B customers represent various industries. This specific context helped us test our conceptual arguments, and it is an ideal research setting because of the popular use of customization for software products. Still, further research in different industrial contexts would provide more generalizable insights into the pertinent revenues and costs. We also recognize the need for research that examines diverse suppliers, to reduce the common factors that may exist across projects by a single supplier. Along similar lines, the revenue and cost of customization likely depend on the contract type, which defines how costs are paid. We did not test for any implications of contact type, because the single supplier used the same type of contract for all the customers in our sample. Additional research that explicitly investigates various contract types, such as fixed-price or cost-based versions (Corbett, Zhou, and Tang 2004), could provide further insights into customization decisions and outcomes.
Second, we found a limited role of product modularity, without any significant impact on project revenue. Nor did it interact with customer participation to produce more revenue or reduce costs. However, the flexibility of modular product designs in serving diverse customer needs (Sanchez 1999) suggests the need for more research that investigates product modularity from varied perspectives. For example, researchers might identify boundary conditions for the benefits of product modularity in developing customized solutions. Other studies could examine product characteristics (e.g., complexity) or industry environments (e.g., stage in the product life cycle, dynamism, growth). More complex products, fast-growing industries, or competitive market environments might require more flexibility to implement customized solutions, such that they would benefit more from modular product designs.
Third, we focused on direct costs during the contract period to avoid measurement ambiguity or inconsistency. Further research might test a more comprehensive set of cost components, such as after-sales service or administrative costs, in the postcontract period.
Fourth and finally, prior research has examined the customer side of customization, whereas we focus on the supplier side. It also would be worthwhile to test a model that integrates both approaches. As a dyadic process between the supplier and the customer, customization could have interrelated effects on each party. Therefore, we suggest research that evaluates the outcomes for both supplier and customer, to gain further insights into customization.
Footnotes
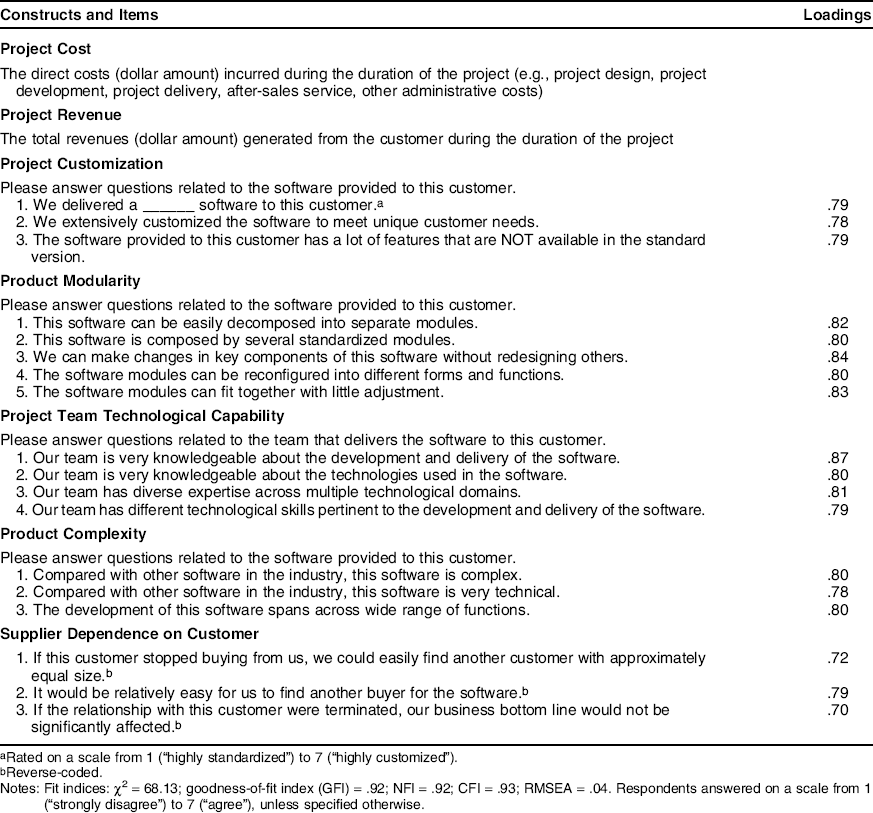
Scale Items from Supplier
| Constructs and Items | Loadings |
|---|---|
|
|
|
| The direct costs (dollar amount) incurred during the duration of the project (e.g., project design, project development, project delivery, after-sales service, other administrative costs) | |
|
|
|
| The total revenues (dollar amount) generated from the customer during the duration of the project | |
|
|
|
| Please answer questions related to the software provided to this customer. | |
| 1. We delivered a _____ software to this customer. a | .79 |
| 2. We extensively customized the software to meet unique customer needs. | .78 |
| 3. The software provided to this customer has a lot of features that are NOT available in the standard version. | .79 |
|
|
|
| Please answer questions related to the software provided to this customer. | |
| 1. This software can be easily decomposed into separate modules. | .82 |
| 2. This software is composed by several standardized modules. | .80 |
| 3. We can make changes in key components of this software without redesigning others. | .84 |
| 4. The software modules can be reconfigured into different forms and functions. | .80 |
| 5. The software modules can fit together with little adjustment. | .83 |
|
|
|
| Please answer questions related to the team that delivers the software to this customer. | |
| 1. Our team is very knowledgeable about the development and delivery of the software. | .87 |
| 2. Our team is very knowledgeable about the technologies used in the software. | .80 |
| 3. Our team has diverse expertise across multiple technological domains. | .81 |
| 4. Our team has different technological skills pertinent to the development and delivery of the software. | .79 |
|
|
|
| Please answer questions related to the software provided to this customer. | |
| 1. Compared with other software in the industry, this software is complex. | .80 |
| 2. Compared with other software in the industry, this software is very technical. | .78 |
| 3. The development of this software spans across wide range of functions. | .80 |
|
|
|
| 1. If this customer stopped buying from us, we could easily find another customer with approximately equal size. b | .72 |
| 2. It would be relatively easy for us to find another buyer for the software. b | .79 |
| 3. If the relationship with this customer were terminated, our business bottom line would not be significantly affected. b | .70 |
Rated on a scale from 1 (“highly standardized”) to 7 (“highly customized”).
Reverse-coded.
Notes: Fit indices: χ2 = 68.13; goodness-of-fit index (GFI) = .92; NFI = .92; CFI = .93; RMSEA = .04. Respondents answered on a scale from 1 (“strongly disagree”) to 7 (“agree”), unless specified otherwise.
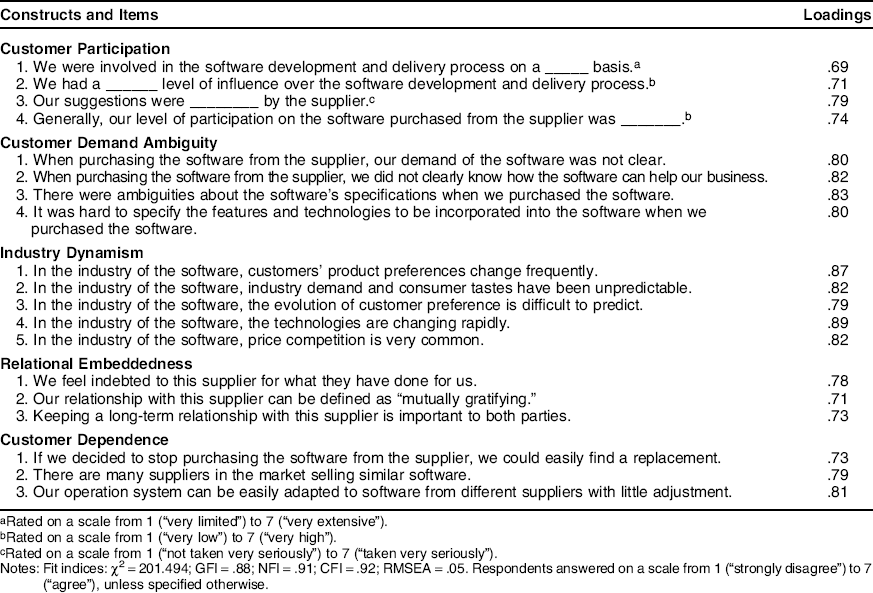
Scale Items from Customer
| Constructs and Items | Loadings |
|---|---|
|
|
|
| 1. We were involved in the software development and delivery process on a_____ basis. a | .69 |
| 2. We had a _____ level of influence over the software development and delivery process. b | .71 |
| 3. Our suggestions were_____ by the supplier. c | .79 |
| 4. Generally, our level of participation on the software purchased from the supplier was_____ . b | .74 |
|
|
|
| 1. When purchasing the software from the supplier, our demand of the software was not clear. | .80 |
| 2. When purchasing the software from the supplier, we did not clearly know how the software can help our business. | .82 |
| 3. There were ambiguities about the software's specifications when we purchased the software. | .83 |
| 4. It was hard to specify the features and technologies to be incorporated into the software when we purchased the software. | .80 |
|
|
|
| 1. In the industry of the software, customers' product preferences change frequently. | .87 |
| 2. In the industry of the software, industry demand and consumer tastes have been unpredictable. | .82 |
| 3. In the industry of the software, the evolution of customer preference is difficult to predict. | .79 |
| 4. In the industry of the software, the technologies are changing rapidly. | .89 |
| 5. In the industry of the software, price competition is very common. | .82 |
|
|
|
| 1. We feel indebted to this supplier for what they have done for us. | .78 |
| 2. Our relationship with this supplier can be defined as “mutually gratifying.” | .71 |
| 3. Keeping a long-term relationship with this supplier is important to both parties. | .73 |
|
|
|
| 1. If we decided to stop purchasing the software from the supplier, we could easily find a replacement. | .73 |
| 2. There are many suppliers in the market selling similar software. | .79 |
| 3. Our operation system can be easily adapted to software from different suppliers with little adjustment. | .81 |
Rated on a scale from 1 (“very limited”) to 7 (“very extensive”).
Rated on a scale from 1 (“very low”) to 7 (“very high”).
Rated on a scale from 1 (“not taken very seriously”) to 7 (“taken very seriously”).
Notes: Fit indices: χ2 = 201.494; GFI = .88; NFI = .91; CFI = .92; RMSEA = .05. Respondents answered on a scale from 1 (“strongly disagree”) to 7 (“agree”), unless specified otherwise.
Results of Self-Selection Model
| Project Customization |
||
|---|---|---|
| Variable | β | SE |
| Intercept | 3.899 | 1.083 *** |
| Product modularity | .134 | .054 ** |
| Project team technological capability | .187 | .072 *** |
| Customer participation | .198 | .081 ** |
| Relational embeddedness | .092 | .051 * |
| Customer demand ambiguity | -.053 | .073 |
| Prior experience | -.023 | .068 |
| Project duration | .034 | .011 *** |
| Customer type | .365 | .167 ** |
| Customer size | .211 | .098 ** |
| Supplier dependence | -.053 | .067 |
| Customer dependence | .062 | .071 |
| Product complexity | .089 | .091 |
| Customer industry_dummy | .564 | .201 *** |
| Product type_1 | .500 | .241 ** |
| Product type_2 | .218 | .317 |
| Product type 3 | -.018 | .188 |
| Adjusted R2 | .413 | |
p < .10.
p < .05.
p < .01.
Notes: Unstandardized coefficient; two-tailed tests of significance for all variables.