
Abstract
The increased penetration of mobile devices has a significant impact on customers’ online shopping behavior, with customers frequently switching between mobile and fixed devices on the path to purchase. By accounting for the attributes of the devices and the perceived risks related to each product category, the authors develop hypotheses regarding the relationship between device switching and conversion rates. They test the hypotheses by analyzing clickstream data from a large online retailer and apply propensity score matching to account for self-selection in device switching. They find that when customers switch from a more mobile device, such as a smartphone, to a less mobile device, such as a desktop, their conversion rate is significantly higher. This effect is larger when product category–related perceived risk is higher, when the product price is higher, and when the customer's experience with the product category and the online retailer is lower. The findings illustrate the importance of focusing on conversions across the combination of devices used by customers on their path to purchase. Focusing on the conversions on a single device in isolation, as is usually done in practice, significantly overestimates conversions attributed to fixed devices at the expense of those attributed to mobile devices.
Despite the growing importance of mobile devices, a 2015 Gallup survey highlighted that 74% of U.S. adults turn to their desktop or laptop for making purchases online (Saad 2015). Juxtaposed with the larger share of consumers’ time spent on them, mobile devices have a substantially lower conversion rate compared with desktops (1.27% for smartphones vs. 3.45% for desktops), and this conversion gap is not expected to decline soon (Chaffey 2016). Part of this situation can be explained by the impact of device switching when a customer has multiple devices available, as shown by Xu et al. (2017). An important follow-up question that arises is under what circumstances switching between devices leads to a stronger or weaker impact on conversion, so that marketers can avoid under- or overestimating the contribution of different devices in the different scenarios. Indeed, about 70% of the U.S. digital marketing and media practitioners in one survey identified cross-device audience understanding as the challenge requiring most of their attention in the near future (eMarketer 2016). This finding is validated by the actions of companies such as Google, which has enabled cross-device retargeting since May 2017 (Marvin 2017).
In this article, we seek to fill this knowledge gap by investigating the role of device switching in the online path to purchase, focusing specifically on the moderators of the device switching effect on conversion. That is, we examine whether conversion probabilities change when customers switch from a more mobile device (e.g., a smartphone) in one session to a less mobile device (e.g., a desktop) in the next consecutive session and vice versa, confirming what Xu et al. (2017) have found. More importantly, we investigate the conditions under which the potential change in conversion probabilities is greater or lower while explaining the variation in these potential changes through perceived risks associated with the product category and the customer experience. This understanding can help provide insights for managers who must make budget allocation decisions across multiple types of devices in consumers’ online path to purchase while accounting for differences in the product category and customer experience. The article also highlights the extent to which managers could make potential errors in attributing conversion probabilities solely to individual devices, rather than accounting for the potential synergistic effects generated by a combination of devices being used.
In addressing these questions, we contribute to the literature on multi/omnichannel retailing and mobile marketing. First, we provide insights into cross-device usage in the online path to purchase. The multi/omnichannel literature has mainly focused on cross-channel switching (i.e., online to offline) in the purchase journey (e.g., Ansari, Mela, and Neslin 2008; Konuş, Verhoef, and Neslin 2008; Lemon and Verhoef 2016; Verhoef, Neslin, and Vroomen 2007). Only a few studies have examined mobile device usage in the purchase process and its correlation with purchase behavior (e.g., Andrews et al. 2016; Luo et al. 2014; Xu et al. 2017). We contribute to this literature by focusing on the customer path to purchase, specifically shopping sessions across three different devices (smartphones, tablets, and fixed devices 1 ), and examining when switching between these devices occurs and how conversion correlates with switching behavior. Second, we contribute to the literature by considering purchase risk at both the product category level and the individual customer level. We view purchase risk as a main theoretical mechanism underlying cross-device usage and consider how it is related to purchase outcomes. So far, research on cross-device usage has considered theoretical mechanisms only to a limited extent (e.g., Xu et al. 2017). We focus on purchase risk as an important theoretical mechanism in device switching.
We consider smartphones and tablets as mobile devices and desktops and laptops as fixed devices, in line with BS Group (2017).
Our research is based on clickstream data from a large European online retailer tracking customers across consecutive shopping sessions and is complemented by survey data. Using a propensity score matching procedure to account for customer self-selection in device switching, we find that when customers switch from a more mobile device (e.g., a smartphone) in one session to a less mobile device (e.g., a desktop or laptop) in the next consecutive session, the conversion probabilities are significantly higher. The extent to which this conversion rate is higher depends on product category–related and customer-related risk factors. Specifically, we find that the higher the perceived risk of shopping in the product category and the less experienced the customer is with the product category and/or with the online retailer, the higher the conversion rate. If cross-device shopping sessions are not taken into account and if conversions are attributed naively to the last device used, the estimated contribution of the fixed devices is 15.9% higher than when device switching is taken into account, based on our counterfactual simulations. Accounting for device switching increases the contribution of smartphones by an average of 156.2%. For inexperienced customers who investigate the products on smartphones, which are perceived as risky, the conversion rate is 646.8% higher. These numbers highlight the importance and managerial relevance of better understanding and tracking the cross-device path to purchase. When the cross-device path to purchase is ignored, managers may overvalue fixed devices at the expense of mobile devices.
Relationship with Extant Research
Extant research on mobile devices has for the most part focused on the effectiveness of mobile promotions and mobile channel usage on purchase behavior outcomes and not on the cross-device environment. Luo et al. (2014), for instance, examine how the effectiveness of location-based targeting depends on the combination of temporal and geographical distance. Fong, Fang, and Luo (2015) extend this study by including competitive location-based targeting, and Dubέ, Luo, and Fang (2017), in turn, build on this study by including competitive reactions. Andrews et al. (2016) investigate how crowdedness influences the effect of mobile targeting, while Li et al. (2017) investigate how changes in the weather influence the effectiveness of mobile targeting.
More closely related to our research are studies that consider the relationship of mobile channel usage with purchase behavior outcomes. For example, Wang, Malthouse, and Krishnamurthi (2015) investigate how the adoption of mobile shopping influences online shopping behavior, and Kim, Wang, and Malthouse (2015) investigate the influence of the adoption of a brand's mobile application on brand purchase behavior. Thus far, only one study examines the usage of different devices in the customer journey (mobile or fixed) and its relationship with purchase behavior. By using natural experiments, Xu et al. (2017) show that tablets mainly act as substitutes for PCs and as complements to smartphones. In terms of purchases, after consumers adopt tablets to visit an online retailer's website, an increase in overall sales can be observed. Although sales through PCs drop after adoption of the tablet (i.e., the substitute effect), sales through smartphones increase, indicating a positive synergy between these devices. In addition, Xu et al. (2017) find that when purchases are split into different product categories, the sales of impulse products increase. Furthermore, tablet adopters start buying a wider variety of products, with more purchases of long-tail products (products outside the top 500 most popular products). Xu et al. (2017) further find that cross-device browsing, one of the main interests of our study, significantly relates to sales revenue. They find that a revenue increase occurs only when shoppers go from a smaller to a larger device (i.e., from a more mobile device to a less mobile device), whereas a negative effect is found when people switch from a larger (less mobile) to a smaller (more mobile) device.
Our study builds on the findings of Xu et al. (2017) by analyzing the moderators of this switching. Whereas Xu et al. (2017) show a relationship between switching and conversion, our objective is to gain insight into the reasons for the positive relationship between purchases and switching from a more mobile to a less mobile device, as well as to determine under what situations this relationship is stronger or weaker. Our study confirms and details this relationship by considering risk-related moderating factors at the product and consumer levels. We investigate a wide range of products from 30 different product categories, allowing us to study differences between products and product categories, as well as customer-specific variables. Furthermore, we consider the switching between all three different devices over a longer time horizon. Whereas Xu et al. (2017) consider cross-device browsing “as instances where users browse on two different devices within a one-hour time window” (p. 1486), we include sessions that are multiple days apart, and we account for the potential decreasing effect when sessions are further apart in time. Finally, we quantify this switching relationship to demonstrate the heterogeneity across different situations. This study allows us to obtain important insights into the relationship between switching and purchases, over and above those established by Xu et al. (2017). A nonexhaustive literature overview, which highlights our relative contributions, is provided in Table 1.
Literature Overview

The main focus of Xu et al. (2017) is on the adoption of the tablet device, but they observe the consequences of tablet adoption for sessions on smartphones and fixed devices and at the cross-device impact.
Notes: N.A. = not applicable.
Conceptual Model
Extant research in the multichannel and customer journey context (e.g., Lemon and Verhoef 2016; Verhoef, Neslin, and Vroomen 2007) has focused on the phases of shopping and purchase—prepurchase determination, purchase consummation, and postpurchase interaction. When a customer embarks on a path to purchase, these phases can be unbundled in such a way that each phase can be performed on a different device depending on the risk involved and the characteristics of the device that influence or can help reduce the risk. The characteristics of the devices (mobile or fixed) and the situational characteristics of usage play a significant role in determining which device the consumer uses in each phase.
In the prepurchase determination phase, where the information processing is less fine-grained—involving gathering information across multiple products and at a higher and/or coarser level (Moe 2003)—the risk of commitment to a wrong purchase is lower. Hence, the advantages of being able to more conveniently search for information on a mobile device outweigh the risk of making an error. Thus, mobile devices are a preferred option in this stage (Chin et al. 2012; Shankar et al. 2010). These advantages increase further depending on the context, such as the product category under investigation, the associated risks, and the customer's experience with the product category and the online retailer.
The purchase consummation phase, for example, involves choosing an alternative out of a choice set and making a commitment to that alternative. Consumers seek to ensure that they are making the right purchase and therefore strive to reduce the risk of making a wrong purchase (Moorthy, Ratchford, and Talukdar 1997). In this stage, information processing needs are much more fine-grained, detailed, and deliberate to lower the risks and make the right decision (Moe 2003). Fine-grained information processing needs might require the larger and higher-resolution screen of a laptop or desktop rather than the small screen of a mobile device. The need to enter detailed payment information without making mistakes may make the fixed device more suitable than a mobile device. Similarly, the increased perception of security and privacy risks in using the mobile device may lead consumers to choose a fixed device for purchase transactions. In addition, situational factors, such as being outdoors or in a public place, may increase the perception of risks, such as the risk of someone reading over one's shoulder while the shipment and billing information are entered. If the transaction risk on a mobile device is high, the customer will likely wait to access a device that is perceived as more secure (Chin et al. 2012). Note that these perceived and imputed costs will likely differ from customer to customer and from situation to situation (including the product category a customer is interested in). Therefore, we also investigate moderating risk factors at both the product category level and the customer level.
Analyzing how risk and context shape customers’ preferences for devices in the path to purchase is a suitable starting point for our conceptual framework (Figure 1). In this framework, we first propose that device switching in the path to purchase relates to conversion. Building on the notion that differences in risk are the main driver of the disparity in the relationship between switching and conversion rates, we include product category–related risks, customers’ purchase experience in the product category and experience with the online retailer, and the price of the product as moderators. In addition, we include other control variables in the model. In the next section, we elaborate on the hypothesized relationships.
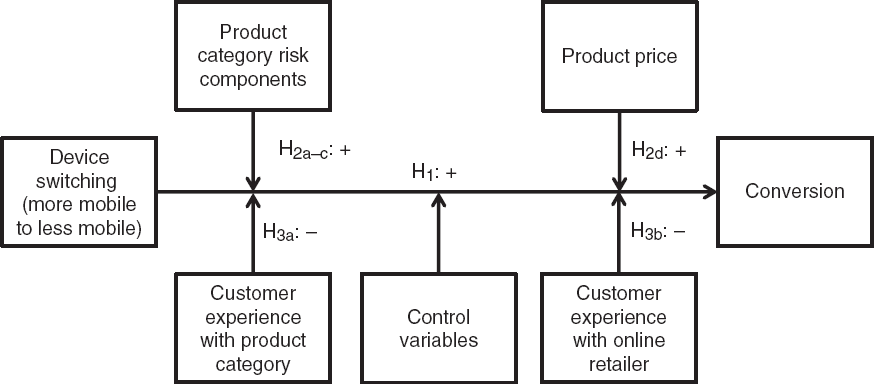
Conceptual Framework
Hypotheses
Main Effect
Although consumers use a range of devices, such as desktops with small and large screens and portable laptops of different sizes, to interact with retailers online, mobile devices such as smartphones are viewed as distinct from desktops and laptops. First, the mobile device, because of its small size, portability, and ubiquity, is more convenient to search for information whenever desired. A mobile device allows consumers to connect to the digital world from wherever they are in the physical world, and therefore it strongly affects the customer journey (e.g., Verhoef et al. 2017). Numerous studies have examined the usage of mobile devices and how it differs from the usage of other, less mobile devices (e.g., Cui and Roto 2008; Lee, Kim, and Kim 2005; Rapp et al. 2015). For example, the ubiquitous availability and proximity of smartphones leads to more frequent usage of mobile phones, compared with desktops or laptops. Although consumers use mobile devices more frequently, they use them for shorter durations than fixed devices (Cui and Roto 2008).
As indicated, part of the convenience of mobile devices relates to their flexibility in terms of the location where they can be used. As discussed by Lee and Benbasat (2004), mobile devices can be used at any place the user goes (spatiality), can be used to access the internet anytime and anywhere with sufficient network capacity (temporality), and can be used in many dynamic contexts, for example, to connect with other users to varying degrees (contextuality). These points do not hold for desktop computers. They do hold for laptops because laptops using a Wi-Fi connection can be used almost anywhere, at any time, and in any context. Still, the greater portability of smart-phones, which are in general lighter and smaller and have built-in telecom connections (i.e., instant internet access), allows these devices to be more easily used on the go than larger, heavier devices. As a consequence, people often use fixed devices in the security of their homes but use mobile devices more frequently when they are on the go, on the job, or in public locations, including stores (Lee, Kim, and Kim 2005; Rapp et al. 2015).
Because online sessions on mobile devices are more frequent and easily accessible from different places, mobile devices are ideal for early information searches but are less ideal during the purchase stage, when consumers want to reduce purchase risk and take more time to check the details of a purchase. This situation relates to security concerns: the mobile device is perceived as riskier for online shopping and payments (Chin et al. 2012). This higher perceived risk may lead consumers to switch between different devices as they continue along the path to purchase, because of a higher perceived risk of using a mobile device in the purchase process. For example, the smaller screen sizes of mobile devices may not allow easy comparison of alternatives, thereby limiting the evaluation process and increasing the risk of purchasing the wrong product. In addition, the smaller screen size may not be the ideal for entering all the payment information (unless it is stored ahead of time). In combination with concerns related to the security of payment information, these factors can increase the risk of mobile payments (Shankar et al. 2010).
According to Google (2012), the smartphone is the starting point for most multiscreen activities, such as online shopping. Moth and Charlton (2013) note that consumers use fixed devices relatively more often than mobile devices for finalizing purchases. Thus, mobile devices form the starting point for many customers’ online path to purchase, but the journey more often ends on fixed devices. When customers with an ultimate aim to purchase move from a mobile device to a fixed device, the switch could be a deliberate action intended to reduce their purchase risk. As discussed earlier, because of the difficulty of evaluating fine-grained information on a small screen, shopping on mobile devices could lead to higher purchase risk and an increased perception of security risk. Switching to a fixed device to complete the purchase can therefore reduce those risks.
Interestingly, by starting the path to purchase on a mobile device rather than a fixed device, consumers’ attachment to a product may be strengthened. As Brasel and Gips (2014) show, online shopping using the touch screen of a smartphone or tablet can increase the psychological ownership of the product being investigated. This phenomenon can cause customers who initially investigate a product on a mobile device to feel more attached to the product than if they first investigated it on a fixed device. However, to reduce the risk of purchase, they need to switch to a fixed device to finalize the path to purchase. Whereas the preceding mobile session thus makes the customer feel attached to the product and want to purchase it, the final nonmobile session helps them actually conduct the purchase. Thus, we expect the following:
H1: The conversion rate is higher when consumers switch from a more mobile to a less mobile device, compared with starting out on the less mobile device.
Moderating Effects
Although the conversion rates in the hypothesized main effect are explained by the costs in terms of risk, the effects could be moderated by perceived risks related to the product category and the customer experience. The advantages and disadvantages of the different devices, such as the ease of more conveniently searching for information with a more mobile device on the one hand, and the risk reduction during the final stage of the journey by a less mobile device on the other, likely depends on perceived risks related to the product category. Five forms of perceived product category–related risk have been identified (Jacoby and Kaplan 1972; Kushwaha and Shankar 2013). Functional risk is the risk that the product does not meet performance expectations. This risk can be reduced by searching for specific information about the product, reading online reviews, and doing comparative evaluations. To the extent that a fixed device enables a more fine-grained, granular information search than a mobile device does, this perceived risk could be lower in a desktop or laptop environment. Financial risk, which is the risk of losing money, could be increased in a mobile environment with its added perception of security risks. Using a more secure fixed device to finalize the transaction could reduce this financial risk. We also investigate this financial risk by studying the moderating effect of price.
A product category can also carry a privacy and safety risk, that is, the risk of causing a privacy violation and/or physical harm to the user. These risks might be reduced, to a certain extent, by conducting the transaction on a more secure device, by conducting a detailed information search, and by checking reviews, all of which might be more easily accomplished using a fixed device. The remaining risk components are psychological risk (i.e., tarnishing the user's self-image) and social risk (i.e., lowering others’ perception of the user). Although these risk factors are relevant, it is not straightforward to explicitly link them to device usage and device switching. Mobile usage is typically more social than desktop usage, and customers may benefit from social connections (e.g., Verhoef et al. 2017). For example, customers can use social media (e.g., WhatsApp) on their mobile devices to chat about a product with other customers in a store. Mobile usage may thus potentially reduce social risk because the customer can easily gather the opinions of other people, although for products for which privacy is important (e.g., medication), the customer may wait to make the purchase at home to prevent the risk of other people reading the messages over the customer's shoulder. Researchers have also discussed that switching between channels may increase psychological self-image by creating smart-shopper feelings (e.g., Verhoef, Neslin, and Vroomen 2007). When switching between devices increases smart-shopper feelings, it may reduce the psychological risk of purchasing and thus potentially increase the conversion rate.
Because we have theoretical reasons suggesting the direction of the moderating effects for the first three risk factors, we focus on these factors in our hypotheses. The theory underlying the effects of social and psychological risk is rather indirect, and thus we do not consider these perceived risk components in our hypotheses, although we do include them in our application as controls. Our reasoning results in H2a–c.
H2: The observed higher conversion rate when going from a more mobile to a less mobile device is even larger for product categories that are perceived as more risky in terms of (a) functional risk, (b) financial risk, and (c) safety risk. 2
Because of multicollinearity issues, we cannot test H2a and H2b separately; therefore, we only test them jointly in our empirical setting.
We expect that the positive relationship between device switching and conversion is stronger when the products being investigated are more expensive, which is a good proxy for financial risk—one of the components of the previous hypothesis. Wu and Wang (2005) show the importance of both good information searching and risk reduction for more expensive products. With more expensive products involving riskier transactions, customers have a greater need to reduce risk, whereas for less expensive products, the need to reduce risk is lower, and thus the advantage of switching devices is lower. Given the greater need to switch to a less mobile device to finalize the purchase of a more expensive product, this switch is expected to be more strongly associated with conversion when the product is higher in price than when the product is lower in price.
H2d: The observed higher conversion rate when going from a more mobile to a less mobile device is even larger when the product the customer investigates is more expensive.
We distinguish between two types of customer experience: product experience and online retailer experience. Experienced customers generally have more expertise about a product or retailer (Alba and Hutchinson 1987). As a consequence, they may perceive lower risks than less experienced customers perceive (Chin et al. 2012; Moorthy, Ratchford, and Talukdar 1997). Thus, we argue that customers who have more experience with an online retailer and with the product category they are investigating feel less of a need to switch to a fixed device when going deeper into the path to purchase. Furthermore, a more experienced customer is more familiar with the structure of the website, increasing the ease of navigating through different stages on the path to purchase. In other words, more experienced customers have lower perceived risks. Thus, we expect that for more experienced customers, the order of devices used is less important and the need to reduce risk by switching devices is lower. Therefore, we expect that the positive association between switching from a more mobile to a less mobile device and conversion is less strong for these customers.
H3: The observed higher conversion rate when going from a more mobile to a less mobile device is lower when customers have (a) more experience with the product category they are investigating and (b) more experience with the online retailer.
Data Description and Variable Operationalization
For the empirical part of our study, we use individual-level clickstream data from a large European online retailer to test our hypotheses. The data period ranges from December 20, 2011, to October 31, 2012 (317 days). The online retailer sells a total of 139,240 different products in 30 distinct product categories (excluding the “other” category), ranging from fashion to electronics and from gardening to beauty.
For the study, we use observations from customers who engaged in at least two sessions to determine how the previous session influences the current session. The online retailer defines a session as one continuous period in which the customer is active on the website. A session starts when the customer enters the online retailer's website and ends when the customer actively leaves the website or when the customer is inactive (i.e., has not visited a new page on the retailer's website or has not clicked on a link on the website) for more than 30 minutes. In our study, we use data only from registered customers because it is not possible to capture device switching by unregistered users and registration is necessary to conduct a purchase. In addition, we are interested only in sessions that belong to the same path to purchase (“the multiple touches a customer makes before a conversion,” as defined by Li and Kannan [2014]). If, for example, a customer looks only at electronic products in one session and looks only at clothing in the next session, the two sessions do not belong to the same path to purchase. Thus, the sessions in our final data set include those preceded by a session that contained at least one of the exact same products (i.e., the same stockkeeping unit [SKU]) or products of the same broad product category or a session that was “empty,” that is, a session in which a customer did not view any product or product category, thus indicating that the purpose of the session was simply to explore the online retailer's website. Finally, we use observations only from customers who switched between devices at least once from one session to the next, that is, customers who used at least two different devices in the data period. We exclude single-device users, for whom we cannot observe any device switching behavior. The final sample includes 37,378 unique customers who engaged in 951,819 usable sessions. For each session, the data include detailed information regarding which device was used to visit the website, which pages were viewed during each session, which products were purchased, and at what price they were purchased.
When categorizing the sessions by the device used, as we do in Table 2, we can see that customers are likely to continue the path to purchase on the same device in subsequent sessions rather than switching. Because customers are most likely to use the same device they used in the previous session, we find that switching between devices is not common, even among customers who use multiple devices when visiting the online retailer. This might explain why firms often fail to take device switching into account when evaluating the value of different devices. The critical question is, however, when people do switch, whether the switch is associated with a higher conversion rate, that is, whether such switches are critical moments in the path to purchase. When we only look at the last device used, we find that the conversion rate is highest for fixed devices, followed by tablets and then smartphones, which is in line with data from other online retailers (Chaffey 2016).
Descriptive Statistics per Device (N 5951,819 Sessions)
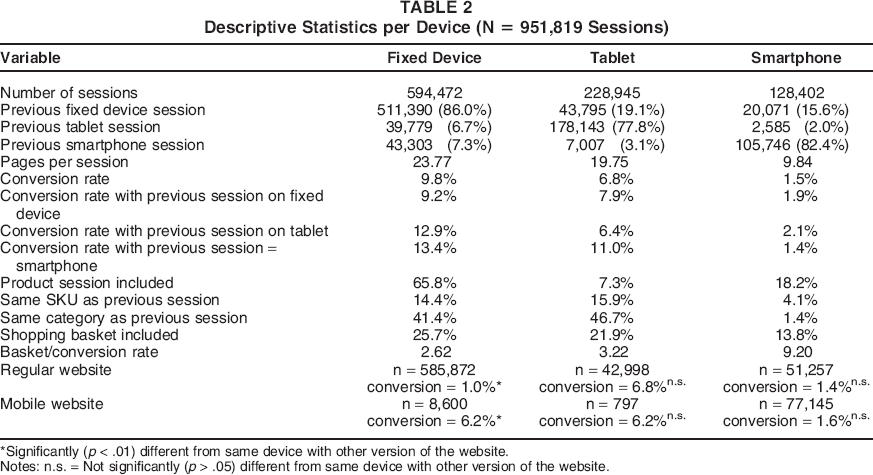
Significantly (p < .01) different from same device with other version of the website.
Notes: n.s. = Not significantly (p > .05) different from same device with other version of the website.
However, when we examine the conversion rates on devices according to the previous device used, we get a different picture. The conversion rate on a fixed device is 9.2% when the previous session was on a fixed device but 13.4% when the previous session was on a smartphone and 12.9% when the previous session was on a tablet. These differences are statistically significant, indicating that device switching from a more mobile to a less mobile device is related to a higher conversion probability, in line with H1.
Table 2 also shows that the basket-to-conversion rate (i.e., the number of sessions with at least one product put into the shopping basket divided by the number of sessions with at least one product purchased) is highest for smartphones and lowest for fixed devices (i.e., sessions on mobile devices have a higher shopping cart abandonment rate). This finding may indicate that consumers use mobile devices more often to search for information and save products in the shopping basket and less often to make the actual purchases.
In addition to the type of device, the type of website might influence the conversion rate. The retailer has both a regular version and a mobile version of the website, the latter of which is optimized for smaller screens. In terms of the products offered, prices, and promotions, the two websites are identical. As the last two rows of Table 2 illustrate, smartphone sessions are extensively conducted on both the regular and mobile websites, whereas the vast majority of sessions on tablets and fixed devices took place on the regular website. The conversion rate for smartphones does not differ significantly between the two websites; thus, the type of website does not drive the lower conversion rate of smartphone sessions, indicating that the difference is due to the type of device rather than the type of website. For tablets, the difference in conversions is also not statistically significant. For fixed devices, we find a significantly lower conversion rate on the mobile website than on the regular website, which likely is due to the customer visiting the mobile version of the site by accident (e.g., by clicking on a link to the mobile version of the website). Because of these differences, we control for the type of website in our model.
In addition, the data show some differences in the day of the week on which the devices are used. We find that customers use tablets significantly more on Sundays (16.8% of all tablet sessions are on a Sunday, compared with 14.1% and 13.0% for smartphones and fixed devices respectively). We also find that both smartphones and tablets are used relatively more on Saturdays (12.1% and 13.0% respectively, compared with 1.3% for fixed-device sessions). During weekdays, fixed devices are most popular, closely followed by smartphones. Tablets are used less on weekdays than on weekends. Therefore, we control for the day of the week in our model because this factor can influence both device switching and conversion. The day of the week can also serve as a rough proxy for unobserved variables, such as the location of the customer (e.g., at work or at home). Unfortunately, we do not have any information on the time of day or the location at which each session is started, so the day of the week is the best available proxy for these factors in our data set.
Beyond the risk-related moderators, we account for other variables that may be related to device switching and examine their role in the path to purchase. Specifically, we consider the relatedness of two consecutive sessions in terms of the products being viewed and the timing on different devices. In a study of directed-buying strategies, Moe (2003) shows that repeat viewing of a product within a session leads to higher conversion probabilities. We expect this higher conversion probability to hold when repeat viewing occurs across sessions. We also expect that the positive effect of device switching on conversion when customers evaluate the same SKU in subsequent sessions is stronger when these sessions are closer to each other in time. When sessions are further apart in time, the customer is more likely to have forgotten the previous information gained from the mobile device, which reduces the advantage of switching from a more mobile to a less mobile device. We control for age and gender because consumers may differ in their attitudes toward devices (e.g., Konuş, Verhoef, and Neslin 2008). For example, older consumers might be less experienced with mobile devices and perceive more risks in making a purchase on a mobile device. Finally, we include time as a control variable because the association may decrease over time as a result of technological developments (e.g., better security) and wider market acceptance (e.g., Prins and Verhoef 2007).
Survey to Measure Risk Perceptions
We used a survey to measure consumer perceptions of risks related to the 30 product categories that the online retailer sells. The survey asked participants to rate each of five randomly selected product categories on the five components of risk: financial, functional, safety, psychological, and social risk (Jacoby and Kaplan 1972). In line with Kushwaha and Shankar (2013), we also asked participants for their overall risk perception of the product category. All these components are measured on a scale from 1 = “low risk” to 9 = “high risk.” In total, 555 participants completed the survey via Amazon Mechanical Turk in August 2017, which resulted in a total of 2,775 product category evaluations. Each product category was evaluated by an average of 90 participants (range, 86–95).
Because of the high correlation between financial and functional risk (r = .967, p < .001) and between psychological and social risk (r = .961, p < .001) at the product category level, we combined each of these pairs into one component to reduce multicollinearity in our final model. This combination results in three risk components, in line with a principal components factor analysis that points to reducing the five initial risk scales to two or three factors (with safety risk loading high on both its own factor and the financial and functional risk factor). A reason that we find a different number of factors than Kushwaha and Shankar (2013) find might be that we examine differences at the product category level instead of the respondent level. The respondent-level information in our study cannot be matched with the clickstream data, so for further analyses we can only use product category heterogeneity. This means that we cannot test H2a and H2b separately, because the financial and functional risks load on one construct. The risk scores for the three remaining risk components and the overall risk can be seen in Table 3, ordered by increasing overall risk. Table 3 shows that products in the music, books, and movies category are perceived to be the least risky, whereas products in the medical/health care category are perceived as the most risky. However, substantial variation exists within and between the three individual risk components. We show the survey items and outcomes of the principal components analysis in the Web Appendix.
Perceived Risk Score for All Product Categories

Notes: All items were measured on a scale from 1 = “low risk” to 9 = “high risk.” In total, 555 participants each evaluated five randomly selected product categories. Each product category was evaluated by an average of 90 participants (range, 86-95). Given the high correlation between financial and functional risk (r = .967, p < .001) and between psychological and social risk (r = .961, p < .001) at the product category level, we combined each of these pairs into one component to reduce multicollinearity in our final model.
The scores on the three risk components are integrated into the clickstream data for the products that are investigated. If the customer investigates multiple product categories, the mean score of the risk components is used for that particular session. When we investigated what the differences would be if we used the maximum or minimum risk per session, we found that all these measures correlate highly with one another (r > .9).
Methodology
To test our hypotheses, we use a logistic regression model with customer i's utility of purchasing a SKU in a given session as our dependent variable of interest and a random intercept to account for individual-level customer heterogeneity, as shown in Equation 1. 3
We have estimated the same model but also (1) including lagged switching (up to three lags), (2) with all the different switching combinations (from smartphone to tablet, from smartphone to fixed, etc.) as dependent variables, and (3) on a subsample of customers who used all three types of devices in the data period. The results are robust for these different versions of the model.
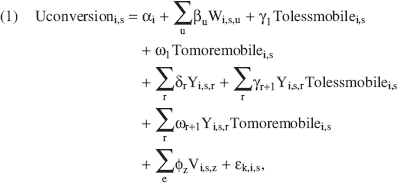
Table 4 provides a description of the attributes W (conversion attributes, e.g., the device used in the session), Y (switching and conversion attributes, e.g., the perceived risk factors), and V (control variables, e.g., the day of the week). Before estimating the model, we mean-center the attributes W, Y, and V, which results in γ1 being the effect of switching to a less mobile device when all other variables have a mean value. For H1, we thus expect that the value of γ1 is significantly larger than zero. We test H2a–d and H3 using the γ(v+)r+1 parameters, as indicated in Table 4. Table 5 shows the correlations between the variables, which do not signal multicollinearity (the variance inflation factor values in our final models are below 10).
Operationalization of Independent Variables (N = 951,819 Sessions)

The age is based on the registration information provided by the customer, which might be incorrect (e.g., the maximum age of 111 does not seem plausible), but these data are what firms have to work with in practice. However, 99% of the sessions in our final sample are conducted by customers who indicated an age between 17 and 72 years, and only .005% of the sessions are conducted by customers with an indicated age of 100 or older, which seems to be rather realistic. Furthermore, the outliers do not affect the final results.
Correlations Between Variables (N = 951,819 Sessions)

Note: All correlations are significant at the .05 level.
As argued earlier and shown in the data description section, devices are different in terms of when they are used, by whom they are used, and what is done on the different devices, and consumers’ switching between devices depends on these factors. Thus, the sessions in which customers have and have not switched between devices must be comparable to each other to control for the biases in customer self-selection and thus to accurately determine the association of device switching with conversion. To enable this estimation, we use a propensity score approach. Propensity scores are used, for example, by Kumar et al. (2016) when investigating the impact of social media and by Montaguti, Neslin, and Valentini (2015) in multichannel research. When calculating the propensity scores, we distinguish between three types of sessions:
Those in which the customer used the same device as in the previous sessions;
Those in which the customer switched to a more mobile device; and
Those in which the customer switched to a less mobile device.
Our goal is to make these three types of sessions as comparable as possible, in terms of both observable variables and unobservable factors, because only then can we reduce the bias due to self-selection in customer switching in our model estimates. The observable variables we use for the propensity score estimation are the demographics of the customer (gender and age), the experience with the online retailer (the number of sessions in the previous year, the conversion rate in the previous year, and the length of the relationship with the online retailer before the data period), the time between the two sessions, the day of the week, the time period, and the content of the previous session. These variables are chosen because they tend to be available for most online retailers, explain differences between customers and between sessions of customers, and reveal something about the stage the customer is in during the path to purchase. The content of the previous sessions (e.g., whether a brand or product page was viewed) is based on the variables used by Moe (2003) to segment sessions based on the stage of the path to purchase. These variables are described in Table 6, together with mean values of these variables for the three types of devices. As shown in Table 6, sessions on the smartphone are significantly shorter, with an average of 9.84 pages viewed, compared with 23.77 pages and 19.75 pages for fixed devices and tablets, respectively. In addition, sessions on mobile devices focus somewhat more on informational pages, and sessions on less mobile devices focus more on product pages. Again, this finding is in line with our expectation that the further along the path to purchase the customer is, the less likely the customer is to use a mobile device. The propensity score methodology does not account for the influence of unobservable factors in customer self-selection when switching. Therefore, we use Rosenbaum's (2002) sensitivity test to check for hidden bias due to unobservable factors.
Cluster Variable Operationalization (N = 951,819 Sessions)

The application of this procedure results in comparable sessions. That is, using the propensity score methodology we can compare the effects of two similar sessions, with the only difference being that in one session the customer came from a different (i.e., more or less mobile) device and in the other session the customer stayed on the same device. One reason for switching or not switching might be the unavailability or lower appropriateness of a given device at a certain moment, which is captured by this approach because the likelihood of switching is balanced by the propensity score methodology. This approach allows us to interpret the effect as the result of device switching. For more details on the applied propensity score methodology, please see the Web Appendix.
A multinomial logistic regression model with random intercepts to account for individual-level customer heterogeneity is estimated to predict if and in what direction (i.e., to a more or less mobile device) the customer has switched. The predicted probabilities are the propensity scores. That is, for each session, three propensity scores that total 1 are estimated.

Uswitchk,i,s = a variable indicating the probability of switching behavior k (to a more [1] or less [2] mobile device, with staying on the same device as the baseline condition) of customer i for session s, compared with session s - 1;
Xi,s,q = the value of customer i in session s on switching attribute q;
Yi,s,r = the value of customer i in session s on switching and conversion attribute r; and
Vi,s,z = the value of customer i in session s on control variable z.
Table 4 provides a description of the attributes, as explained in the discussion of Equation 1, where X are the switching attributes, that is, the variables used by Moe (2003). Based on the standardized bias and the Rosenbaum sensitivity test (Becker and Caliendo 2007; Rosenbaum 2002), we can conclude from both observable variables and unobservable factors that the propensity score procedure makes the different sessions comparable, thereby accounting for the customers’ self-selection in switching. As a result, using this propensity score approach is appropriate to test the association between device switching and conversion. For full details regarding the propensity score estimation, validation, and robustness checks, see the Web Appendix.
The conversion model stated in Equation 1 is estimated in three different versions. In the first version, we do not take the propensity scores into account. In the second version, the propensity scores are entered in the model as covariates, and two additional parameters are estimated for this model, one for the propensity score of switching to a less mobile device and one for the propensity score of switching to a more mobile device (see Table 7, second column of parameters). In the final version, we use a weighted logistic regression model, in which the observations are weighted based on the inverse of the propensity scores (e.g., if the session is performed on a less mobile device, the weight of this observation in the logistic regression is 1 divided by the propensity score for a less mobile device). This procedure of using propensity scores is in line with Austin (2011). Both methods have the advantage that they balance the sample, as shown in the Web Appendix, while retaining all observations.
Parameter Estimates Conversion Equation (N = 951,819)

Notes: PS = propensity score. Hypothesized effects are in boldface. The parameters are estimated using a logistic regression model with customer i's utility of purchasing a SKU in a given session as dependent variable and a random intercept to account for individual-level customer heterogeneity.
Results
Table 7 shows the parameter estimates of the conversion equation (Equation 1) that are used to test the hypotheses. The effect before correction (first row of parameters) is without the use of the propensity scores (i.e., the biased estimates). The second and third columns show estimates after correction by using propensity scores as covariates and the inverse of the propensity scores as weights, respectively. Because we mean-centered all the variables, the main effects in Table 7 are the effects when the other variables have a mean value. The constant is the estimate when someone uses a fixed device twice in a row, and the parameter for tablet (or smartphone) is the deviation of when someone uses a tablet (or smartphone) twice in a row. The estimate for the variable “To_less_mobile” is how a customer going from a more mobile to a less mobile device deviates from these baseline effects in terms of conversion. In line with H1, the main effect of this variable is positive and significant both with and without propensity score correction; that is, the conversion rate of the current session is higher when the previous session occurred on a more mobile device. With this finding, H1 is supported.
When we examine the estimate of the functional and financial risk variable, we observe that the higher conversion rate after a customer switches from a more mobile to a less mobile device is even higher when the customer has previously interacted with products that are perceived as more risky on these dimensions. With this finding, H2a and H2b are supported. The same holds for the safety risk variable: when customers investigated products perceived as more risky in terms of safety, switching from a more mobile device to a less mobile device is related to an even higher chance of conversion than when customers investigated products perceived as less risky. Therefore, H2c is supported. Furthermore, when a customer previously looked at more expensive products (a proxy for financial risk), this effect is also higher, in line with H2d. When the customer has investigated the product category more often and has visited the online retailer more often, the effect of switching from a more mobile device to a less mobile device is lower. Therefore, H3a and H3b are supported.
In addition to the hypothesized effects, we can investigate some of the other parameters. One interesting finding is that the effect of switching to a less mobile device on conversion is stronger for customers who are of older age. This finding makes sense when we look at the line of reasoning of our hypotheses. Older customers are likely to be less experienced with mobile technology than younger customers (Smith 2012) and might have a higher perception of the risk of mobile devices. For gender, we do not see any significant differences in device switching. We also do not find a significant moderating effect of psychological and social risk, which is in line with our discussion of the hypotheses, in which we noted that these factors are less important in this situation than the other risk factors. Interestingly, the interaction of device switching with time is insignificant. One could expect that over time, as the customer gains experience with different devices, risk and inconvenience costs decrease, and, in turn, the positive effect of switching on conversion is likely to decrease. This expectation, however, is not borne out by our findings, which suggest that our results are robust over time, although the data set is limited to one year.
Robustness Checks
Another way to examine the impact of having and using a combination of different devices is to compare multidevice users (i.e., customers who used at least two different type of devices in the data period) with single-device users and control for the number of sessions. When doing so, we find that the conversion rate is significantly higher for multidevice users than for single-device users (see Figure 2). Customers who, for example, have ten sessions split over multiple devices have a 19.7% higher conversion rate (i.e., 1.7 percentage points higher) than customers who use a fixed device for all ten sessions. The conversion rate of these multidevice users is about double that of users who use only a tablet or only a smartphone for all ten sessions. Additional analyses show that demographic differences are not driving these different conversion rates; rather, controlling for age and gender makes these differences in conversion rates even stronger. Thus, by looking from this angle, we find evidence that mobile and fixed devices strengthen each other and that the different devices have a positive synergy. This result is in line with findings in the multichannel literature, namely, that customers who use multiple channels are better connected with the firm and therefore are more valuable (Kumar and Venkatesan 2005; Montaguti, Neslin, and Valentini 2015).

Cross-Device Users Have Significantly Higher Conversion Rates
To further determine how robust our findings are, we performed a series of additional robustness checks. First, instead of using purchase as a dependent variable, we used the variable “whether the SKU was placed in the shopping basket” as the dependent variable. The logic of this analysis is to check whether the results are similar if an earlier stage of the path to purchase, where a commitment to a purchase is not actually made, is examined instead of conversion. Second, we performed a robustness check in which we included a moderator regarding whether the product category is utilitarian or hedonic. This check tests whether product risk is actually driving the effects or whether the effects are driven more by the type of product category, which may signal specific benefits of the category. In our third and final robustness check, we investigated whether our results hold when a customer purchases a new tablet; that is, we check whether owning such a device influences the future conversion rates of the other devices, something that we would expect on the basis of the discussion in our theory section and from our results. The results of these three robustness checks, which are all in line with our expectations and support our main results, can be found in the Web Appendix.
Scenario Analysis
Because the parameters in Table 7 are from variables measured on different scales and because of the many interactions in our model, we demonstrate in this section how strong the effect of device switching on conversion is under different circumstances. When large volumes of data are studied, it is important that the effects be not only statistically significant but also managerially substantive (Verhoef, Kooge, and Walk 2016). Therefore, we performed a simulation using the parameter estimates from the weighted propensity score correction model in Table 7. We use the weighted propensity score correction model because this model best balances the different samples and makes the sessions most comparable, as we show in the Web Appendix. The main findings are the same when we use the parameter estimates from either of the other two versions of the model.
In the simulation, we investigate the effect of device switching (to more mobile or less mobile devices) by incorporating different scenarios with respect to the risk of the product category (i.e., the most risky category vs. the least risky category) and then with respect to the customers’ experience with the product category and the online retailer (i.e., low vs. high experience, based on the 10th and 90th percentiles).
We first calculate the conversion rates for three different sessions based on the current and previous devices used by the customer. In the first scenario, we use the average path to purchase (i.e., setting all independent variables at the mean value). In the second scenario, we assume an inexperienced customer (i.e., a customer who had zero sessions in the previous year and who investigated the same product category zero times before, in line with the 10th percentile of these variables) who investigated the riskiest product category, namely, medical/health care products (as shown in Table 3). In the third scenario, we assume an experienced customer (i.e., a customer who had 124 sessions in the previous year and who investigated the same category ten times before, in line with the 90th percentile of these variables), who investigated the least risky product category, namely music, books, and movies (again as shown in Table 3).
From the conversion rates of the previous and current device, we calculate, conditioned on the switching behavior from Table 2, the contribution of each device based on the model's predictions and compare that with the contribution based on a last-click attribution (e.g., Li and Kannan 2014; see Table 8). Table 8 shows that in all three scenarios, the conversion rates on fixed devices are overestimated, while the conversion rates on tablets and especially on smartphones are underestimated, when the model's estimates are compared with the last-click attribution estimates. In line with other studies (e.g., De Haan, Wiesel, and Pauwels 2016), we find that last-click attribution leads to incorrect insights. How much the model's predictions deviate from last-click conversion depends on the risk of the product category and the experience of the customer. The riskier the product category and the less experienced the customer, the more mobile devices are undervalued and the more the fixed device is overvalued. As the last column of Table 8 shows, on average the contribution of the fixed device is overestimated by 15.9%, but this estimate can go up to 28.2% in the second scenario (inexperienced customer and high-risk product category). For smartphones, the contribution is, on average, 156.2% higher than what last-click attribution would suggest, and this discrepancy can be as high as 646.8%. These high percentages are, in part, the result of low absolute percentages, but they do highlight the actual underestimation of mobile devices’ contribution in the path to purchase that can occur when managers look solely at the conversion rates of the individual devices. It also emphasizes the importance of purchase risk, at both the category level and the individual level. All of these misattributions can have serious consequences for media mix allocations across these devices.
Conversion Probability Scenarios

An inexperienced customer has zero sessions in the previous year and a value of 0 for category experience (in line with the 10th percentile). An experienced customer has 124 sessions in the previous year and a value of 10 for category experience (in line with the 90th percentile).
Managerial Implications
For managers, our findings suggest three broad recommendations. First, managers should not be too concerned with low conversion rates on mobile devices; rather, a low conversion rate may indicate that the customer is not far along the path to purchase when using these devices. In fact, mobile devices have high value in the path to purchase: customers who use these devices together with fixed devices along the path to purchase are significantly more attractive in terms of conversion probabilities than equally active single-device users. Mobile devices complement the fixed devices in terms of conversion, and therefore the credit for conversions should not be given just to the single device that customers use in the final stage of the path to purchase. When we take into account the device used in the earlier session, we find that the conversion rates for fixed devices are lower and those for mobile devices are higher than last-click attribution suggests. This finding indicates that online retailers should not base their marketing investments and budget allocation for different devices just on the customer's last click, because this approach ignores the fact that the combination of devices can lead to positive synergy. That is, online retailers should look at not only the converting device but also the combination and order in which the devices that led to the conversion are used.
Second, mobile devices provide valuable information that can help online retailers identify moments in the path to purchase at which the conversion rates double or more than double, as we show in our simulation. A challenge will be to correctly identify the device graphs (i.e., which devices belong to which customers) so that customers can be tracked not only across sessions on one device but also across different devices. Doing so would provide managers the opportunity to better (re)target and serve customers in the different stages of their path to purchase. With the recent availability of commercially available solutions to track customers across devices (both deterministic and probabilistic cross-device tracking), such actions can be readily implemented. Our results suggest that retailers could try to (re)target customers on the fixed device, especially when the customer is less experienced and has investigated a riskier product category, as our counterfactual simulation shows. Cross-device targeting has been possible since May 2017 at Google Display Network (Marvin 2017), and our results suggest that it offers a good opportunity for practitioners to extend their targeting possibilities, such as by retargeting potential customers who previously investigated a product on a more mobile device with interventions while they are on a less mobile device. In light of our results, cross-device retargeting offers an interesting direction for future research, especially to gain a better understanding of the causal relationships. For example, when customers are motivated to come back to a website on a less mobile device, such as by cross-device retargeting, will the result indeed be a higher incremental conversion rate compared with that of traditional (within-device) retargeting? A well-designed field experiment could help answer this question of causality. From previous research by Bart, Stephen, and Sarvary (2014), we already know that mobile advertising is quite effective for higher-involvement and utilitarian products in terms of creating favorable attitudes and purchase intentions. This favorable attitude and purchase intent might be turned into actual conversion when the customer is retargeted on a fixed device.
Third and finally, because multidevice users are more valuable than single-device users, and because different devices can complement each other in the path to purchase, we recommend that online retailers better integrate customers’ cross-device experiences to provide a better service experience. For example, retailers could employ one cross-device shopping basket (as Amazon does), which would help customers select products on one device and then purchase the products on a different device. Furthermore, when the online retailer knows the time of day and day of the week when the customer is most likely to be on a certain (e.g., less mobile) device, the retailer could send an email reminding the customer about products in the shopping basket. This approach could help retailers reach customers at the right moment on the right device. To improve the service even more, managers could better optimize the mobile platform for information search so that the website structure fits the behavior of customers better.
Conclusion
In this study, we investigate how switching between devices is associated with conversion rates. We find that switching from a more mobile to a less mobile device is associated with a significant and substantially higher conversion probability. So far, most research has focused on channel switching, but we show that device switching is also related to strong changes in purchase behavior. Xu et al. (2017) show that owning an additional device has consequences for the usage and conversion rates of other devices. We confirm this finding (i.e., the switching effect) and, importantly, show under what circumstances this finding is stronger or weaker by considering risk as an important moderator. By doing so, we contribute to the existing research on device switching as well as mobile and online marketing (e.g., Kannan and Li 2017; Verhoef et al. 2017).
We focus on risk as a theoretical mechanism and moderator underlying device switching and its effects on purchase behavior. Purchase risk has gained strong attention in the consumer behavior literature (e.g., Jacoby and Kaplan 1972), and authors have related it to customers’ purchase behavior for products in online and offline channels (Kushwaha and Shankar 2013). However, the literature on customer journeys and cross-device usage either does not provide direct evidence for the important role of risk (e.g., Verhoef, Neslin, and Vroomen 2007; Xu et al. 2017) or focuses mainly on individual-level differences (e.g., Konuş, Neslin, and Verhoef 2014). Importantly, we show the importance of risk at both the category level and the individual customer level. Our findings at the category level show that the effect of device switching on conversion is stronger for high-risk categories. We studied multiple dimensions of product category risk. Our results show that functional and financial risks as well as safety risks of products are significant and substantial moderators. Psychological and social risks of products do not play a significant role in moderating the effect of device switching on conversion. This finding contributes to the existing literature on how product risk influences online purchase behavior (Kushwaha and Shankar 2013).
At the individual customer level, we show that the effect of device switching on conversion is weaker when the customer is more experienced with the product category and with the online retailer, and when the customer is investigating a more expensive product. This finding confirms the important role of experience in the online customer journey and the general importance of purchase experience in consumer behavior (e.g., Alba and Hutchinson 1987). The role of price again emphasizes the importance of financial risk (e.g., Wu and Wang 2005). Moreover, related research on cross-channel switching has ignored price as a risk factor (e.g., Verhoef, Neslin, and Vroomen 2007). When price is studied, it is mainly considered more as a potential gain (i.e., lower prices) of cross-channel switching (e.g., Gensler, Neslin, and Verhoef 2017). Using our risk perspective, we consider price as a risk factor.
Our study has a few limitations. First, we might not have correctly identified all sessions across all devices for each customer. We can match a device to a specific customer only if the customer has either logged in to the website on that device or if the customer clicked on a personalized link (e.g., via a personalized email) to visit the online retailer. Because of this limitation, we might have underestimated the amount of device switching. Online retailers must deal with this limitation in practice; they rarely have all information on the entire path to purchase. Our findings suggest that better identification of which device belongs to which customer can be valuable information for online retailers. Investing in better cross-device audience recognition can pay off in terms of creating better (re)targeting opportunities.
We furthermore do not have data on the location from which and the time at which the customers used the different devices. We only have data regarding the order in which the devices are used and the day on which a device is used. Location and time of day are, however, important drivers of mobile conversion (Andrews et al. 2016; Luo et al. 2014) because they help explain when devices are used and when important switching moments may occur. In addition, because of the nature of our data, we are unable to make causal claims. Natural experiments to foster device switching may be useful.
Another limitation is that with the data that we have, we cannot distinguish between sessions that started on a laptop versus those that started on a desktop. Laptops are more mobile than desktops and should therefore share some of the advantages of mobile devices, such as being able to be used in different locations. With more data, practitioners and future studies could at least partly overcome this limitation. Next, our data are from 2011 to 2012. Since then, mobile devices have become even more important in the life of many consumers and mobile applications have improved, which might change our findings, even though within our time horizon of almost one year we find the main effect of device switching on conversion to be stable. Investigation of more recent data, including new mobile applications, should be pursued.
Furthermore, we look mainly at the risks associated with devices to explain the heterogeneity in the effect of device switching on conversion. It might be that other variables, such as the benefits offered by devices, contribute to this switching effect. To some extent we test for this contribution in our robustness check by looking at differences between hedonic and utilitarian goods (for details, see the Web Appendix), but more research on this question should be conducted. Also, the experience of customers tested in H3 was operationalized as experience with the online retailer. Investigating the effect of experience with each individual device on the switching effect might provide further clarity, although in our case (because we look only at multidevice users in our final sample) the numbers of sessions per device are strongly correlated.
Finally, we observe customers only on the online retailer's own website. Data on the other websites that customers visit (e.g., price-comparison sites), as well as offline store visits, could provide more information about the stage the customer is in and the role that different devices play. In general, having richer information would help shed light on the complete path to purchase.
References
Supplementary Material
Please find the following supplemental material available below.
For Open Access articles published under a Creative Commons License, all supplemental material carries the same license as the article it is associated with.
For non-Open Access articles published, all supplemental material carries a non-exclusive license, and permission requests for re-use of supplemental material or any part of supplemental material shall be sent directly to the copyright owner as specified in the copyright notice associated with the article.