
Abstract
Prior research has been equivocal on the role that competitive environment plays in moderating the relationship between market orientation and a firm's business performance, even though such a moderating effect is conceptually quite plausible (Slater and Narver 1994). In this article, the authors empirically examine the role of business strategy type as an alternative, potential moderator of the market orientation–performance relationship. By using an improved version of Kohli and Jaworski's market orientation scale (Jaworski and Kohli 1993; Kohli, Jaworski, and Kumar 1993), the authors find evidence that supports the moderating effects of business strategy type on the strength of the relationship between market orientation and business performance. The authors also offer implications and future research questions based on the findings.
Literature Review
Industry and market environment has been investigated in the literature as a potential moderator of the market orientation–performance relationship. In Narver and Slater's (1990) study, among the 140 strategic business units of a major corporation's forest product division (commodity and noncommodity businesses), the correlation between perceived profitability (return on assets) and the market orientation scale was mixed (i.e., some were positive and others were negative) for the commodity businesses, but it was positive for the noncommodity businesses. Narver and Slater (1990) propose a potential explanation that the market orientation–performance relationship might be contingent on some industry situations in which firms operate, such as commodity versus noncommodity and/or competitive versus noncompetitive. Deshpandé and Farley (1998a) study potential influences of industry characteristics on market orientation and business performance. They classify the industry into consumer goods (durables and nondurables), industrial goods (capital goods, raw materials, and others), and services (financial and others) and find that industry at this level of aggregation or classification has little or no effect on either performance or market orientation.
Selnes, Jaworski, and Kohli (1996, 1997) and Deshpandé and Farley (1998a) examine the explanatory power of the regional (European versus U.S.) market environment for both market orientation and performance, but the results consistently indicate that the geographic environmental factor plays no significant role. Kohli and Jaworski (1990, pp. 14–15) propose that the degree of market orientation is influenced by the market environment (i.e., market turbulence, competitive intensity, and technological turbulence), and two factors (supply-side factors and demand-side factors) moderate the relationship between market orientation and business performance. However, Jaworski and Kohli (1993) find that none of the three environmental characteristics (i.e., market turbulence, technological turbulence, and competitive intensity) plays a moderating role. Jaworski and Kohli (1993) conclude that a market orientation probably is robust across various market contexts.
Slater and Narver (1994) also investigate the moderating role of competitive environment on the market orientation–performance relationship. The rationale for this hypothesized role is that effectiveness of a particular strategic orientation is contingent on market environment factors (Day and Wensley 1988; Hambrick 1983; Kohli and Jaworski 1990; McKee, Varadarajan, and Pride 1989; Snow and Hrebiniak 1980). For example, if demand is growing faster than supply, a firm could simply cash in on the opportunity without being highly market oriented (Kohli and Jaworski 1990). Similarly, if the buyer's bargaining power is low, the seller firms could use this leverage to profit from the transaction with a minimal level of market orientation (Slater and Narver 1994). Conversely, if the market is characterized by intense seller competition, the seller firms could not achieve acceptable levels of profit without being market oriented (Day and Wensley 1988; Slater and Narver 1994). Slater and Narver (1994), however, find only mixed support for the moderating effects hypotheses of environmental factors (i.e., market turbulence with return on assets, technological turbulence with new product success, and market growth on sales growth). In spite of the theoretical propositions, Slater and Narver (1994) conclude that across different market environments, the positive relationship between market orientation and profitability is robust (Narver, Park, and Slater 1992; Narver and Slater 1991; Slater and Narver 1994), consistent with Jaworski and Kohli's (1993) empirical results. A subsequent study (Greenley 1995), however, finds partial support for some of Slater and Narver's (1994) results (i.e., support for market turbulence with return on investment [ROI] and technological change with new product success, but not for market growth). Collectively, however, the findings on the moderating effects of environmental factors to date are mixed and equivocal.
Although prior studies find only limited support for the moderating roles by market environment, the findings direct us to a factor that is related to—but different from—market environment (Greenley 1995). More specifically, the classic structure–conduct–performance paradigm (Thorelli 1977; Vernon 1972) suggests that the conduct of the firm is constrained by the internal and external structure (i.e., environments) of the firm and that its performance is a result of the response (conduct) to such environments. The theoretical contention is that if the conduct is “right,” enabling the organization to fit its environments better, it should lead to better performance.
In reality, however, it is perceived environment that is a determinant of the response of the firm, and it is business strategy that incorporates, articulates, and reflects on management's perceived environment. The firm then communicates and implements the direction and focus of the response, or business strategy, 1 by setting specific performance goals, criteria, and actions (Chandler 1962). Walker and Ruekert (1987) argue that strategic orientation, performance on particular dimensions, and marketing activities have contingent relationships: Firms choose a strategy type to excel in particular dimensions of performance and execute each strategy by the most appropriate marketing activities. Business strategy as a general direction of the firm's response based on the filtered or distilled environmental information (see Jennings and Zandbergen 1995), therefore, can conceivably explain the varying magnitude of relationship between performance measures and a firm's specific marketing response (or conduct) mechanism, such as a market orientation. Combining Kohli and Jaworski's (1990) conceptualization of a market orientation as an organized set of marketing activities, the degree to which market orientation is related to business performance could vary more across different business strategies than the market environment that influences the business strategies (Hambrick 1982; Jemison 1984).
Gatignon and Xuereb (1997) operationalize strategic orientation as a combination of customer, competitor (see Narver and Slater 1990), and technological orientation. Their focal interest lies in the relative importance of the three orientations in marketing execution (especially on innovation). More broadly, however, a strategy type is a generic pattern of response (e.g., Miles and Snow's [1978] typology) at the business-unit level pertaining to the product-market domain, choice of performance criteria, and marketing execution. Thus, it is distinct from a market orientation that is purported to facilitate businesses’ understanding of the market environment (see Kohli and Jaworski's [1990] conception) and is hypothesized to facilitate superior performance in the chosen, specific criteria set by the strategy type (or, more broadly, strategic orientation).
Because implementing a strategy requires control and monitoring of its effectiveness in the market, a particular strategy pursued by an organization may determine the kinds of performance dimensions it strives for and attends to and the level of performance relative to competition with other strategic orientations. Because Miles and Snow's (1978, pp. 28–29) typology posits strategic orientation as a planned pattern of organizational adaptation to the perceived environment (market), it is particularly relevant to a market orientation that refers to a firm's externally oriented intelligence-related activities and responsiveness.
A brief recapitulation of the four strategic types defined by Miles and Snow (1978) is in order (see also Appendix A). It has been empirically demonstrated that the typology is a useful framework in distinguishing different strategic orientations of firms (Hambrick 1982, 1983; McDaniel and Kolari 1987; Snow and Hrebiniak 1980). Defenders are those
organizations which have narrow product-market domains…. As a result of this narrow focus, these organizations seldom need to make major adjustments in their technology, structure, or methods of operation. Instead, they devote primary attention to improving the efficiency of their existing operations. (Miles and Snow 1978, p. 29)
Prospectors are
organizations which almost continually search for market opportunities, and they regularly experiment with potential responses to emerging environmental trends. Thus, these organizations often are the creators of change and uncertainty to which their competitors must respond. However, because of their strong concern for product and market innovation, these organizations usually are not completely efficient. (Miles and Snow 1978, p. 29)
Analyzers are
organizations which operate in two types of product-market domains, one relatively stable, the other changing. In their stable areas, these organizations operate routinely and efficiently through formalized structures and processes. In their more turbulent areas, top managers watch their competitors closely for new ideas, and then they rapidly adopt those which appear to be the most promising. (Miles and Snow 1978, p. 29)
Reactors are
organizations in which top managers frequently perceive change and uncertainty occurring in their organizations but are unable to respond effectively…. [This type of organization] seldom makes adjustment of any sort until forced to do so by environmental pressures. (Miles and Snow 1978, p. 29)
Building on Child's (1972) work, Miles and Snow (1978) contend that organizations deliberately choose the appropriate strategy to fit themselves to their environment. Furthermore, organizations select their strategies on the basis of the environment, intending to be good at particular performance criteria, such as economic efficiency and new product innovation. Therefore, it can be hypothesized that the relationships between market orientation and some aspects of economic performance are not monotonic across organizations. Depending on the strategy type and its primary performance criteria, the relationships can be either strengthened or weakened.
However, a direct influence of strategy type on the level of market orientation (i.e., strategy type as a linear determinant of the market orientation level) is less conceivable. 2 Whatever strategy a firm may choose, it may (or may not) engage in intelligence-related activities. For example, within the same strategy type, some defender companies may engage extensively in intelligence-related activities in search of cost reduction, but others may not. Some prospector companies may not actively engage in intelligence-related activities, perhaps because such activities can be too costly and time-consuming to bring out a new product quickly, but others may choose to engage in these activities in search of new, unnoticed market needs.
We are grateful to an anonymous JM reviewer who suggested a potential direct effect of strategy type on the level of market orientation.
Also across different strategy types, no a priori theoretical reasons seem to predict whether a company with a certain strategy type is more (or less) likely to engage in intelligence-related activities (or market orientation). For example, a defender company may engage in a high level of market orientation in search of a low-cost supplier, a prospector company may engage in a high level of market orientation as well in search of unexplored foreign markets, and an analyzer company may engage in an equally high level to avoid falling too far behind prospectors. Companies with different strategies may well engage in high or low levels of market orientation. Thus, there seems to be no consistent and predictive pattern between strategy type and the level of market orientation.
In spite of the suggestion that environment-based strategy choice moderates the market orientation–performance relationship (e.g., Day and Wensley 1988; Hurley and Hult 1998; Kohli and Jaworski 1990; Miles and Snow 1978), it has been neither investigated nor understood well whether strategy type moderates the market orientation–performance relationship. Understanding such potential moderating effects is important for understanding the relationship between market orientation and economic performance.
Hypotheses
The review of the literature suggests the existence of moderating effects of strategy types. The central logic is that implementing a particular strategy is essentially a process of organizational adaptation to the market environment (Miles and Snow 1978, pp. 28–29), in which a market orientation should play a fundamental role. However, because the strategy types of Miles and Snow are planned patterns of adaptation with a particular set of business performance goals and a perceived external environment in mind (Aragón-Correa 1998; Jennings and Zandbergen 1995), the instrumentality of a market orientation (a set of adaptive behaviors) in achieving higher levels of performance should vary across different business performance dimensions. The stream of strategy typology literature suggests three relevant points to our theoretical position: (1) A company chooses its strategy on the basis of its understanding of the environment, (2) a chosen strategy directs a company's attention to certain performance dimensions, and (3) a company tries to excel in the determined performance dimension. In other words, the rationale behind our general hypothesis is that market-oriented companies are more likely to identify relevant information, share such information, and make more informed decisions conducive to achieving specific and determined performance criteria rather than all performance dimensions. The point is a subtle but extremely important one, because prior empirical studies do not provide clear indication as to whether the market orientation–performance relationship is invariant across different strategy types.
Thus, our umbrella hypothesis is as follows:
The relationship between market orientation and economic performance is moderated by the type of strategy employed.
In the following sections, this umbrella hypothesis is articulated according to the different types of economic performance measures pursued by firms with different strategy types.
It is believed that defenders and prospectors occupy two opposite ends of a continuum of environmental strategies (Miles and Snow 1978; Shortell and Zajac 1990). Analyzers sit between these two extremes. A unique combination of the strengths of the two other strategies, the analyzer type tries to balance risk and profit opportunity. Analyzers emphasize developing new products and markets, but only after their feasibility has been verified (Miles and Snow 1978, p. 70). The analyzer's strategy can result in a follower or respectable second place position in both product market growth (after prospectors) and efficiency (after defenders) dimensions. Holding its performance criteria as a combination of the defenders and prospectors, the analyzer must maintain “its firm base of efficient operation while pursuing effectiveness through the well-conceived addition of new products and markets” (Miles and Snow 1978, p. 77). In summary, analyzers aspire to be consistently good, if not the best, performers in both efficiency and product market effectiveness performance dimensions.
Conversely, the distinct feature of the defender's product-market domain is its narrow focus and stability. A defender's good performance in the industry depends on its ability to maintain its eminence aggressively within a well-defined market segment (Miles and Snow 1978). The aggressive maintenance effort is said to be evident in its continuous and intensive efforts in preparing its business infrastructure (Dvir, Segev, and Shenhar 1993), including the investment in technological efficiency (Miles and Snow 1978). Because the defender's primary emphasis is efficiency (Fox-Wolfgramm, Boal, and Hunt 1998) rather than effectiveness, its fundamental performance appraisal method involves comparing its efficiency with that of other organizations. In spite of its general instrumentality in interpreting the environment and facilitating the company's response (Jaworski and Kohli 1993; Kohli and Jaworski 1990), in the efficiency dimension, a market orientation should help the defenders adapt, focus, and perform well. Therefore, we expect the impact of market orientation on ROI, an efficiency measure, is greater for the defenders than for either the prospectors or the analyzers.
The strength of relationship between market orientation and performance as measured by profitability (ROI) is greater for defenders than for either prospectors or analyzers.
Unlike the defender, the prospector's capabilities are finding and exploiting new product and market opportunities. Its product-market domain is usually broad and continuously developing. Growth primarily comes from the development of new markets and expansion of product offerings (Shortell and Zajac 1990). Prospectors are innovators and thus often find technological innovation expensive and not as efficient as do competitors focused on standardization (Miles and Snow 1978). Because the defenders seem to pay attention to maintaining their share through low cost and financial efficiency (Porter 1980; Segev 1989; Shortell and Zajac 1990) in narrowly defined market segments, we believe that the benefit for defenders to be market oriented in product-market growth dimensions (market share growth, relative sales growth, new product sales as a percentage of total sales) would be smaller than the benefit for prospectors. Therefore, prospectors evaluate themselves more often than any other types of organization in terms of effectiveness in new product development, new market development, and aggressive growth in the chosen market (Dvir, Segev, and Shenhar 1993; Parnell and Wright 1993). In the product-market growth dimension, a market orientation as a mechanism for adaptation and focusing should serve prospectors better than other strategic types.
Therefore, we developed the following hypothesis related to product market growth to test the moderating effect of the strategy types on the influence of market orientation:
The strength of the relationship between market orientation and performance as measured by (a) market share growth, (b) relative sales growth, and (c) new product sales as a percentage of total sales is greater for prospectors than either defenders or analyzers.
Reactors
Different from the three other types, reactors do not present any consistent pattern of response behavior to environmental conditions. As the name suggests, they simply react, usually only after environmental pressure exceeds tolerance. Miles and Snow (1978, p. 82) provide several reasons for this lack of strategic consistency: (1) management's failure to articulate a viable organizational strategy; (2) lack of linkage among technology, structure, process, and strategy; and (3) management's adherence to a particular strategy that is already irrelevant to environmental conditions. Having no consistent strategy, reactors wish to be good in every performance dimension but typically fail to excel in any.
Because of the incoherent intent and behaviors among the reactors, this type of strategy is not identified as a viable strategic alternative for a firm. Managerially speaking, it cannot be a strategy, because neither planned actions nor response behavior patterns are observed, and few, if any, managers would actively pursue this pattern of inconsistency. Because of this inconsistency, no a priori predictions or hypotheses can be made regarding reactors’ strategic intent (Mintzberg 1978; Shortell and Zajac 1990) and its consistent effect on the market orientation–performance relationship. Moreover, the lack of consistency would pose a great empirical challenge, especially in a cross-sectional design, because reactors could exhibit other strategic types’ characteristics at different times (Shortell and Zajac 1990); indeed, the reactor type could not be clearly identified in several prior studies (see Slater and Narver 1993; Wright et al. 1991). Thus, in this study, we used only three viable strategy types (see Hambrick 1982, 1983; McDaniel and Kolari 1987) for evaluating the moderating effect on the relationship between market orientation and performance.
Method
Data Collection
A master list of 3300 U.S. manufacturing companies, which identified one marketing executive (vice president or director level) per company, was obtained from a well-known, Midwest-based commercial vendor. The 3300 companies were randomly chosen from all the listed manufacturing companies (a total of about 600,000) in the vendor's quarterly updated master list, which encompassed a wide range of Standard Industrial Classification codes (2011–3999). 3 The profiles (employee size and annual sales) of the 300 manufacturing companies in the pretest (discussed subsequently) and the 1000 companies for the final sample are given in Appendix B. A mailing—including cover letter, stamped return envelope, and questionnaire—was sent to a random sample of 1000 marketing executives of the 3300 companies in the master list. Three-wave mailings produced an effective response rate of 38.76% (or 364 usable responses) after the number of undeliverable survey packets returned to the authors was subtracted. For nonresponse bias examination, multivariate analysis of variance was applied to the four economic performance variables (ROI, market share, sales growth, percentage of new product to total sales), comparing the three different mailing wave respondents. None of the multivariate tests of significance indicated differences in the performance variables. Because no significant statistical differences in those four variables were found, it was concluded that nonresponse bias was not a significant problem for the analysis.
Included were food; tobacco; textiles; apparel; lumber and woods; furniture; paper; printing; chemical; petroleum; rubber; leather; stone, clay, glass, and concrete; metal; machinery; electronic and electrical equipment; transportation equipment; and measuring instruments, among others.
Measures
The market orientation scale
Kohli and Jaworski (1990) and Jaworski and Kohli (1993) provide a conceptualization and operationalization of a market orientation. Consistent with the use of market information research stream (Deshpandé and Zaltman 1982; Maltz and Kohli 1996; Menon and Varadarajan 1992; Moorman 1995; Moorman, Deshpandé, and Zaltman 1993; Shapiro 1988; Sinkula 1994), their scale places a particular emphasis on the firm's activities in dealing with information about customer needs and the environment (i.e., market) that affects organizations (Deshpandé and Farley 1998a, b; Jaworski and Kohli 1996; Narver and Slater 1998). Although we support the fundamental conceptual position of market orientation as intelligence-related activities, Kohli and Jaworski's scale (Jaworski and Kohli 1993) falls short in two areas: breadth of item-sampling domain and the scale's factorial structure and fit. Two streams of literature support a broader conceptualization of the item sampling domain: the environmental scanning literature (Aguilar 1967; Culnan 1983; Daft, Sormunen, and Parks 1988; Hambrick 1982; Kefalas and Schoderbek 1973; Meyer 1979; Rhyne 1986) and the so-called stakeholder concept and constituency-based theory literature (Anderson 1982; Connolly, Conlon, and Deutsch 1980; Kotler 1972; Pfeffer 1978; Pfeffer and Salancik 1978; Sturdivant 1977; Zeithaml and Zeithaml 1984). Moreover, the need for a broader range of market stakeholders and forces in the domain of a market orientation is acknowledged in the more recent literature (Kohli, Jaworski, and Kumar 1993; Slater and Narver 1995). We believe that a broader and more balanced explication of market factors is critical because business strategy is postulated as a reflection of perceived market environments and a choice of focal performance criteria and actions.
In addition, the empirical literature indicates that many of Kohli and Jaworski's scale items (Jaworski and Kohli 1993) seem to have fit problems in the original second-order factorial structure (see Kohli, Jaworski, and Kumar 1993; Siguaw, Simpson, and Baker 1998). Siguaw, Simpson, and Baker (1998) consequently remove the items Kohli, Jaworski, and Kumar (1993) use to capture the original breadth of market factors. Having to remove several items from an already narrow domain of market factors is not desirable from the theoretical position that the breadth of domain is critical. Therefore, we decided to develop a market orientation scale that improved both item domain breadth and psychometric properties. We define a market orientation construct with this extended domain as a set of intelligence generation and dissemination activities and responses pertaining to the relevant industry market participants (i.e., competitors, suppliers, and buyers) and influencing factors (i.e., social, cultural, regulatory, and macroeconomic factors). Thus, the improved scale extends the item domains to include supplier relationships, regulatory aspects, social and cultural trends, and the macro-economic environment explicitly.
Our overall scale improvement methodology followed the procedures recommended by Churchill (1979) and Gerbing and Anderson (1988). The scale developed for this study evolved from a combination of qualitative in-depth interviews, a review of the market orientation literature, and a survey pretest of the scale. The results of the interviews strongly indicate that managers conceive a market more broadly than as a combination of customers and competition and specifically include such factors as macroeconomic elements (e.g., exchange rates, macroeconomic fundamentals of foreign countries), suppliers (e.g., new technical capability of suppliers, availability of alternative suppliers), social and cultural trends (e.g., growth of one particular segment that corresponds to a different lifestyle), and regulatory environment (e.g., product safety, labor regulations).
With the activity and environment domains in mind, we developed a set of the items designed to measure market orientation (MO). For our improved MO scale, we generated 37 new items for intelligence generation (IG; 15 items), intelligence dissemination (ID; 10 items), and responsiveness (RESP; 12 items). We added these newly developed items to the original set of Jaworski and Kohli's (1993) 32 market orientation scale items to constitute collectively the original candidate items for the MO scale (a total of 69 items for a pretest). We conducted the pretest not only to evaluate reliability and constructs but also to reduce the number of items to a more manageable number. For this pretest, we sent a mailing—including cover letter, stamped return envelope, and pretest questionnaire—to a random sample of 300 marketing executives of manufacturing companies in the United States. The profile of the 300 companies is given in Appendix B. After the purification of items through multiple iterations of confirmatory factor analysis, reliability evaluation, and item-by-item substantive evaluation, we reduced the total number of items from 69 to 46. With the 46 items in the final data set, we conducted item purification in the same manner as the pretest. The purification process with the final data set led us to retain a total of 22 items for the MO scale (see Appendix A). After conducting a confirmatory factor analysis on the measurement model to validate the internal and external consistencies among the factors, we conducted a second-order confirmatory factor analysis.
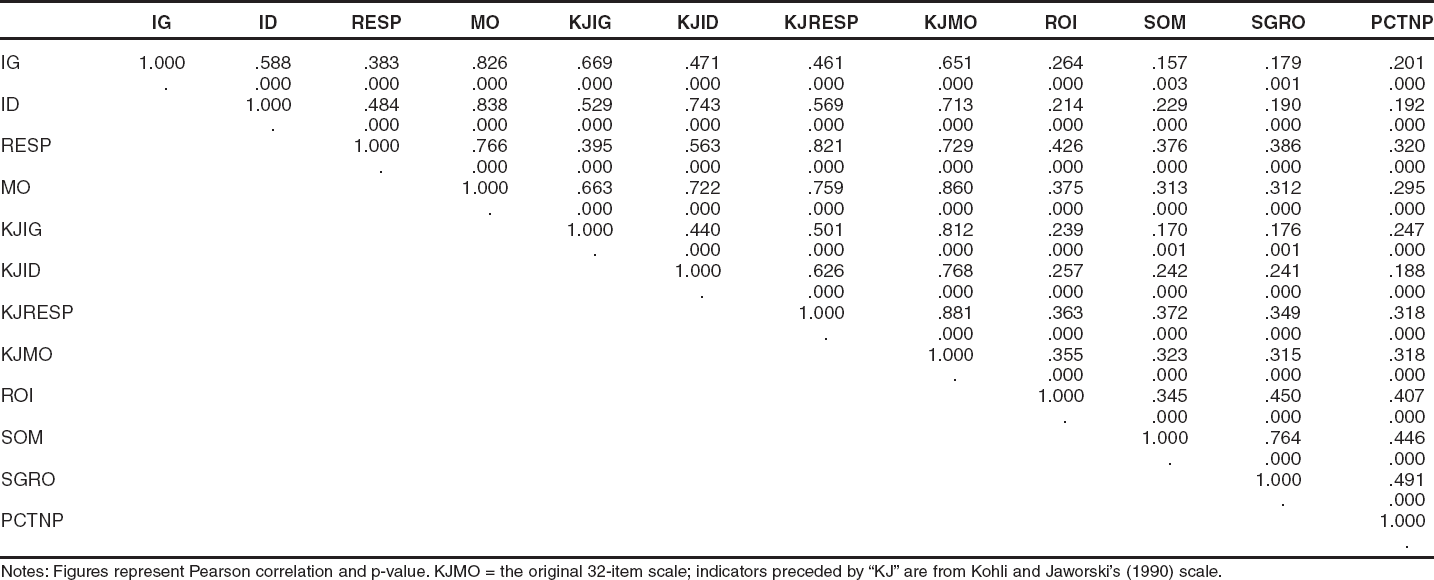
Path coefficients between the higher-order construct (MO) and the three dimensions were all significant at the α =.05 level (Table 1). The fit statistics (χ2 = 404.666, degrees of freedom [d.f.] = 206, goodness-of-fit index [GFI] = .913, adjusted goodness-of-fit index [AGFI] = .893, noncentrality parameter [NCP] = 157.623, Tucker–Lewis Index [TLI] = .894, normed fit index [NFI] = .809, and comparative fit index [CFI] = .906) demonstrated an acceptable improvement over the three-component market orientation scale reported by Kohli, Jaworski, and Kumar (1993; χ2 = 1010.05, d.f. = 464, GFI = .722, AGFI = .675, NCP = 546.05, TLI = .641, and NFI = .524), 4 given that our market orientation scale extends the breadth of the construct domain and still retains the second-order factorial structure that is conceptually consistent with the three-component market orientation construct (Jaworski and Kohli 1993; Kohli and Jaworski 1990). The correlation matrix (the improved MO scale components, Kohli and Jaworski's scale components, and performance indicators) is supportive of the convergent validity of the MO scale with Kohli and Jaworski's original 32-item market orientation scale (Jaworski and Kohli 1993; Kohli, Jaworski, and Kumar 1993) and its predictive validity with regard to the performance indicators (Appendix C). The reliability coefficients (Table 1) were also acceptable: .84 for the entire new MO scale (22 items). Thus, we deemed our revised second-order scale of market orientation adequate for the purpose of this study. For hypothesis testing, we then aggregated the MO scale to have three indicators (i.e., IG, ID, and RESP) by summing the measurement items at the first-order construct level. 5
Final LISREL Standardized Estimates and t-Values: Improved Market Orientation Second-Order Scale
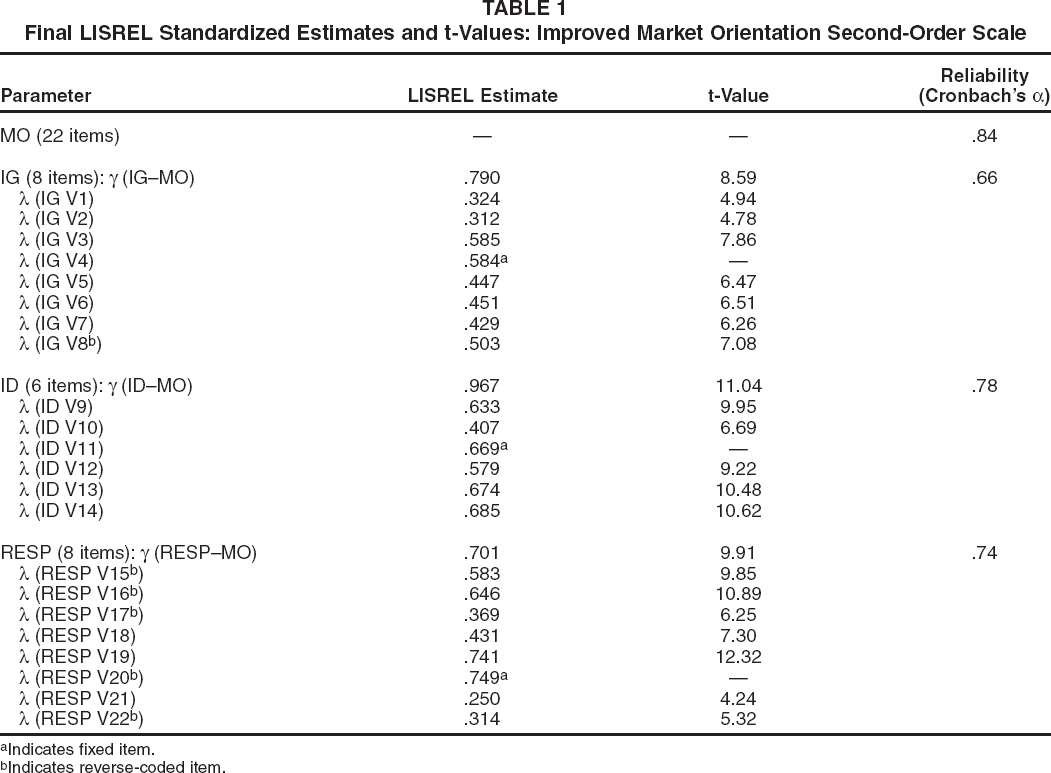
Indicates fixed item.
Indicates reverse-coded item.
The following fit indices were calculated for the three-component MO scale in Kohli, Jaworski, and Kumar (1993): AGFI = 464/496 × .722 = .675, NCP = χ2 statistics - d.f. = 1010.05 - 464 = 546.05, NFI = (2121.28 - 1010.05)/2121.28 = .524.
This aggregation is justified because (1) the validity of the second-order MO scale with all 22 item measures has been established; (2) given the sample size, aggregation allows maximization of the d.f. in estimating the path coefficients between the MO and performance measures; and (3) it reduces higher levels of random error while accounting for measurement error and retaining the three-dimensional scale of market orientation.
Strategy types
The strategy type (labeled V27, Types 1–4, in Appendix A) was measured by using a categorical variable. A self-typing measure (see James and Hatten 1995; Shortell and Zajac 1990) asked the respondents to evaluate the strategies of their own organizations using descriptions of the four generic strategies in Miles and Snow's (1978) typology. The descriptions of the types were the same as those used by Snow and Hrebiniak (1980) and McDaniel and Kolari (1987). The strategic types—defender, prospector, analyzer, and reactor—were labeled, respectively, Type 1 through Type 4 (Appendix A). Although only the three viable strategy types (defender, prospector, and analyzer) were used for the test of moderating effects of the strategy type on the relationships between market orientation and performance measures, the reactor type was also included as a choice in the questionnaire. The purpose of having this type as a response alternative was to screen, for the moderating effect test, organizations with no strategic behavioral pattern. The response frequencies for each strategy type were 77 defenders (21.2%), 133 prospectors (36.5%), 130 analyzers (35.7%), and 18 reactors (4.9%). There were six item nonresponses (1.6%).
Business performance
Four economic outcome indicators (labeled V23–V26 in Appendix A)—market share (SOM), relative sales growth (SGRO), percentage of new product sales to total sales (PCTNP), and ROI —were developed for the final questionnaire.
The market orientation literature and the results of exploratory in-depth interviews indicated that a market orientation is important because it provides a competitive advantage to the organization. Thus, the criterion variables (economic outcomes) were measured in comparison with those of the organization's competition. Because competitors are the standard of comparison in the performance scale, each economic outcome item was phrased so that the aspect of economic performance was evaluated by the respondents relative to their organizations’ primary competitors (see Conant, Mokwa, and Varadarajan 1990).
The Statistical Model and Analysis
To test the existence of a moderating effect by strategy type, we first conducted a moderated regression analysis to identify interaction effects among market orientation, the performance variables, and the three strategy types that were transformed to three dummy variables (Sharma, Durand, and Gur-Arie 1981). We found no significant main effects among the dummy variables on the performance variables. The only significant interaction term, albeit very weak at the .05 level (t-value = 2.044), was between prospectors and market orientation with respect to ROI. In addition, there was no statistically significant correlation between the strategy type and the level of market orientation. Thus, of 12 possible interaction effects (three dummy moderator variables × four performance variables), only one interaction effect was marginally significant, and there was no correlation between the strategy type and market orientation, which led us to the next step for conducting subgroup analysis (Sharma, Durand, and Gur-Arie 1981).
For the subgroup analysis, we applied multiple-group structural equation analyses (Bollen 1989, pp. 355–69; Jöreskog and Sörbom 1993, pp. 51–84; Scott-Lennox and Lennox 1995) to examine whether the parameter estimate (γ) between each performance measure and MO differs across the three viable strategy types (see Figure 1 as an illustration for ROI). Multiple-group structural equation modeling (MSEM) deals with moderators indirectly. In other words, the empirical criterion is whether there are different values for structural parameters at different values of a moderator. Thus, the subjects are divided into groups (for our strategy type, they are already divided because it is a categorical variable) according to different values of the moderator variable. We used MSEM because, given our theoretical model, the most precise empirical answer can be found by this method. The advantages for using this technique are that it enables us to account for measurement errors, estimate the path coefficients with less bias, and provide more information on the psychometric properties of our new MO scale. In addition, MSEM is uniquely suited for our theoretical model because of its ability to test such a model for the applicability of the market orientation–performance relationship to different strategy types (i.e., population subgroups) simultaneously.

The Multiple-Group Analysis (An Example Using ROI)
The mechanics of this procedure are as follows: First, the sample was divided into the three strategy type groups. For each subsample, a covariance matrix was calculated, and the parameters were estimated for each subsample by LISREL. Of particular interest was the γ estimate between each performance measure and market orientation. The pair-wise comparison of the γs of the three strategy types for each performance measure was conducted. More specifically, the pairwise comparison was based on the chi-square difference between the two models, in which one model constrained the two γs to be equal (i.e., an equality constraint model, in which the influence of market orientation on performance measure is constrained to be equal across two different strategy types) and the other model left the two γs free to covary (i.e., a free model in which the influence of market orientation on performance measure is allowed to be different). The difference of the two models’ statistical significance was used as a test for the equal γs, that is, whether the equality constraint model (γs are equal) produced a better fit than the free model (γs are not equal).
Results
The chi-square statistics for every pair of strategy types for each performance indicator are provided in Table 2. H2 and H3 examine a moderating role of Miles and Snow's (1978) strategy type on the relationships between MO and the four economic performance measures (SOM, SGRO, PCTNP, and ROI).
Pairwise Comparisons of Strategy Types: Chi-Square Statistics, γ Estimates, and t-Values

ROI
H2 predicts that, for the profitability measure (ROI), the γ parameter would be greater for the defenders than for either the analyzers or the prospectors.
γ (defenders) > γ (prospectors) and γ (defenders) > γ (analyzers).
For ROI, the first pairwise comparison was between defenders (Type 1) and prospectors (Type 2). The chi-square was 423.899 (d.f. = 15) for the equal-γ model and 304.070 (d.f. = 14) for the free-γ model. The chi-square difference was 119.829 (d.f. = 1). The critical value of chi-square statistical difference with one d.f. at the α =.05 level is 3.84. Thus, the chi-square statistic was worsened when the two parameters were constrained to be equal. The γ estimates for the free-γ model were 1.166 for defenders and .163 for prospectors.
The second pairwise comparison was between defenders (Type 1) and analyzers (Type 3). The chi-square was 404.723 (d.f. = 15) for the equal-γ model and 276.938 (d.f. = 14) for the free-γ model. The chi-square difference was 127.785 (d.f. = 1). Thus, the chi-square statistic was not improved by constraining the two parameters to be equal. The γ estimates for the free-γ model were 1.287 for defenders and .060 (not significant at the α =.05 level) for analyzers.
Together, the defenders’ γ was greater than either the prospectors’ or the analyzers’. Therefore, H2 was supported.
SOM, SGRO, and PCTNP
H3a predicts that for SOM, the prospectors’ γ parameter is the greatest, followed by the analyzers’ and the defenders’.
γ (prospectors) > γ (defenders) and γ (prospectors) > γ (analyzers).
The first pairwise comparison was between defenders (Type 1) and prospectors (Type 2). The chi-square was 410.953 (d.f. = 15) for the equal-γ model and 348.514 (d.f. = 14) for the free-γ model. The chi-square difference was 62.439 (d.f. = 1). Thus, the chi-square statistic was worsened by constraining the two parameters to be equal. The γ estimates for the free-γ model were −1.532 for defenders and .119 for prospectors. Defenders’ γ was not only smaller but also negative.
The second pairwise comparison was between prospectors (Type 2) and analyzers (Type 3). The chi-square was 640.831 (d.f. = 15) for the equal-γ model and 480.340 (d.f. = 14) for the free-γ model. The chi-square difference was 160.491 (d.f. = 1). Thus, the chi-square statistic was not improved by constraining the two parameters to be equal. The γ estimates for the free-γ model were 1.926 for prospectors and .0476 (not significant at the α =.05 level) for analyzers. Together, the prospectors’ γ was greater than either the defenders’ or the analyzers’. Therefore, H3a was supported.
The same procedures were applied to test both H3b (SGRO) and H3c (PCTNP). For both of these two performance indicators, the same conclusion as for H3a (SOM) was obtained: The prospectors’ γ was greater than either the defenders’ or the analyzers’. Therefore, H3b and H3c were also supported. The results of testing the individual sub-hypotheses (H2 and H3) were supportive of the umbrella hypothesis: The relationship between market orientation and economic performance was found to vary across the strategy types. Thus, H1 was supported.
Discussion and Implications
The moderating role of the strategy type on the relationship between market orientation and economic performance was empirically examined in this study, and all hypotheses were supported. It was found that the relationships between market orientation and performance measures are not monotonic. For a better understanding of the support for these hypotheses, a post hoc analysis was conducted. For each performance dimension, a mean score was compared for each strategy type by one-way analysis of variance (Table 3).
Mean Performance Scores and γ Estimate Rankings

Mean differences were based on pairwise comparisons using Scheffe's test at the α =.05 level.
P = prospectors, A = analyzers, D = defenders.
Note that the γ coefficient represents the ratio of change in the dependent variable (performance variable) to a unit change in the independent variable (market orientation). In a managerial sense, it is a measure of the impact that can be expected when market orientation is increased. However, the mean scores simply represent the current overall level of performance by different strategy types. By combining these two different criteria, it can be concluded that
Relatively speaking, analyzers would gain little benefit in any performance dimension by increasing the market orientation level. No significant t-values (Table 2) were found on their γ coefficients, which suggests that they are likely to receive no additional performance benefit (or loss) from increasing the level of market orientation.
However, analyzers’ scores are consistently ranked second in the mean score on any of the measures.
This is an interesting finding. The analyzers, in pursuit of a unique combination of the strengths of defenders and prospectors, try to minimize the risk while maximizing profit opportunity. In short, analyzers aspire to be good, if not the best, in all performance dimensions as theorized by Miles and Snow (1978) and empirically demonstrated here and elsewhere (Shortell and Zajac 1990). The lack of significance of γ for the analyzers begs some explanation. Organizations with an analyzer-type strategy are already conducting market intelligence activities to some extent, and these activities are the cornerstone of their strategy implementation: extensive marketing surveillance mechanisms (Miles and Snow 1978). Nonetheless, simply analyzing the market may go only so far when the firm is trying to be good at everything. That a market orientation requires acting on (i.e., responsiveness to) market intelligence that is generated and disseminated (Kohli and Jaworski 1990) seems to provide one possible explanation for the general lack of performance gains expected for analyzers. In other words, it might be that the performance benefit of increasing the level of market orientation only through market analysis is limited. Simply engaging in market intelligence activities would not be good enough; it takes focus and responsiveness, or acting on them.
An alternative explanation is that there might be a contingency factor at play that was not modeled in our study. For example, the effects of environmental uncertainty on the market orientation–performance relationship are equivocal at best. Jaworski and Kohli (1993) find no moderating effects of market turbulence, competitive intensity, and technological turbulence on the market orientation–performance relationship. Conversely, Gatignon and Xuereb (1997) implicitly suggest that the payoff from a market orientation might be greater under greater environmental uncertainty. 6 Relating to a turbulent environment, Glazer and Weiss (1993) find that formal information analysis and planning processes (in part required by a market orientation) hinder business performance in quickly changing market environments. In such an environment, it is recommended to avoid high levels of formality in the procedure, because it could lead to overanalyzing the information and diminishing the return on market analysis. In contrast, Jaworski and Kohli (1993) find no moderating effects of market turbulence, competitive intensity, and technological turbulence. Unfortunately, because we did not model environmental uncertainty in our study, we have little basis to conclude one way or the other on this intriguing speculation. These possible explanations indicate that more research is necessary for a full understanding of the nature of environmental contingencies involved in the analyzer types.
It is implicit because their focus was on technology, customer, and competitor orientations, instead of market orientation.
For the defenders, the following observations can be made:
Compared with the other types, prospectors and analyzers, defenders gain the greatest performance benefit in ROI by increasing market orientation level.
However, compared with the other types, defenders appear to lose most in market share, sales growth, and percentage of new product sales (see the negative γ values) by increasing the market orientation level. On market share, sales growth, and percentage of new product sales, they are the worst performers, judging from the mean comparisons.
Recall that defenders are supposed to excel in efficiency, and their product market domains are typically narrow and stable over time. They strive to maintain efficient operations by continuously improving manufacturing capabilities and in-depth market coverage. However, judging from the mean score, the defenders in the sample are not doing very well even on the efficiency measure (ROI): They are tied with the analyzers but lower than the prospectors. According to the γ coefficients, however, defenders were the highest on ROI. Leveraging the highest γ, defenders improving market orientation can increase the level of ROI, on which they currently fail to excel but aspire to improve. More important, in contrast to the ROI case, they would lose the most in market share, sales growth, and percentage of new product sales by increasing the level of market orientation. This is a dilemma for defenders; an attempt to increase one relative measure of performance may lead to decreasing other measures that they consider secondary but nonetheless important aspects of business in general. The implication is significant: There might be a trade-off between choosing a strategy and implementing a market orientation, and defender-type companies should be aware of this trade-off.
Finally, regarding prospectors,
Prospectors benefit from the greatest gain, over both analyzers and defenders, in market share, sales growth, and percentage of new product sales by increasing market orientation level.
Judging from the mean comparisons, prospectors are the best performers in every performance measure. However, they can still expect positive gains in ROI.
Growth for prospectors primarily comes from new market and product developments. They are innovators and thus often find technological innovation expensive and not as efficient as do competitors focused on standardization (e.g., defenders). However, the mean performance scores in this study's data indicate otherwise: Prospectors do well on all dimensions on the basis of the mean score. This is somewhat surprising, though one empirical study reports similar results (Shortell and Zajac 1990). Even better news is that they can further expect greater gains compared with the others. On the basis of the γs, relative to the other two types, prospectors can gain the most performance benefit in market share, sales growth, and percentage of new product sales measures by increasing the market orientation level. These are the areas in which prospectors should do, and are doing, well. If the prospectors’ strategy type was the most proactive business strategy of all (Aragón-Correa 1998), these organizations would be the most sustainable in environmental changes and capable of producing consistently high performance (Jennings and Zandbergen 1995). This study provides empirical support for this argument as far as the current level of mean performance score (Table 3) is concerned. The relevance for marketing scholars and practitioners is that a market orientation is critical for prospectors to achieve and maintain their high performance levels. A high market orientation leading to a greater marketing competency is consistent with Conant, Mokwa, and Varadarajan's (1990) finding that the prospectors’ marketing competencies are superior to those of other firm types. Prescriptively speaking, prospectors should try to maintain or even increase the current level of market orientation, which could even improve the sustainability of the organization. If all the results of hypothesis testing are taken together, a market orientation and the prospector strategy are the most positive performance contingency relationship of all.
Future Research Issues and Limitations
Several additional future research directions can be suggested on the basis of the limitations of this study. The first is fundamentally a theoretical one. Although it is our position (and our data's suggestion) that there is no direct path from the strategy type to a market orientation, it by no means negates the potential that a mediating factor exists between strategy type and market orientation. 7 For example, strategy type may determine a type of corporate culture, which in turn may influence the level of market orientation. More research on the relationships among these three related but distinct constructs and establishment of the relevant culture dimensions to the scale are warranted.
We are grateful for this suggestion made by an anonymous JM reviewer.
Second, economic performance of the business was chosen as the measure of business performance, which in a more general sense may include some noneconomic aspects. As business performance is multifaceted, investigating market orientation's implications on other performance criteria should make an important contribution to the body of knowledge. They include, but are not limited to, customer satisfaction, customer retention, social acceptance, corporate image, and employee satisfaction. Whether the strategy type moderates the relationships between market orientation and these noneconomic performance measures is intriguing and should be explored in future studies.
The sample consisted of marketing executives of business units in manufacturing companies and thus excluded the service sector, which continues to increase in importance in the economy. Prior empirical studies on market orientation were also based on samples of manufacturers. Because providing more and consistent reference points is a useful contribution at the current stage of market orientation research, we decided to limit the sample frame to manufacturing companies in the United States. Furthermore, we sought only marketing executives for their responses. Because of their professional and educational backgrounds and the focus of attention—which may well be different from other functional executives—their responses should be interpreted with caution. Replications of the study with different samples should provide additional insights on the representativeness of the respondents. Such replications with different samples should render proper qualifications to the results of this study.
The validity of the results is also dependent on the validity of the measures used in this study. As market orientation refers to a firm's attentiveness and responsiveness to external environments, it has a clear implication to strategy formulation and therefore the realized strategy type. Unfortunately, it was not possible to establish the discriminant validity between the MO scale and the measures of strategy type by using a rigorous method such as confirmatory factor analysis, because the strategy type measures were categorical variables. Although market orientation and strategy type are conceptually related but distinct and our data analysis suggests no statistically significant relationship between the level of market orientation and strategy type measures, empirical confound is still a possibility. Resolution of this issue through the use of noncategorical measures of strategy type, and subsequent more rigorous analysis, is left to further research.
The cross-sectional survey research design that relies on a single informant per organization has its own limitations. In addition to the reliability of a single informant, one important issue is the extent of common method bias (the same respondent rating market orientation, strategy types, and all the other measures on the same survey instrument). Use of longitudinal studies, multiple informants, and multiple methods should be considered in the future to enable researchers to examine closely the extent to which such a bias is present.
Footnotes
Measures

| Construct | Item Number | Item | Source |
|---|---|---|---|
| IG | V1 | We poll end users at least once a year to assess the quality of our products and services. | Jaworski and Kohli (1993) |
| V2 | In our business unit, intelligence on our competitors is generated independently by several departments. | Jaworski and Kohli (1993) | |
| V3 | We periodically review the likely effect of changes in our business environment (e.g., regulation) on customers. | Jaworski and Kohli (1993) | |
| V4 | In this business unit, we frequently collect and evaluate general macroeconomic information (e.g., interest rate, exchange rate, gross domestic product, industry growth rate, inflation rate). | Newly developed | |
| V5 | In this business unit, we maintain contacts with officials of government and regulatory bodies (e.g., Department of Agriculture, Food and Drug Administration, Federal Trade Commission, Congress) in order to collect and evaluate pertinent information. | Newly developed | |
| V6 | In this business unit, we collect and evaluate information concerning general social trends (e.g., environmental consciousness, emerging lifestyles) that might affect our business. | Newly developed | |
| V7 | In this business unit, we spend time with our suppliers to learn more about various aspects of their business (e.g., manufacturing process, industry practices, clientele). | Newly developed | |
| V8 a | In our business unit, only a few people are collecting competitor information. | Newly developed | |
| ID | V9 | Marketing personnel in our business unit spend time discussing customers’ future needs with other functional departments. | Jaworski and Kohli (1993) |
| V10 | Our business unit periodically circulates documents (e.g., reports, newsletters) that provide information on our customers. | Jaworski and Kohli (1993) | |
| V11 | We have cross-functional meetings very often to discuss market trends and developments (e.g., customers, competition, suppliers). | Newly developed | |
| V12 | We regularly have interdepartmental meetings to update our knowledge of regulatory requirements. | Newly developed | |
| V13 | Technical people in this business unit spend a lot of time sharing information about technology for new products with other departments. | Newly developed | |
| V14 | Market information spreads quickly through all levels in this business unit. | Newly developed | |
| RESP | V15 a | For one reason or another, we tend to ignore changes in our customers’ product or service needs. | Jaworski and Kohli (1993) |
| V16 a | The product lines we sell depend more on internal politics than real market needs. | Jaworski and Kohli (1993) | |
| V17 a | We are slow to start business with new suppliers even though we think they are better than existing ones. | Newly developed | |
| V18 | If a major competitor were to launch an intensive campaign targeted at our customers, we would implement a response immediately. | Jaworski and Kohli (1993) | |
| V19 | The activities of the different departments in this business unit are well coordinated. | Jaworski and Kohli (1993) | |
| V20 a | Even if we came up with a great marketing plan, we probably would not be able to implement it in a timely fashion. | Jaworski and Kohli (1993) | |
| V21 | If a special interest group (e.g., consumer group, environmental group) were to publicly accuse us of harmful business practices, we would respond to the criticism immediately. | Newly developed | |
| V22a | We tend to take longer than our competitors to respond to a change in regulatory policy. | Newly developed | |
| Performance—SOM | V23 | Our business unit's market share growth in our primary market last year. | Newly developed |
| Performance—SGRO | V24 | Our business unit's sales growth relative to major competitors last year. | Newly developed |
| Performance—PCTNP | V25 | Percentage of sales generated by new products last year relative to major competitors. | Newly developed |
| Performance— | V26 | Our business unit's ROI relative to major competitors last year. | Newly developed |
| Strategy type—defender | V27, Type 1 | This type of business unit attempts to locate and maintain a secure niche in a relatively stable product or service area. The business unit tends to offer a more limited range of products or services than its competitors, and it tries to protect its domain by offering higher quality, superior service, lower prices, and so forth. Often this business unit is not at the forefront of developments in the industry—it tends to ignore industry changes that have no direct influence on current areas of operation and concentrates instead on doing the best job possible in a limited area. | Snow and Hrebiniak (1980); McDaniel and Kolari (1987) Categorical variable |
| Strategy type—prospector | V27, Type 2 | This type of business unit typically operates within a broad product-market domain that undergoes periodic redefinition. The business unit values being “first in” in new product and market areas even if not all of these efforts prove to be highly profitable. This organization responds rapidly to early signals concerning areas of opportunity, and these responses often lead to a new round of competitive actions. However, this business unit may not maintain market strength in all of the areas it enters. | Snow and Hrebiniak (1980); McDaniel and Kolari (1987) |
| Categorical variable | |||
| Strategy type—analyzer | V27, Type 3 | This type of business unit attempts to maintain a stable, limited line of products or services while at the same time moving quickly to follow a carefully selected set of the more promising new developments in the industry. This organization is seldom “first in” with new products and services. However, by carefully monitoring the actions of major competitors in areas compatible with its stable product-market base, this business unit can frequently be “second in” with a more cost-efficient product or service. | Snow and Hrebiniak (1980); McDaniel and Kolari (1987) |
| Categorical variable | |||
| Strategy type—reactor | V27, Type 4 | This type of business unit does not appear to have a consistent product-market orientation. This organization is usually not as aggressive in maintaining established products and markets as some of its competitors, nor is it willing to take as many risks as other competitors. Rather, this type of business unit responds in those areas where it is forced to by environmental pressures. | Snow and Hrebiniak (1980); McDaniel and Kolari (1987) |
| Categorical variable |
Indicates a reverse-coded item.
Profile of 1300 Companies: 300 Companies (Pretest Sample) and 1000 Companies (Final Sample)

| Pretest Sample Profile |
|||||
|---|---|---|---|---|---|
| Employee Size | Count | % | Annual Sales Volume | Count | % |
| 20–49 | 1 | .33% | $10 million–20 million | 51 | 17.00% |
| 50–99 | 3 | 1.00% | $20 million–50 million | 137 | 45.67% |
| 100–249 | 145 | 48.33% | $50 million 100 million | 62 | 20.67% |
| 250–499 | 89 | 29.67% | $100 million–500 million | 45 | 15.00% |
| 500–999 | 37 | 12.33% | $500 million–1 billion | 4 | 1.33% |
| 1000–4999 | 24 | 8.00% | >$1 billion | 1 | .33% |
| 5000–9999 | 1 | .33% | |||
| 10,000+ | 0 | .00% | |||
| Total | 300 | Total | 300 | ||
|
|
|||||
|
|
|
|
|
|
|
| 20–49 | 3 | .30% | $10 million–20 million | 147 | 14.70% |
| 50–99 | 10 | 1.00% | $20 million–50 million | 530 | 53.00% |
| 100–249 | 520 | 52.05% | $50 million–100 million | 199 | 19.90% |
| 250–499 | 323 | 32.33% | $100 million–500 million | 118 | 11.80% |
| 500–999 | 109 | 10.91% | $500 million–1 billion | 3 | .30% |
| 1000–4999 | 32 | 3.20% | >$1 billion | 3 | .30% |
| 5000–9999 | 1 | .10% | |||
| 10,000+ | 1 | .10% | |||
| Not available | 1 | .10% | |||
| Total | 1000 | Total | 1000 | ||
Correlation Matrix
| IG | ID | RESP | MO | KJIG | KJID | KJRESP | KJMO | ROI | SOM | SGRO | PCTNP | |
|---|---|---|---|---|---|---|---|---|---|---|---|---|
| IG | 1.000 | .588 | .383 | .826 | .669 | .471 | .461 | .651 | .264 | .157 | .179 | .201 |
| . | .000 | .000 | .000 | .000 | .000 | .000 | .000 | .000 | .003 | .001 | .000 | |
| ID | 1.000 | .484 | .838 | .529 | .743 | .569 | .713 | .214 | .229 | .190 | .192 | |
| . | .000 | .000 | .000 | .000 | .000 | .000 | .000 | .000 | .000 | .000 | ||
| RESP | 1.000 | .766 | .395 | .563 | .821 | .729 | .426 | .376 | .386 | .320 | ||
| . | .000 | .000 | .000 | .000 | .000 | .000 | .000 | .000 | .000 | |||
| MO | 1.000 | .663 | .722 | .759 | .860 | .375 | .313 | .312 | .295 | |||
| . | .000 | .000 | .000 | .000 | .000 | .000 | .000 | .000 | ||||
| KJIG | 1.000 | .440 | .501 | .812 | .239 | .170 | .176 | .247 | ||||
| . | .000 | .000 | .000 | .000 | .001 | .001 | .000 | |||||
| KJID | 1.000 | .626 | .768 | .257 | .242 | .241 | .188 | |||||
| . | .000 | .000 | .000 | .000 | .000 | .000 | ||||||
| KJRESP | 1.000 | .881 | .363 | .372 | .349 | .318 | ||||||
| . | .000 | .000 | .000 | .000 | .000 | |||||||
| KJMO | 1.000 | .355 | .323 | .315 | .318 | |||||||
| . | .000 | .000 | .000 | .000 | ||||||||
| ROI | 1.000 | .345 | .450 | .407 | ||||||||
| . | .000 | .000 | .000 | |||||||||
| SOM | 1.000 | .764 | .446 | |||||||||
| . | .000 | .000 | ||||||||||
| SGRO | 1.000 | .491 | ||||||||||
| . | .000 | |||||||||||
| PCTNP | 1.000 | |||||||||||
| . |
Notes: Figures represent Pearson correlation and p-value. KJMO = the original 32-item scale; indicators preceded by “KJ” are from Kohli and Jaworski's (1990) scale.