
Abstract
The authors report a repeated measures field study that captures complaining customers' perceptions of their overall satisfaction with the firm, likelihood of word-of-mouth recommendations, and repurchase intent during a 20-month span that includes two service failures and recovery attempts. The findings suggest that though satisfactory recoveries can produce a “recovery paradox” after one failure, they do not trigger such paradoxical increases after two failures. Furthermore, “double deviations” can occur following two consecutive unsatisfactory recoveries or following an unsatisfactory recovery in response to a second failure. The findings indicate that customers reporting an unsatisfactory recovery followed by a satisfactory recovery reported significantly higher ratings at the second postrecovery period than did customers reporting the opposite recovery sequence. The outcome of the second recovery also demonstrated a significant influence on customer ratings (positively if the recovery was satisfactory, negatively if the recovery was unsatisfactory), regardless of whether the customer found the first recovery satisfactory or unsatisfactory. In addition, although the increased change in recovery expectations and failure severity ratings from the first failure to the second is more dramatic for customers who previously reported a satisfactory recovery, the increase in attributions of blame toward the firm is more pronounced for customers who previously reported an unsatisfactory recovery. Last, the results show that recovery efforts are attenuated when two similar failures occur and when two failures happen in close time proximity.
Although these studies have proved informative, they have focused only on a single failure and recovery effort. Because many service relationships are ongoing, however, customers will likely experience multiple failures over the course of a relationship. Yet it remains unclear how complainants would respond to multiple failures and recovery efforts, which suggests a need for longitudinal studies examining the dynamics of complainant perceptions over time. Such studies would help scholars and managers better understand the updating processes that complainants use in evaluating service firms. Although some longitudinal studies have examined customer satisfaction and intention (e.g., Bolton and Lemon 1999; LaBarbera and Mazursky 1983; Mittal, Kumar, and Tsiros 1999; Oliver 1980), none has explored within-subject perception changes following multiple failures and recoveries.
We present a 20-month longitudinal field study that investigates within-subject evaluations of overall satisfaction with the firm, word-of-mouth (WOM) recommendations, and repurchase intent at key intervals following two customer-initiated complaints and the ensuing recovery efforts. We explore between-subject mean variations over time, depending on whether customers report satisfactory or unsatisfactory recoveries. We also consider the roles of failure severity, attributions of blame toward the firm, recovery expectations, failure similarity and type, and the time between failures in the updating process.
Conceptual Framework and Hypotheses
The Influence of Multiple Failures on Complainant Perceptions
Three extant theories suggest that multiple service failures diminish paradoxical increases in customer perceptions of firms following recovery efforts and magnify double deviation dips. Prospect theory suggests that losses are weighed more heavily than gains (Kahneman and Tversky 1979; Oliver 1997), and similarly, asymmetric disconfirmation proposes that negative performances have greater influence on satisfaction and purchase intentions than positive performances do (Mittal, Ross, and Baldasare 1998). As such, several positive experiences may be needed to overcome one negative event, and customers reporting two failures may rate the firm lower despite effective recovery efforts. Likewise, Mittal, Ross, and Baldasare (1998) find that each additional unit of positive performance has diminishing value. When a second failure occurs, complainants may focus more on the negative consequences associated with the failure, because these negative perceptions are more memorable. Thus, complainants may become desensitized to satisfactory recovery efforts, thereby mitigating their positive effects. Accordingly, satisfactory recoveries may yield paradoxical gains only in the short run. (Satisfactory recoveries in this study refer to complainant ratings above the midpoint on a three-item summated scale, and unsatisfactory recoveries refer to complainant ratings at or below the midpoint on the same three-item summated scale.)
Attribution theory also suggests diminishing complainant ratings following multiple failures. Take, for example, a situation in which bank customers complain about overcharges on their statements. Given that the bank successfully resolves the complaint, attribution theory suggests that complainants may believe that the failure was unique or due to a circumstance beyond the bank's control (i.e., an unstable attribution) (Folkes 1988). In such cases, customers may feel more positive about the firm than before the failure, triggering a recovery paradox. If another failure occurs, though, complainants may discount the circumstantial attribution and instead believe that the firm consistently makes mistakes (i.e., a stable attribution). That is, when multiple failures occur, complainants will likely reevaluate their attributions. Given that, as Weiner (2000, p. 384) has argued, “one cannot logically make unstable attributions for repeated events,” customers will likely infer that multiple failures are due to problems inherent to the firm. In such cases, complainants feel heightened discontent when firms do not recover satisfactorily from two failures, generating a double deviation effect. Similarly, even consistently satisfactory recoveries may have a tempered impact following multiple failures. As such, we offer three hypotheses: 1
From a between-subjects view, it is possible that satisfactory recoveries still spawn double deviations because of the dissatisfaction associated with a failure in the first place. Likewise, unsatisfactory recoveries can result in paradoxical increases just because customers are pleased that a firm at least tried to recover. Thus, the paradox and double deviation effect are not competing hypotheses.
Despite perceiving two satisfactory recoveries, customers reporting two failures will rate their postrecovery overall satisfaction with the firm, repurchase intent, and favorable WOM lower than their prefailure ratings for those same variables (no paradoxical increase in perceptions of the firm).
Customers perceiving two unsatisfactory recoveries following two reported failures will rate their postrecovery overall satisfaction with the firm, repurchase intent, and favorable WOM lower than their ratings after the second failure for the same variables (a double deviation effect).
For customers perceiving two unsatisfactory recoveries, the magnitude of the decrease in ratings in overall satisfaction with the firm, repurchase intent, and favorable WOM from postfailure to postrecovery falls more sharply after the second failure than after the first failure (heightened discontent).
The Effects of Mixed Recoveries over Time
Although we expect diminishing service recovery returns following two satisfactory recoveries, complainants still may show a preference for when a satisfactory recovery occurs in a sequence of recoveries. Research on decision making suggests that people prefer an improving series of outcomes. For example, Ross and Simonson (1991) presented subjects with hypothetical scenarios ending with a loss (e.g., win $85 and then lose $15) versus a gain (lose $15 and then win $85). The subjects strongly preferred the scenario ending in a gain. Loewenstein and Prelec (1993) similarly argue that when a timing trade-off is involved with sequential outcomes, people become more farsighted and will prefer the sequence ending in positive rather than negative outcomes. Such effects may be explained by a recency effect (Ross and Simonson 1991) and an element of prospect theory, namely, loss aversion (Kahneman and Tversky 1979). The recency effect suggests that events occurring most recently are also most salient and are weighed more heavily when people judge the overall sequence of outcomes. Loss aversion likewise suggests that when a sequence goes from a gain to a loss, people will weigh the loss more heavily, making this sequence less attractive than a sequence going from a loss to a gain.
Overall satisfaction with the firm, repurchase intent, and favorable WOM ratings after the second recovery are higher for customers perceiving an unsatisfactory/satisfactory (US) sequence than for those perceiving a satisfactory/unsatisfactory (SU) sequence (ratings for US > ratings for SU at post–Recovery 2).
Similar logic suggests that an unsatisfactory recovery followed by a satisfactory recovery will result in improved customer ratings over time, despite the customer reporting a prior unsatisfactory recovery. Consistent with our previous hypotheses, low ratings are likely to occur when a first failure is followed by an unsuccessful recovery. When a second failure occurs followed by a successful recovery, however, complainants will likely focus on their most recent experience and adjust their ratings upward. Thus, ratings are likely to improve when complainants experience a US recovery sequence, which is consistent with a recency effect (Ross and Simonson 1991).
We also posit that a satisfactory recovery followed by an unsatisfactory recovery will generate a double deviation effect. When complainants perceive a satisfactory recovery, they often give the firm higher ratings. However, these complainants are also likely to update their expectations upward (Grayson and Ambler 1999). Prospect theory and asymmetric disconfirmation theory suggest that negative performances influence customer affect more than positive performances. Complainants experiencing two negative events (second failure and unsatisfactory recovery) following a satisfactory first recovery likely weigh the negative events more heavily than the satisfactory recovery, which results in significant rating dips. Such dips are also consistent with a recency effect (Ross and Simonson 1991).
Despite perceiving an unsatisfactory (satisfactory) first recovery, customers perceiving a satisfactory (unsatisfactory) second recovery, that is, a US sequence (SU sequence), will report increases (decreases) in their ratings of overall satisfaction with the firm, repurchase intent, and favorable WOM from post–Failure 2 to post–Recovery 2 (a recency effect).
Expectations, Contextual Influences, and the Downside of Service Recovery
Service recovery expectations
Consistent with prior research, we conceptualize service recovery expectations as customers' predictions regarding the extent to which a firm will handle their complaint (Boulding et al. 1993; Oliver 1997). Some researchers assert that postcomplaint handling evaluations increase when expectations are met or exceeded (Tax and Brown 1998), whereas other researchers suggest that expectations increase over time (Boulding et al. 1993; Grayson and Ambler 1999). However, research has not explored how customers in ongoing service relationships update their recovery expectations after reporting multiple failures. Given that negative events are salient and easily recalled, customers previously reporting one failure will likely consider their prior experience when predicting what to expect after a second failure. Complainants are more likely to attribute one failure to bad luck or causes outside the firm's control and expect only moderate redress. When another failure occurs, however, they are likely to attribute a stable pattern of failures to the firm (Weiner 2000). To the extent that this pattern is blamed on the firm, complainants will expect more extensive redress after the second failure than after the first.
Furthermore, although complainants perceiving satisfactory recoveries may rate the firm higher for its efforts (e.g., recovery paradox), they are also likely to view the solid performance as a signal to adjust future recovery expectations upward. Such adjustments are theoretically consistent with forward assimilation, in which expectations become consistent with satisfaction (Oliver and Burke 1999). Conversely, expectations should not rise as much for complainants who previously perceived an unsatisfactory recovery, partly because the past experience offers a cue that future recoveries may also be weak. Thus, complainants perceiving a satisfactory recovery after a first failure will hold higher recovery expectations for a second failure. Accordingly, the downside of recovering well is managing higher expectations in the future.
Customers reporting two failures have higher recovery expectations for the second failure than for the first failure.
The magnitude of the increase in recovery expectations from the first to the second failure is greater for customers perceiving a satisfactory first recovery than for customers perceiving an unsatisfactory first recovery.
Failure severity
Customer evaluations decline as service failures become more severe (Smith, Bolton, and Wagner 1999). However, what happens to severity perceptions when two failures are reported? Because one unit of loss is more salient than one unit of gain, customers may more easily recall a failure incident than the recovery effort that followed. It seems evident that complainants experiencing a second failure will have inflated perceptions of severity when they still recall the first failure (Seiders and Berry 1998). Although the recovery paradox suggests that satisfactory recoveries enhance complainant evaluations, the service firm must then manage the higher expectations that are likely to follow. From an attribution perspective, customers reporting two failures may sense a pattern of negative performances. As such, customers may recall the first failure and combine its losses with those they perceive following the second failure. These complaining customers may begin viewing the failures as stable problems inherent to the firm. Furthermore, customers may perceive the sequential failures as one overall failure, ultimately heightening the severity of the second failure. Previously unsatisfied complainants will likely report higher severity perceptions because of the magnified discontent stemming from experiencing two failures. However, we expect that previously satisfied complainants will report greater increases in perceived failure severity than previously unsatisfied complainants, partly because of their higher expectations.
Customers reporting two failures will rate the second failure as more severe than the first failure.
The magnitude of the increase in the perceived severity of the failure from the first to the second failure is larger for customers perceiving a satisfactory first recovery than for customers perceiving an unsatisfactory first recovery.
Attributions of blame
Customers engage in causal thinking to ascertain why a failure occurred (Weiner 2000). Attributions of blame, which we define as the extent to which customers hold the seller responsible for a failure, can be instrumental in shaping responses to failures. Researchers conclude that some complainants blame firms for failures even when the firm is not actually responsible (Folkes and Kotsos 1986), and complainants who believe that firms are responsible for failures will be more likely to expect redress (e.g., discounts, apologies, refunds). For example, Folkes (1984) asked respondents to recall a recent restaurant experience when they were unsatisfied with the taste of their food or beverage and to explain why they were unsatisfied. The results showed that attributions of blame toward the restaurant strongly influenced whether customers believed that they deserved apologies and refunds.
Our research extends this literature by examining how blame attributions change when more than one failure is reported. When one failure is reported and the firm responds well, complainants may attribute the failure to a circumstantial cause or consider it a distinct occurrence (unstable attribution). If the firm has multiple failures, complainants may attribute the failures to causes that are consistent and stable to the firm. It follows that attributions of blame toward the firm will increase after multiple failures are reported. We also contend that attributions will be more pronounced among complaining customers who previously perceived an unsatisfactory recovery than for those who previously perceived a satisfactory recovery, partly because they now perceive multiple problems (i.e., two failures and one unsatisfactory recovery) that are no longer considered inconsistent and “unstable.”
Customers reporting two failures will attribute blame for the failures to the firm more strongly after the second failure than after the first failure.
The magnitude of the increase in blame attributions from the first to the second failure is larger for customers who report an unsatisfactory first recovery than for customers who report a satisfactory first recovery.
Lag between failures
Failures occurring over a short period are likely to affect complainants' perceptions more negatively than failures separated by longer periods of time. Given the prospect theory view that losses are weighed more heavily than gains, it may take several positive experiences to temper the effects of a single failure. Customers reporting two failures without a considerable time frame filled with satisfactory experiences will likely perceive higher discontent and lower ratings at the time of the second complaint (Seiders and Berry 1998). Similarly, complainants reporting two failures within a relatively short time period will easily recall the first failure. These customers may view the two failures as one larger failure, likely creating more demanding customers and possibly mitigating satisfactory recovery efforts. Given that the median time interval between failures in our study was four months, we classify a “short” time interval as four months or less and a “longer” time interval as five months or more.
Customers reporting two failures within a relatively short time interval have lower post–Failure 2 ratings for overall satisfaction with the firm, repurchase intent, and favorable WOM (compared with customers who report two failures over a longer time interval).
Customers reporting two failures within a relatively short time interval have lower post–Recovery 2 ratings for overall satisfaction with the firm, repurchase intent, and favorable WOM (compared with customers who report two failures over a longer time interval).
Failure similarity
Not only can multiple failures lead to consumer discontent, but also this discontent can be magnified when the same failure occurs (Seiders and Berry 1998). From an attribution theory perspective, similar failures may lead complainants to believe that the firm consistently makes the same errors without improving—a stable internal attribution toward the firm. In addition, consumers reporting two similar failures are more likely to hold the firm responsible for making consistent mistakes, making it more difficult for firms handling two similar complaints to recover well. Conversely, when two different failures occur, complainants may be more likely to either attribute the failures to circumstantial, nonfirm factors or view them as distinct anomalies and thus may not evaluate the firm as harshly.
Customers reporting two similar failures have lower post–Failure 2 ratings for overall satisfaction with the firm, repurchase intent, and favorable WOM (compared with customers who report two different failures).
Customers reporting two similar failures have lower post–Recovery 2 ratings for overall satisfaction with the firm, repurchase intent, and favorable WOM (compared with customers who report two different failures).
Methods
Sample, Procedures, and Measures
We conducted a repeated measures (RM) field study with bank complainants across a 20-month time span. We focused on customers who registered complaints about their banking experiences at one of 116 branches of an industry-leading bank. At four time periods, respondents completed surveys that assessed perceptions from six time periods: pre–Failure 1 (i.e., T1a); post–Failure 1 (i.e., T1b); post–Recovery 1, approximately two weeks after the first recovery effort (i.e., T2); pre–Failure 2 (i.e., T3a); post–Failure 2 (i.e., T3b); and post–Recovery 2, approximately two weeks after the second recovery effort (i.e., T4). As in other behavioral research involving imperfect correlations, the repeated measures aspect of our design may generate some degree of regression toward the mean. Figure 1 offers a time line of measurement for all constructs in the study, and the measurement procedures are described subsequently.

Time Line of Measurement
Time Period 1: pre–Failure 1 (T1a)
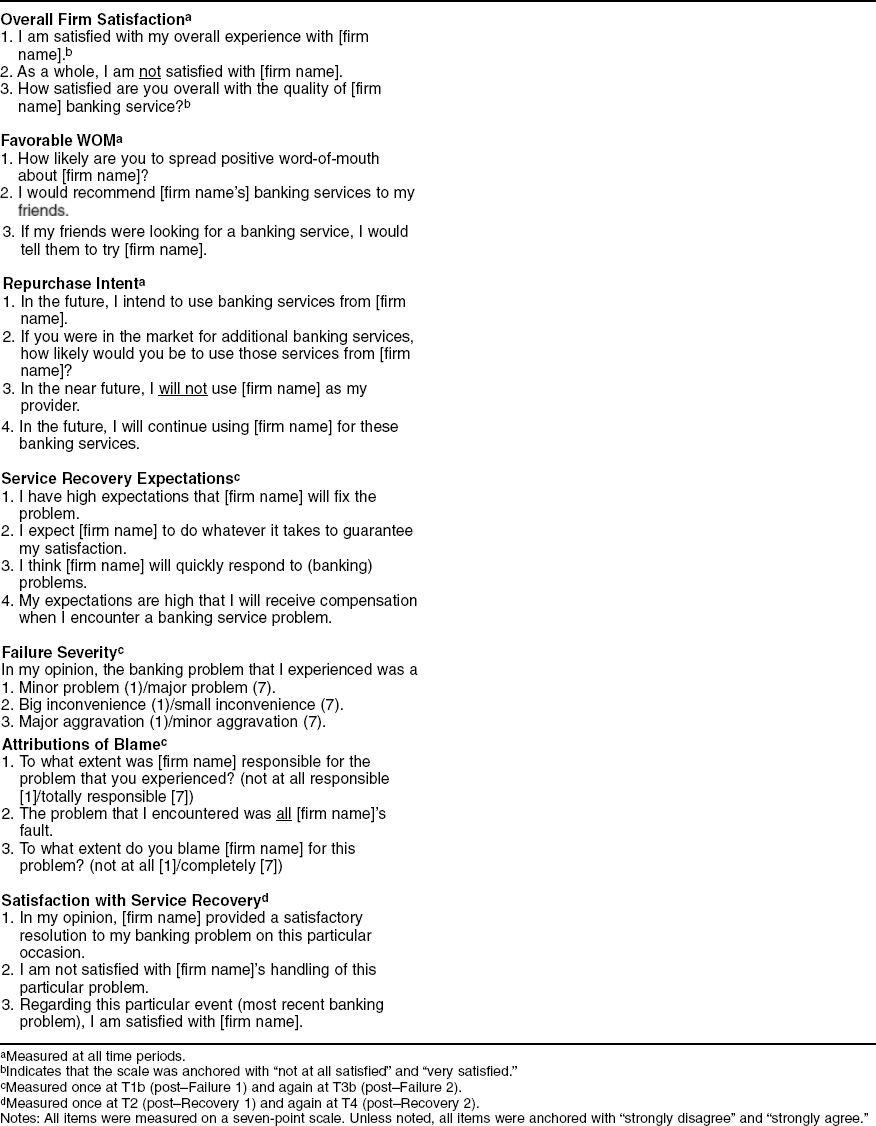
Upon complaining for the first time to any of the branch offices, 1356 customers were asked to participate in the study at Time Period 1. Complainants completed the T1a survey in the bank shortly after registering the complaint. During Time Period 1, bank service agents informed customers that the purpose of the study was to improve the bank's service efforts and that the study consisted of several parts. When customers agreed to fully participate in the study, the service agent distributed the pre–Failure 1 survey (T1a), asking customers to think retrospectively about all their experiences with the bank up to the recent service failure (i.e., past perceptions excluding the service failure). These experiences may have included past banking service availability, support, services offered, ease of use, customer service, and so forth. Customers were then instructed to rate prefailure overall satisfaction with the firm, repurchase intent, and favorable WOM likelihood. These constructs were measured with three, four, and three items, respectively, drawn from the extant literature (e.g., Cronin and Taylor 1994).
Time Period 1: post–Failure 1 (T1b)
After completing the prefailure part of the survey (T1a), the 1356 customers were then asked to think about all their experiences with the bank up until that moment. This post–Failure 1 part of the survey (T1b) asked customers to rate their perceptions of overall satisfaction with the firm, repurchase intent, and WOM after experiencing a service failure, using items identical to those used in the T1a survey. In addition, the T1b survey asked respondents to rate their perceptions regarding service recovery expectations, attributions of blame, and failure severity. A four-item recovery expectation measure, adapted from McCollough, Berry, and Yadav (2000), asked respondents to rate the extent to which they expected the firm to effectively recover from the failure. A four-item attribution measure asked respondents to indicate the extent to which the firm was responsible for the failure, and a three-item failure severity measure asked customers to indicate the severity of the failure they reported. Respondents also provided some demographic information.
Time Period 2: post–Recovery 1 (two weeks after recovery, T2)
In Time Period 2, the same measures of overall satisfaction with the firm, repurchase intent, and WOM were gathered along with a three-item satisfaction with service recovery measure (Cronin and Taylor 1994). This T2 survey was administered to customers who completed both T1a and T1b and was mailed one week after the bank concluded its recovery efforts (with hopes of reaching the customer within two weeks after recovery). The bank offered incentives to participate, and research assistants telephoned customers as a reminder to respond. Of the surveys mailed, 692 usable responses were collected and matched to T1a and T1b—a 51% response rate for Failure/Recovery 1.
Second failure and recovery data collection
Customers who reported a second failure were asked to complete surveys representing perceptions and recovery efforts for the second failure. The mean time lapse between the two failures was 6.63 months, and approximately 75% of the customers who reported a second failure did so within nine months. Of the 692 respondents who completed all surveys involving the first failure, 312 complained to the bank about a second failure. Of those, 255 completed all portions of the study across four time periods. These 255 constituted the sample used in our study. The interviewing schedule; data collection procedures; and measures for pre–Failure 2 (T3a), post–Failure 2 (T3b), and post–Recovery 2 (T4) mirrored the three surveys involving the first failure and recovery effort.
Time Period 3: pre–Failure 2 (T3a)
At Time Period 3, respondents who registered a second complaint completed the second prefailure survey inside the bank. The T3a survey asked customers to think retrospectively about all their banking experiences with the bank up until the most recent service failure (i.e., past perceptions). Respondents then rated their overall satisfaction with the firm, favorable WOM likelihood, and repurchase intent prior to the second failure. To validate our T3a pre–Failure 2 retrospective measures, we compared the raw mean scores of the post–Recovery 1 measures and the corresponding pre–Failure 2 measures. There were no significant differences (t-values ranged from -.281 to .864). As such, the post–Recovery 1 means, collected on average 6.63 months prior to our pre–Failure 2 measures, did not differ from our pre–Failure 2 measures.
Time Period 3: post–Failure 2 (T3b)
Also in Time Period 2, after completing the prefailure survey, respondents were asked to think about all their experiences with the bank, including the most recent service failure. The post–Failure 2 survey (T3b survey) asked customers to rate their current perceptions of overall satisfaction with the firm, repurchase intent, and WOM. The T3b survey also asked customers to rate their perceptions regarding service recovery expectations, attributions of blame, and failure severity after Failure 2.
Time Period 4: post–Recovery 2 (two weeks after recovery, T4)
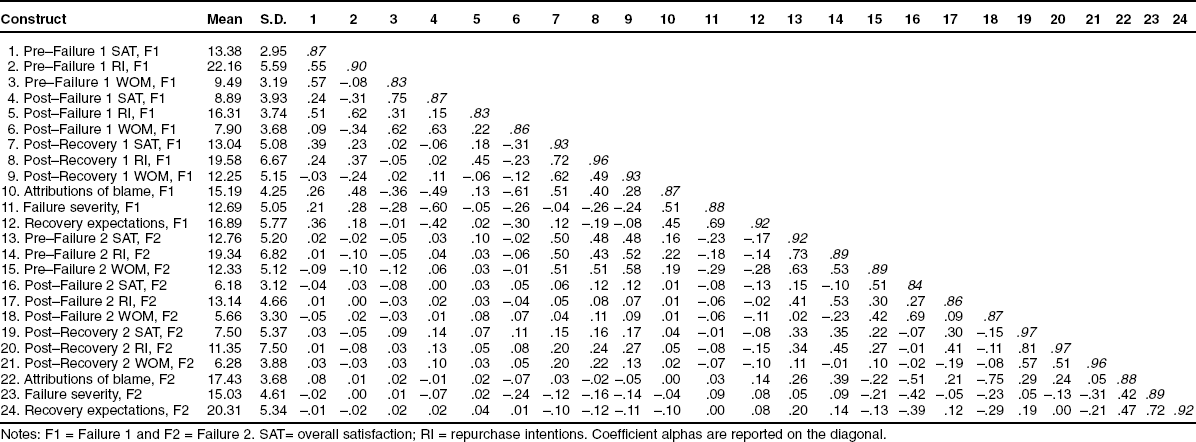
In the fourth time period, the second postrecovery survey gathered measures of overall satisfaction with the firm, repurchase intent, WOM, and satisfaction with service recovery (identical to T2). The second postrecovery survey (T4 survey) was mailed to customers who completed all five previous portions of the study, which resulted in our sample size of 255. All items across all surveys were measured with seven-point scales and are shown in Appendix A. The raw means and standard deviations for all measures, as well as the correlations among measures, are shown in Appendix B. Across all surveys, coefficient alpha estimates for all measures ranged from .83 to .97. 2
We conducted a test of discriminant validity among constructs by comparing the average variance extracted estimates of all construct pairs with the phi correlation squared of the respective pairs (Fornell and Larcker 1981). We found discriminant validity across all pairs of constructs, time periods, and surveys. The phi correlations among constructs ranged from .83 (overall satisfaction with the firm and WOM of the first failure and recovery) and -.29 (failure severity and repurchase intent of the first failure and recovery). This information is available on request.
We also collected data regarding the type of failure. Consistent with other service research, bank representatives logged failures as either “core” failures or “process” failures (Gilly and Gelb 1982; Smith, Bolton, and Wagner 1999). Core failures refer to monetary-oriented complaints that involve a problem with the product offering (e.g., incorrect account postings, overcharges, faulty overdraft protection). Of the 223 core failures reported (i.e., 88 at Failure 1 and 135 at Failure 2), 43% involved nonsufficient funds overdraft fees, 27% involved incorrect account postings, and 16% involved interest or automated teller machine overcharges. Recovery strategies for these failures included waiving some or all of the questioned fees, accurately adjusting account balances, and offering conscientious customer service (e.g., listening, empathizing, apologizing). Process failures were defined as problems with the way the bank provided the service (e.g., procedures, personal interactions). Of the 287 process failures (167 at Failure 1 and 120 at Failure 2), 37% involved queuing/waiting times or processes, 32% involved policies and procedures that restricted on-site banking access (versus electronic access) to low-volume customers, and 26% involved poor customer service (e.g., discourteous employees). Recovery strategies for these complaints focused on offering customers flexible and accommodating options, making policy or procedural exceptions, and providing caring personal interactions.
The sample exhibited the following demographic characteristics: 56% of the respondents were women, 42% were between 35 and 42 years of age, and 65% held college degrees; 66% of the sample had used the bank's services for at least one year. In addition, the initial complaint (i.e., Failure 1) in this study represented the first complaint recorded by the bank for each respondent, creating a baseline for accurately tracking customers' perceptions regarding their first and second complaint experiences.
Checks for Respondent and Measure Bias
We employed three checks to assess respondent and measure bias. First, the bank provided us with a sample of 316 complainants who did not participate in the study. No significant differences were found among age, sex, type of complaint, account value, or length of relationship between our study respondents and this sample. Second, we collected data from a sample of 276 bank customers who had not reported a failure. The demographic profiles of these 276 noncomplainants were not significantly different from the profiles in our study's sample, not only across data collected in our survey (i.e., age, sex, education, and length of relationship) but also across data collected by the bank (e.g., account value, types of services composing the account portfolio, customer profitability). Furthermore, the noncomplainants' ratings did not differ significantly (p > .10) from our complainants' ratings of overall satisfaction with the firm, repurchase intent, and WOM at T1a (i.e., the pre– Failure 1 ratings). Our complainant sample's postfailure ratings (T1b) of overall satisfaction with the firm, repurchase intent, and WOM were lower than the noncomplainants' ratings on these variables (p < .05).
Third, given that our T1a measure of overall firm satisfaction was retrospective, we compared it with an actual pre-failure satisfaction measure collected by the bank. The bank periodically administered a customer satisfaction survey. The bank's database showed that 97 of our 255 study participants had completed a firm-derived satisfaction measure four months before our study and before they reported any failure. The satisfaction measure stated the following: “Please rate your overall experience with [firm name] bank.” We measured responses using a five-point scale anchored by “unpleasant” and “completely satisfactory.” The correlation of this measure with our prefailure overall firm satisfaction measure was .91. Furthermore, we calibrated our measure such that it had five scale points, making it similar to the bank's measure. The difference between our calibrated measure and the bank's measure was not significant for the n = 97 subsample (mean difference = .03, t = .52, p > .60). In summary, these data checks suggest that rating biases due to respondents or retrospective measures were minimal.
Classification Factors
Before testing our hypotheses, we constructed quantification factors as independent variables in our analyses (Neter et al. 1996). We used the satisfaction with service recovery measure (captured at T2 and T4) to form a two-level variable (i.e., satisfactory and unsatisfactory recovery). We created this between-subjects factor by summing the scores on the items in the scale and then splitting the scores at the scale midpoint into two groups: one perceiving an unsatisfactory first recovery and another perceiving a satisfactory first recovery. Scores for the unsatisfactory group ranged from 3 to 12 (on a 21-point summated scale) and from 13 to 21 for the satisfactory group. We also split the scale for satisfaction with recovery regarding the second recovery at the scale midpoint (i.e., 3 to 12 for the unsatisfactory group and 13 to 21 for the satisfactory group). 3
We also derived the unsatisfactory and satisfactory groups by conducting median splits and cluster analyses on the measures for satisfaction with recovery. For all analyses, these procedures produced results that closely resembled those of the midpoint split we employed.
Data Checks
Before testing the hypotheses, we examined whether the recovery paradox and the double deviation effect existed after one failure and recovery effort. We used RM MANCOVA (multivariate analysis of covariance) with one three-level within-subjects factor (time: pre–Failure 1, post–Failure 1, and post–Recovery 1), one between-subjects factor (recovery: unsatisfactory, n = 112, and satisfactory, n = 143), and three covariates (i.e., recovery expectations, attributions of blame, and severity of Failure 2 compared with Failure 1). The objective of this data check was to investigate whether the paradox and double deviation hold following one failure and satisfactory recovery.
After controlling for the variance attributed to the covariates, we used linearly independent planned comparisons, adjusting for experiment-wide error rate, to compare estimated marginal means. (The effects for all covariates were significant and are available on request.) Our results show that customers reporting a satisfactory recovery rated their postrecovery overall satisfaction (mean = 16.03), repurchase intent (mean = 21.97), and WOM (mean = 15.42) significantly higher than their prefailure ratings for these same variables (satisfaction mean = 13.41, repurchase intent mean = 20.14, WOM mean = 9.74; Wilks' λ = .555, F = 66.17, p < .01), with a large effect size (η2 = .45). The univariate effects for these variables were also significant (p < .01), fully supporting the service recovery paradox for one failure and recovery. Planned comparisons also indicated that customers perceiving an unsatisfactory recovery did not rate postrecovery overall satisfaction (mean = 9.23) and repurchase intent (mean = 16.53) significantly below their postfailure ratings for these variables (satisfaction mean = 8.60, repurchase intent mean = 16.63). Indeed, these customers rated postrecovery WOM likelihood (mean = 8.21) significantly above their postfailure ratings (mean = 6.70) following an unsatisfactory recovery, and this increase drives multivariate significance (Wilks' λ = .955, F = 3.88, p < .01, η2 = .05). As such, the double deviation effect did not occur after one failure and recovery. Note, however, that the postfailure ratings may be susceptible to order effects, because they were collected sequentially in the same questionnaire with prefailure measures. Nonetheless, these data check results offer robust estimates, as they accounted for the effects of attributions of blame, failure severity, and recovery expectations.
Tests of Hypotheses
To examine H1–H5, we incorporated the history of the first failure into the model. We conducted multiway RM MANCOVA with two within-subjects factors, (1) time: prefailure, postfailure, and postrecovery and (2) failure: Failure 1 and Failure 2. We also had two between-subjects factors, (1) Recovery 1: unsatisfactory and satisfactory and (2) Recovery 2: unsatisfactory and satisfactory, and six covariates (i.e., recovery expectations, attributions of blame, and failure severity involving Failures 1 and 2). (With the exception of failure severity at Failure 2, all covariate effects were significant.) As is shown in the top portion of Table 1, post–Recovery 2 means across the dependent variables significantly decreased below pre–Failure 2 levels for customers perceiving two satisfactory recoveries (Wilks' λ = .706, F = 33.77, p < .01, η2 = .29), supporting the assertion in H1 that the recovery paradox does not occur following two failures.
Linearly Independent Planned Comparisons: H1–H5

p < .05.
p < .01.
Notes: Estimated marginal means reported are adjusted for the effects of failure severity, attributions of blame, and recovery expectations. All variables are based on summed-item scores. SE = standardized error, which is reported for estimated marginal means.
The second portion of Table 1 shows the results for H2 and H3. Post–Recovery 2 means significantly decreased below post–Failure 2 levels for customers who perceived two unsatisfactory recoveries (Wilks' λ = .623, F = 49.10, p < .01, η2 = .38). This supports the assertion in H2 that the double deviation effect occurs after two failures and unsatisfactory recoveries. To test H3, we computed contrasts in accordance with Vonesh and Chinchilli's (1997) recommendations to determine whether the marginal mean decrease from postfailure to postrecovery changes from Failure 1 to Failure 2. As Table 1 shows, this analysis supports H3. The mean decrease from postfailure to postrecovery was more pronounced after the Failure 2 and two sequential unsatisfactory recoveries (Wilks' λ = .730, F = 29.97, p < .01, η2 = .27).
The results for H4 and H5 are shown in the third and fourth portions of Table 1. We tested H4 by comparing the post–Recovery 2 means estimated in the preceding model between the US recovery sequence and the SU sequence. As Table 1 shows, customers reporting the US sequence rated the bank significantly higher than did customers reporting the SU sequence, in support of H4. In addition, post–Recovery 2 means for customers reporting the US sequence significantly increased above post–Failure 2 levels across the dependent variables collectively (Wilks' λ = .785, F = 22.17, p < .01, η2 = .22), in support of H5. However, this increase was not significant at the univariate level for repurchase intent (F = 3.55, p > .06). Post–Recovery 2 means for customers reporting the SU sequence significantly decreased below post–Failure 2 levels across the dependent variables collectively (Wilks' λ = .822, F = 17.59, p < .01, η2 = .18), in further support of H5.
To test H6 through H11, we estimated an RM multivariate analysis of variance model with one within-subjects factor (failure: Failure 1 and Failure 2), one between-subjects factor (Recovery 1: satisfactory and unsatisfactory), one blocking factor (failure type: core and process failures), and three dependent variables (i.e., recovery expectations, attributions of blame, and failure severity). After controlling for the variance explained by failure type, we were able to clarify the mean differences due to satisfaction and failure levels. The top portion of Table 2 shows means and mean differences relevant to H6–H11, and the bottom portion offers univariate statistics. H6 posits that recovery expectations significantly increase from Failure 1 to Failure 2. The expectations mean in the top portion of Table 2 indicates that expectations were significantly higher following Failure 2 (F = 49.84, p < .01, η2 = .17), in support of H6. This increase was also significantly greater for customers who perceived a satisfactory recovery to Failure 1 (F = 3.97, p < .05), in support of H7. Similarly, the extent to which customers perceived their failure as severe significantly increased over failures (F = 30.40, p < .01, η2 = .11), and this increase was larger for customers who perceived a satisfactory recovery to Failure 1 (F = 5.78, p < .02, η2 = .02). Thus, H8 and H9 were supported.
Linearly Independent Planned Comparisons: H6–H11
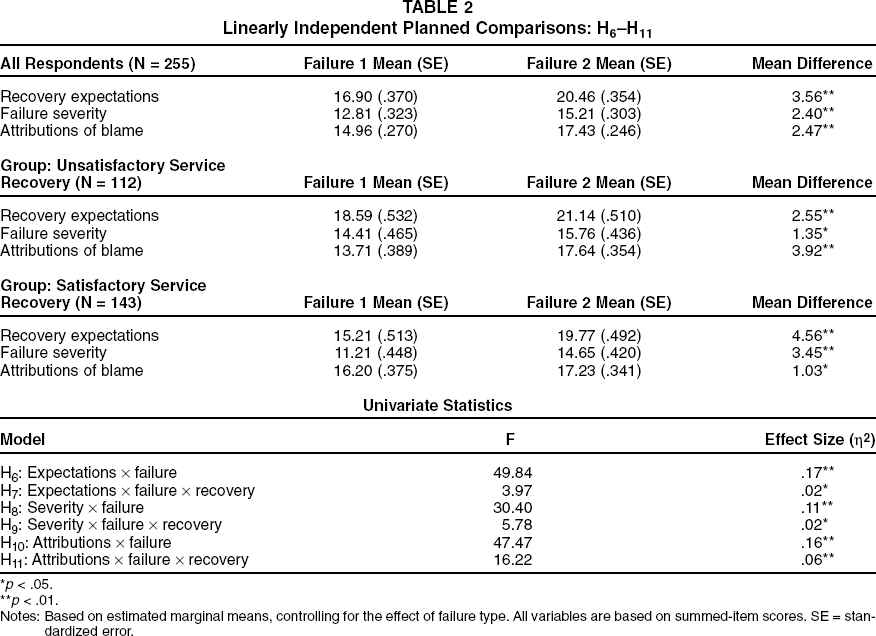
p < .05.
p < .01.
Notes: Based on estimated marginal means, controlling for the effect of failure type. All variables are based on summed-item scores. SE = standardized error.
Table 2 also shows that H10 and H11 were supported, indicating that attributions of blame significantly increase from one failure to the next (F = 47.47, p < .01, η2 = .16), and the effect is larger for customers who perceived an unsatisfactory recovery after the first failure (F = 16.22, p < .01, η2 = .06).
To test H12 and H13, we again constructed a quantitative classification variable (Neter et al. 1996). We asked customers to indicate the number of months they had patronized the bank. The two measures were subtracted (monthssecond complaint – monthsfirst complaint) to form a difference score representing the interval between failures. We then verified these self-report measures using the bank's database. Next, we used a median split to divide the customers into two groups: one reporting two failures in ≤four months (n = 128) and another reporting two failures in ≥five months (n = 127). We then used RM MANCOVA with one within-subjects factor (time: post–Failure 2 and post–Recovery 2), one between-subjects factor (number of months between failures: ≤four and ≥five), three dependent variables (overall satisfaction, repurchase intent, and WOM), and one covariate (postrecovery satisfaction) to test H12. (The covariate was significantly correlated with the dependent variables and was not significantly correlated with the independent variable, so we deemed it appropriate for this analysis.) We calculated linearly independent planned comparisons to determine whether postfailure and postrecovery means were lower for complainants who reported two failures in ≤four months.
The top portion of Table 3 shows that postfailure means for the group that perceived two failures relatively close together were not significantly lower at the multivariate (Wilks' λ = .973, F = 2.32, p > .08) or univariate (p-values for all three variables ≥ .10) levels, which does not support H12. After incorporating another covariate (i.e., post–Recovery 2 satisfaction) into the model to control for customers' satisfaction with the second recovery, we used the previous model to test H13. (The covariate was significantly correlated with the dependent variables and was not significantly correlated with the independent variable.) The second portion of Table 3 also shows that the postrecovery means for the group that perceived two failures close together were significantly lower at both the multivariate (Wilks' λ = .312, F = 183.97, p < .01, η2 = .69) and univariate (p-values for all three variables < .01) levels. As such, H13 is supported. 4
Linearly Independent Planned Comparisons: H12–H15

p < .01.
Note: H12 and H13 were based on estimated marginal means, controlling for the effect of post–Recovery 1 satisfaction. H14 and H15 were based on estimated marginal means, controlling for the effects of post–Recovery 1 satisfaction and failure type. All variables are based on summed-item scores. SE = standardized error.
We also ran the analysis by using a three-way split to create the time lag independent variable. All other aspects of our original model remained the same. We then compared the lower third to the upper third using linearly independent pairwise comparisons, and these results were relatively similar to our results using a median split. Furthermore, we also analyzed H12 and H13 through hierarchical regression. We modeled the months between failures as a continuous independent variable ranging from 1 to 20 months. The regression approach yielded the same conclusions as the RM MANCOVA approach employed to test H12, offering a multi-method reliability check of our analyses. The results are available on request.
To test H14 and H15, we constructed another quantitative classification factor to use as the independent variable. We obtained data from bank officials that indicated whether the two failures were similar or different. (This approach included the classification of a core or process failure.) We then created a dummy variable, where 1 = different failures and 2 = similar failures. Next, we divided customers into two groups, one reporting two similar failures (n = 118) and one reporting two different failures (n = 137), and used RM MANCOVA with one within-subjects factor (time: post–Failure 2 and post–Recovery 2), one between-subjects factor (failure type: different and similar), three dependent variables (overall satisfaction, repurchase intent, and WOM), one covariate (post–Recovery 1 satisfaction), and one blocking factor (failure type: core or process). The covariate and blocking factors were significantly correlated with the dependent variables and were not significantly correlated with the independent variable. As the third portion of Table 3 shows, postfailure means for the group that reported two similar failures were not significantly lower at either the multivariate (Wilks' λ = .984, F = 1.31, p > .27) or the univariate (p-values for all three variables > .07) level, which does not support H14. However, as shown in the bottom portion of Table 3, postrecovery means were lower for customers who reported two similar failures (multivariate: Wilks' λ = .886, F = 10.67, p < .01, η2 = .11; univariate p-values for all three variables < .01), in support of H15.
By including failure type as a blocking factor, we were able to reduce the sum of squares due to error, refine our estimates, and uncover some notable findings. Respondents reporting two similar core failures (CC sequence) had significantly higher ratings after the second recovery than did those reporting two similar process failures (PP sequence) (Wilks' λ = .794, F = 21.41, p < .01, η2 = .21). In addition, respondents reporting a process failure followed by a core failure (PC sequence) had significantly higher ratings after the second recovery than did those reporting a core failure followed by a process failure (CP sequence) (Wilks' λ = .670, F = 40.49, p < .01, η2 = .33).
Discussion
The purpose of our study was to examine complaining customers' perceptions of two service failures and recovery efforts. We summarize our results and implications as follows:
Recovery paradox: For a single failure and satisfactory recovery, customers rated the firm paradoxically higher on satisfaction, WOM, and repurchase intent. However, customers reporting another failure did not rate the firm higher despite satisfactory recoveries. Thus, despite effective recovery efforts, paradoxical increases diminish after more than one failure. Although managers should strive to recover well from mistakes, they would be ill advised to use satisfactory recoveries as a crutch for poor service. Our results suggest that firms cannot merely become recovery experts and need to get it right the first time. Firms also need to learn from their mistakes when they do fail and get it right the second time.
Double deviation effect: Although ratings of satisfaction, WOM, and repurchase intent declined after one failure, the declines were not compounded after an unsatisfactory recovery; that is, there was no double deviation effect. It seems that customers discount the effects of one failure when the firm has typically provided satisfactory service. However, when two unsatisfactory recoveries occur, the double deviation effect is strong. Customers may tolerate one unsatisfactory recovery, but they likely will not tolerate two.
Mixed recovery sequences: Customers reporting a US sequence reported higher post–Recovery 2 ratings than did those reporting an SU sequence. Furthermore, ratings from post–Failure 2 to post–Recovery 2 increased for those reporting a US sequence (and decreased for those reporting an SU sequence). Our study uncovers a potential recency effect when customers report inconsistent recovery efforts, suggesting a “what have you done for me lately?” response. In ongoing relationships in which customers likely experience multiple failures and recoveries, firms may improve previously low ratings associated with an unsatisfactory recovery by subsequently providing satisfactory recoveries. Also, although customers may tolerate an unsatisfactory recovery when it occurs after they report their first failure, they are not likely to tolerate an unsatisfactory recovery when it occurs after a second failure, even if the previous recovery was satisfactory.
Preferences for recovery sequences: Our study unveils a hierarchy of postrecovery ratings when customers report various recovery sequences. The route to the highest postrecovery ratings after two complaints is an SS sequence, followed by a US, SU, and UU sequence, respectively. As such, the past seems important only when customers recall consistent recovery efforts. When inconsistent efforts occur, the past may be important only to the extent that it helped shape prefailure ratings.
Recovery expectations: Our results show that customers adjust their expectations higher from one failure to the next. This increase was greater for customers who previously reported a satisfactory recovery. These results suggest that perhaps “no good deed goes unpunished,” highlighting a potential downside of recovering well. To the extent that satisfied customers rate the firm higher and correspondingly adjust their future expectations, they may be more likely to experience dissatisfaction if the supplier fails again. Therefore, managers must carefully govern these newly enhanced service expectations.
Failure severity: Our results show that customers reporting a second failure rated the second failure more severely than they rated the first. Perhaps severity ratings are stronger when customers perceive a second failure because customers consider “failure history” rather than the individual failure at hand. Our results also demonstrated that failure severity ratings increase more among customers who formerly reported a satisfactory recovery than among those who previously reported an unsatisfactory recovery, which potentially underscores another downside of recovering well. Because severe failures require greater effort on the part of the firm, managers may need to offer additional redress accordingly.
Attributions of blame: Our results show that when multiple failures occur, customers are likely to attribute the failures in a stable, internal manner to the firm. Customers formerly reporting unsatisfactory recoveries blame firms more than do once-satisfied customers when a second failure arises. To the degree that these customers believe that multiple failures and poor recoveries represent a pattern that is stable to the firm, they may attribute failures internally to the firm and therefore require more extensive recovery efforts.
Lags between failures: Complainants reporting two failures within a short time period did not rate the firm lower after the second failure than did those reporting two failures separated by a longer time period. It appears that two failures, regardless of the time lag between them, produce unsatisfied customers. Perhaps customers experiencing longer gaps remain focused on the failure and compress the time lag (see Hornik 1984). However, complainants rate firms lower after the second recovery when two failures occur within a shorter time period. This may make it more difficult for firms to recover when two failures occur close together, partly because customers may not have time to forget about the first failure.
Failure similarity: Complainants reporting two similar failures did not rate the firm lower than did those reporting two distinct failures, which suggests that two failures, regardless of their similarity, make customers equally unsatisfied. However, failure similarity affects customer responses to recovery efforts. Customers reporting two similar failures did not rate firms as highly on recovery efforts as did those reporting distinct failures. These findings suggest a challenging implication: “Do not make the same mistake twice.” Although it remains unlikely that firms will be able to avoid similar failures completely, managers can implement feedback loops into their service delivery system to reduce their occurrence.
Limitations and Research Issues
Although this study expands our knowledge of complaint handling, viable prospects for further research remain. Despite our evidence that noncomplainants are similar to complainants, it is possible that some customers chose not to complain about a failure but nonetheless expected a recovery. Although the bank encouraged complaints, it was the responsibility of customers to initiate a complaint. Therefore, further research could explore customer responses to proactive service recoveries initiated by the firm. It seems worthwhile to better understand if and how customers respond differently when firms proactively identify and successfully fix problems before customers complain (e.g., automobile recalls).
Although our results were mostly consistent across dependent variables, we found differences in univariate results between repurchase intent and WOM. For example, our double deviation data check after one failure and unsatisfactory recovery revealed different results for WOM and repurchase intent. In particular, whereas repurchase intent did not change from postfailure to postrecovery given one unsatisfactory recovery, WOM ratings increased. An unsatisfactory recovery following one failure had differential effects on types of intention, which suggests that even mildly unsatisfactory recoveries may spur increases in favorable WOM. Similarly, although post–Recovery 2 means for customers who reported a US sequence significantly increased above post–Failure 2 levels across the dependent variables collectively, this increase was not significant for repurchase intent. Perhaps complainants weigh past experiences more heavily when forming repurchase intent, which makes them less susceptible to recency effects. These results underscore the possibility that customers weigh and form various types of intentions differently. In a study of computer choice, Tsiros and Mittal (2000) find that satisfaction directly affects both purchase intent and complaint intent, but regret affects purchase intent only directly. Perhaps consumers used different processes to form complaint intentions and purchase intentions. Future studies can help clarify the cognitive and affective processes used to derive various behavioral intentions and help develop a greater understanding of the circumstances in which intentions remain stable or change over time.
Our research reinforces the notion that consumers' perceptions may change over time, signifying that perhaps what appears clear in cross-sectional studies may become complex in longitudinal studies—and vice versa. Our study joins a growing body of longitudinal research on consumer perceptions (e.g., Bolton and Lemon 1999; Mittal, Kumar, and Tsiros 1999), helping clarify and extend results found in cross-sectional studies. For example, Tax, Brown, and Chandrashekaran (1998) note that trust and commitment decrease when dissatisfaction with complaint handling increases. It seems fruitful to extend this finding by examining how trust and commitment change over time when customers report multiple failures with ongoing service providers. Similarly, extending the work by Smith, Bolton, and Wagner (1999), longitudinal studies could explore how the effects of service recovery attributes (e.g., response speed, apologies, compensation) on customer fairness perceptions change or remain stable when multiple failures occur.
Our study design reveals some potential measurement limitations that warrant examination. Although our prefailure retrospective measures of overall satisfaction were highly correlated with actual prefailure satisfaction ratings and there were no significant within-subject mean differences between our retrospective measures and actual measures, it still remains unclear when retrospective measures are accurate and when they are biased. For example, is there some time threshold (e.g., a certain number of months) within which customers can accurately recall their specific perceptions and after which their retrospective measures become biased? At what point do individual differences, environmental factors, customer involvement levels, and other factors spawn halo effects and other recall biases that cloud retrospective measures? To what extent do retrospective measures of given constructs trigger subsequent order effects when followed by a repeated measurement of the same constructs in the same questionnaire representing a different point in time (e.g., postfailure measures)? Given the challenges involved in capturing actual customer perceptions as they form over time, it seems worthwhile to investigate when retrospective measures offer reasonably accurate proxies.
Although all of our respondents received some type of redress effort in the bank's view, some or all of these efforts could have gone unnoticed or unappreciated by our respondents. A sound recovery in the bank's view may still be considered unsatisfactory or nonexistent in the customer's view. Alternatively, a customer could rate a recovery satisfactorily despite a lackluster recovery from the bank's view. As such, the same recovery effort from the bank's view could either generate paradoxical increases or spawn double deviations in customer ratings. Therefore, what one party considers a recovery may or may not be considered a recovery by the other party. Future work needs to examine if, when, and how customers and firm employees view recovery efforts differently.
Finally, the production and consumption of services are often inseparable, and customers may therefore influence the service they receive, including service recoveries. Relatively aggressive or passive customers, for example, may significantly affect the recovery process and ultimately influence their own perceptions about the experience. Does the “squeaky wheel get greased” or does the passive customer receive better recoveries? Although we captured the firm's response to complaints and how customers perceived these responses, we did not capture the extent to which customers influenced their recovery experiences. Although investigating the relationships between customer actions (as independent variables) and service experience evaluations was not the focus of this particular work, it offers a practical avenue for further research.
Footnotes
Measurement Scales
|
|
| 1. I am satisfied with my overall experience with [firm name]. b |
| 2. As a whole, I am |
| 3. How satisfied are you overall with the quality of [firm name] banking service? b |
|
|
| 1. How likely are you to spread positive word-of-mouth about [firm name]? |
| 2. I would recommend [firm name's] banking services to my friends. |
| 3. If my friends were looking for a banking service, I would tell them to try [firm name]. |
|
|
| 1. In the future, I intend to use banking services from [firm name]. |
| 2. If you were in the market for additional banking services, how likely would you be to use those services from [firm name]? |
| 3. In the near future, I |
| 4. In the future, I will continue using [firm name] for these banking services. |
|
|
| 1. I have high expectations that [firm name] will fix the problem. |
| 2. I expect [firm name] to do whatever it takes to guarantee my satisfaction. |
| 3. I think [firm name] will quickly respond to (banking) problems. |
| 4. My expectations are high that I will receive compensation when I encounter a banking service problem. |
|
|
| In my opinion, the banking problem that I experienced was a |
| 1. Minor problem (1)/major problem (7). |
| 2. Big inconvenience (1)/small inconvenience (7). |
| 3. Major aggravation (1)/minor aggravation (7). |
|
|
| 1. To what extent was [firm name] responsible for the problem that you experienced? (not at all responsible [1]/totally responsible [7]) |
| 2. The problem that I encountered was |
| 3. To what extent do you blame [firm name] for this problem? (not at all [1]/completely [7]) |
|
|
| 1. In my opinion, [firm name] provided a satisfactory resolution to my banking problem on this particular occasion. |
| 2. I am not satisfied with [firm name]'s handling of this particular problem. |
| 3. Regarding this particular event (most recent banking problem), I am satisfied with [firm name]. |
Measured at all time periods.
Indicates that the scale was anchored with “not at all satisfied” and “very satisfied.”
Measured once at T1b (post–Failure 1) and again at T3b (post–Failure 2).
Measured once at T2 (post–Recovery 1) and again at T4 (post–Recovery 2).
Notes: All items were measured on a seven-point scale. Unless noted, all items were anchored with “strongly disagree” and “strongly agree.”
Construct Raw Means,Standard Deviations,and Pearson Correlations
| Construct | Mean | S.D. | 1 | 2 | 3 | 4 | 5 | 6 | 7 | 8 | 9 | 10 | 11 | 12 | 13 | 14 | 15 | 16 | 17 | 18 | 19 | 20 | 21 | 22 | 23 | 24 |
|---|---|---|---|---|---|---|---|---|---|---|---|---|---|---|---|---|---|---|---|---|---|---|---|---|---|---|
| 1. Pre–Failure 1 SAT, F1 | 13.38 | 2.95 | .87 | |||||||||||||||||||||||
| 2. Pre–Failure 1 RI, F1 | 22.16 | 5.59 | .55 | .90 | ||||||||||||||||||||||
| 3. Pre–Failure 1 WOM, F1 | 9.49 | 3.19 | .57 | -.08 | .83 | |||||||||||||||||||||
| 4. Post–Failure 1 SAT, F1 | 8.89 | 3.93 | .24 | -.31 | .75 | .87 | ||||||||||||||||||||
| 5. Post–Failure 1 RI, F1 | 16.31 | 3.74 | .51 | .62 | .31 | .15 | .83 | |||||||||||||||||||
| 6. Post–Failure 1 WOM, F1 | 7.90 | 3.68 | .09 | -.34 | .62 | .63 | .22 | .86 | ||||||||||||||||||
| 7. Post–Recovery 1 SAT, F1 | 13.04 | 5.08 | .39 | .23 | .02 | -.06 | .18 | -.31 | .93 | |||||||||||||||||
| 8. Post–Recovery 1 RI, F1 | 19.58 | 6.67 | .24 | .37 | -.05 | .02 | .45 | -.23 | .72 | .96 | ||||||||||||||||
| 9. Post–Recovery 1 WOM, F1 | 12.25 | 5.15 | -.03 | -.24 | .02 | .11 | -.06 | -.12 | .62 | .49 | .93 | |||||||||||||||
| 10. Attributions of blame, F1 | 15.19 | 4.25 | .26 | .48 | -.36 | -.49 | .13 | -.61 | .51 | .40 | .28 | .87 | ||||||||||||||
| 11. Failure severity, F1 | 12.69 | 5.05 | .21 | .28 | -.28 | -.60 | -.05 | -.26 | -.04 | -.26 | -.24 | .51 | .88 | |||||||||||||
| 12. Recovery expectations, F1 | 16.89 | 5.77 | .36 | .18 | -.01 | -.42 | .02 | -.30 | .12 | -.19 | -.08 | .45 | .69 | .92 | ||||||||||||
| 13. Pre–Failure 2 SAT, F2 | 12.76 | 5.20 | .02 | -.02 | -.05 | .03 | .10 | -.02 | .50 | .48 | .48 | .16 | -.23 | -.17 | .92 | |||||||||||
| 14. Pre–Failure 2 RI, F2 | 19.34 | 6.82 | .01 | -.10 | -.05 | .04 | .03 | -.06 | .50 | .43 | .52 | .22 | -.18 | -.14 | .73 | .89 | ||||||||||
| 15. Pre–Failure 2 WOM, F2 | 12.33 | 5.12 | -.09 | -.10 | -.12 | .06 | .03 | -.01 | .51 | .51 | .58 | .19 | -.29 | -.28 | .63 | .53 | .89 | |||||||||
| 16. Post–Failure 2 SAT, F2 | 6.18 | 3.12 | -.04 | .03 | -.08 | .00 | .03 | .05 | .06 | .12 | .12 | .01 | -.08 | -.13 | .15 | -.10 | .51 | 84 | ||||||||
| 17. Post–Failure 2 RI, F2 | 13.14 | 4.66 | .01 | .00 | -.03 | .02 | .03 | -.04 | .05 | .08 | .07 | .01 | -.06 | -.02 | .41 | .53 | .30 | .27 | .86 | |||||||
| 18. Post–Failure 2 WOM, F2 | 5.66 | 3.30 | -.05 | .02 | -.03 | .01 | .08 | .07 | .04 | .11 | .09 | .01 | -.06 | -.11 | .02 | -.23 | .42 | .69 | .09 | .87 | ||||||
| 19. Post–Recovery 2 SAT, F2 | 7.50 | 5.37 | .03 | -.05 | .09 | .14 | .07 | .11 | .15 | .16 | .17 | .04 | -.01 | -.08 | .33 | .35 | .22 | -.07 | .30 | -.15 | .97 | |||||
| 20. Post–Recovery 2 RI, F2 | 11.35 | 7.50 | .01 | -.08 | .03 | .13 | .05 | .08 | .20 | .24 | .27 | .05 | -.08 | -.15 | .34 | .45 | .27 | -.01 | .41 | -.11 | .81 | .97 | ||||
| 21. Post–Recovery 2 WOM, F2 | 6.28 | 3.88 | .03 | -.03 | .03 | .10 | .03 | .05 | .20 | .22 | .13 | .02 | -.07 | -.10 | .11 | -.01 | .10 | -.02 | -.19 | -.08 | .57 | .51 | .96 | |||
| 22. Attributions of blame, F2 | 17.43 | 3.68 | .08 | .01 | .02 | -.01 | .02 | -.07 | .03 | -.02 | -.05 | .00 | .03 | .14 | .26 | .39 | -.22 | -.51 | .21 | -.75 | .29 | .24 | .05 | .88 | ||
| 23. Failure severity, F2 | 15.03 | 4.61 | -.02 | .00 | .01 | -.07 | .02 | -.24 | -.12 | -.16 | -.14 | -.04 | .09 | .08 | .05 | .09 | -.21 | -.42 | -.05 | -.23 | .05 | -.13 | -.31 | .42 | .89 | |
| 24. Recovery expectations, F2 | 20.31 | 5.34 | -.01 | -.02 | .02 | .02 | .04 | .01 | -.10 | -.12 | -.11 | -.10 | .00 | .08 | .20 | .14 | -.13 | -.39 | .12 | -.29 | .19 | .00 | -.21 | .47 | .72 | .92 |
Notes: F1 = Failure 1 and F2 = Failure 2. SAT= overall satisfaction; RI = repurchase intentions. Coefficient alphas are reported on the diagonal.