
Abstract
Consumers purchase goods from various channels or retail formats, such as grocery stores, drugstores, mass merchandisers, club stores, and convenience stores. To identify the most appropriate channels and to allocate the distribution of products among channels efficiently, managers need a better understanding of consumer behavior with respect to these channels. The authors examine the moderating role of channel-category associations in consumer channel patronage by extending the literature on brand associations to the context of channels, and they estimate a model that links channel-category associations with consumer geodemographics and channel share of volume. The authors first identify the product categories associated with particular channels through a correspondence analysis of a field-intercept survey. They then use the channel-category associations and geodemographic factors to estimate their direct and interactive effects on channel share of volume. The channel-category associations have significant main effects and interaction effects with channel type and geodemographic factors on channel share of volume, and they account for the majority of the explained variance (72%) in channel share of volume. Overall, the findings provide several conceptual and managerial insights into consumer channel perceptions and patronage behavior.
In this research, we explore the influence of two factors that are relevant to channel patronage decisions: geodemographics and associations between the channel and particular product categories. Geodemographics is the classification of people by the neighborhood in which they live, combined with demographic variables, to form an overall consumer profile (Johnson 1989). It is based on the notion of social clustering; that is, people tend to congregate with people like themselves according to the same factors that determine consumption: social rank, household composition, ethnicity, urbanicity, and mobility (Goss 1995). Geodemographic targeting is a two-step process: Households or block groups (depending on data availability) are combined into similar groups by means of cluster analysis of various geographic and demographic factors, and then similarities in purchasing behavior (i.e., based on panel data or customer databases) are examined to identify the most viable targets for the product or service in question. 1 If consumption of the focal product or service skews toward certain geodemographic groups, a “geotargeting” strategy can be cost effective. A market research subindustry has developed around geodemographic targeting (e.g., Curry 1993), including firms such as VNU (PRIZM, Spectra) and National Decision Systems (MicroVision).
In some cases, such as trade area analysis, the analysis focuses on profiling heterogeneity in geodemographics across trade areas (e.g., Faulds and Gohmann 2001). Our focus is on the variation in consumption across geodemographic groups.
Although the notion of channel associations offers conceptual appeal, it has received little attention from researchers. Several scholars have argued that brand associations in memory are a central component in brand evaluation and choice (e.g., Keller 1993; van Osselaer and Janiszewski 2001). Brand associations are defined as the “informational nodes linked to the brand node in memory and contain[ing] the meaning of the brand for consumers” (Keller 1993, p. 3). Research reveals that brand associations influence persuasion (Greenwald and Leavitt 1984), evaluations (Broniarczyk and Alba 1994; Janiszewski and van Osselaer 2000), and usage intentions (Lane 2000). Similarly, channel-category associations can be viewed as consumer perceptions from the perspectives of both channel and category; that is, a given channel can be strongly associated with some product categories. Likewise, a given product category may be more closely associated with one channel than with others. Conceptually, the association of a given channel with a given category can be viewed as a measure of consumer perceptual similarity between the specific channel and the specific category.
Our goal is to identify the categories of consumer goods that are most closely associated with particular channels (i.e., mass merchandisers, grocery stores, club stores, and drugstores) and to examine the interplay between the channel-category associations and geodemographics in the explanation of variation in channel share of volume across product categories. Our study aims to provide a descriptive behavior of channel patronage that will facilitate the development of a theory of channel purchasing behavior. An understanding of these phenomena is key to addressing several managerially important questions that arise in a multichannel environment. More specifically, we address three key questions in this research.
Research Question 1 is, What types of product categories are associated with a given channel? That is, what signature product categories tend to come to mind when consumers think of that channel? If the basket of goods drives channel selection (e.g., “if we need detergent, soaps, and other cleaning items, we go to a mass merchandiser'‘), an understanding of the products most closely associated with particular channels becomes key to the development of relationship-marketing programs with retailers. Brand associations with product features and benefits are a central component of Keller's (1993) brand-equity framework, because product aspects that are strongly associated with certain brands represent points of differentiation between brands (e.g., Dillon et al. 2001). Similarly, retailers need to know if they are well positioned on the factors that differentiate between channels and thus serve as the important drivers of channel patronage decisions.
Research Question 2 is, What channel-category associations and geodemographic clienteles influence channel share of volume? Conceptually, stronger associations between a category and specific channels should lead to an increased share of volume for those channels. In terms of practice, the answer to this question can guide retailers in determining their store layout and merchandising strategies. Category consumption typically varies widely across geodemographic groups, thus forming the basis for geotargeting strategies. However, to our knowledge, no one has examined the role of geodemographics in channel share of volume across product categories. For example, are certain geodemographic clienteles more likely to shop at mass merchandisers?
Research Question 3 is, How do channel-category associations moderate the relationship between geodemographics and channel share of volume? Keller (1993) argues that different types of brand associations can interact, but heretofore no research has examined interaction effects of channel-category associations. Besides the conceptual importance of this interaction, it is critical to managers who wish to coordinate their promotional efforts across channels. If channel-category associations interact with user geodemographics, marketers in categories that are strongly associated with a certain channel need to tailor their integrated marketing communications strategy accordingly by allocating a larger portion of their trade efforts to that channel and by targeting consumers from the appropriate geodemographic groups (e.g., a soft drink manufacturer may find it more profitable to promote differently to mass merchandiser buyers and club store buyers). This issue is important to public policy officials as well. If lower sociodemographic groups tend toward higher-priced channels (e.g., drugstores, convenience stores) for the categories associated with those channels, they experience a “double whammy” of lower incomes and higher prices.
The rest of the article is organized as follows. We begin by reviewing the channel patronage, brand association, and geodemographics literature. We address the research questions in an empirical study by using correspondence analysis to determine the channel-category associations and by merging the results with data from a leading geodemographics data supplier. We then analyze the effects of channel-category associations and geodemographics and their interactions on channel share of volume. We conclude with a discussion of the findings’ conceptual implications, the ways the findings might alter marketing practice, and directions for further research.
Literature Review
Channel Patronage
The store patronage literature is relevant to an understanding of channel patronage. Researchers have examined both the impact of store or shopping center attributes (e.g., price level, convenience, quality, ambience) on patronage (e.g., Arnold, Oum, and Tigert 1983; Louviere and Gaeth 1987; Nevin and Houston 1980) and temporal variations in store patronage behavior (e.g., Kahn and Schmittlein 1989; Popkowski-Leszcyc and Timmermans 1997). Although this research has increased the understanding of the general factors that motivate store switching, it has neither explored differences in the evoked attributes or product categories across channels nor examined the geodemographic and behavioral drivers of channel patronage.
Researchers (e.g., Bell, Ho, and Tang 1998; Bell and Lattin 1998; Lal and Rao 1997; Popkowski-Leszcyc and Timmermans 1997) have examined the factors that influence consumer choice between grocery stores with different price formats (i.e., everyday low price [EDLP] versus “high-lo” stores). In general, the results suggest that consumers with larger shopping lists (and concomitantly larger basket sizes) prefer EDLP stores. Furthermore, consistent with retail location theory (e.g., Huff 1962), consumers’ affinity for a store tends to be inversely related to the distance thereto. Bell, Ho, and Tang (1998) segment consumers in terms of the relative importance of fixed costs (e.g., store loyalty, distance) and variable costs (e.g., basket cost, category-specific store loyalty). They find that both fixed and variable costs influence consumers’ choice of supermarket. Zettelmeyer (2000) uses a game-theoretic approach of multichannel competition to conclude that firms can leverage multiple channels to achieve a more refined consumer segmentation. However, he does not empirically examine whether different types of consumers shop at different channels. Messinger and Narasimhan (1997) conclude that consumers seeking time-saving convenience have contributed to the growth in the one-stop shopping retail format over time. Although these studies provide valuable insights, they have not addressed the issue of channel-category associations and how they might be related to channel share of volume.
Channel-Category Associations
Researchers (e.g., Aaker 1991; Keller 1993) have conceptualized associations using associative network models of memory (Anderson 1983; Collins and Loftus 1975). In this view, brand information stored in memory is represented as a network of interlinking nodes. Specific bits of information are stored in each node, and the strength of the linkage between the bits is proportionate to the strength of the association between the nodes. That is, the semantic relatedness between two nodes is represented by the strength of the association, which can be affected by factors such as advertising frequency and product experience. For example, for most consumers, the linkage between McDonald's and fast food is probably stronger than the linkage between Arby's and fast food.
In this view, likelihood of recall is driven by the “spreading activation” (e.g., Collins and Loftus 1975) induced by either an external stimulus or some internal prompt. Activation spreads from the activated node to other nodes as a function of the strength of the linkages between them. That is, when a consumer considers the choice of a fast-food restaurant, McDonald's is more likely to come to mind than Arby's because of McDonald's greater association with fast food. Other associations linked to McDonald's should then be evoked, such as hamburgers, efficient service, and so on. Keller and Aaker (1992) show that core brand associations influence evaluations of brand extensions (see also Aaker and Keller 1990). They argue that the strength of this effect is driven by the accessibility of the associations from memory. As we already discussed, this is a function of the association between the activated node and the brand.
By extension to the context of channels, when the consumer is considering purchasing a given set of goods, the likelihood of a particular channel coming to the fore should be a function of the sum of its associations with each product category being considered and the specific features/benefits offered by each channel. If the set of needs consists primarily of food products, the consumer arguably would evoke grocery store or club store. Similarly, if time is of the essence, convenience or quick in and out (i.e., features and benefits) may be the activated nodes, so convenience stores may come to the fore. A unique aspect of the associative network model in this context is that the associations between the channel and entire product categories are important. In the brand-level association models, the product category is often the activated node, and brands follow. The reverse is the case here; channels follow from the activation.
Although researchers have tended to focus on the conceptualization per se (e.g., Keller 1993) or the process by which the associations are learned (e.g., Janiszewski and van Osselaer 2000), our focus is on the nature of channel associations (Research Question 1) and the role of the associations in channel share of volume (Research Question 2). Specifically, although Keller (1993) describes user imagery as a type of association, we focus on empirically examining the direct effects of channel-category associations on channel share of volume and the interaction effects of the associations with shopper geodemographics (Research Question 3).
Geodemographics
Insights into the potential impact of geodemographics on channel choice can be gained from the research in structural sociology and marketing on behavioral differences along social class and other demographic lines. People in different social classes differ not only in terms of the products they buy but also in terms of the type of store they frequent to buy products. That is, shopping sites tend to take on fixed class identities (Miller et al. 1998). For example, Martineau (1958) finds that the social status of a store often becomes the primary basis for its definition by the shopper. Each store, even if it is a grocery store, acquires status identification. Martineau's findings suggest that when making a store choice, the shopper goes to where he or she will “fit in.” Although an entire market research subindustry has developed around the notion of geodemographic targeting (e.g., Curry 1993), to our knowledge, no one has examined the role of geodemographics (i.e., shopper characteristics) in channel share of volume across product categories, nor have researchers applied the conceptual associative network model as a moderator of this relationship.
Although we agree that geodemographic effects on channel share of volume merit examination, we argue that it is also important to consider the potential moderating role of channel-category associations on this relationship. Janiszewski and van Osselaer (2000, p. 333) apply the connectionist model of memory (e.g., Smith 1996) in the context of associations between brand name (i.e., cue) and quality (i.e., outcome), describing the connectionist model as having the desirable property that “the association strengths between each cue and an outcome depend on the association strengths between other cues and the same outcome.” We extend this idea to the context of channel share of volume. A household may tend to shop more heavily at one type of channel, perhaps because of proximity (e.g., Huff 1962) or feelings of fitting in (Miller et al. 1998). A systematic tendency for households with particular characteristics to shop at one channel more heavily than another results in a relationship between geodemographics and channel share of volume. However, if channel-category associations are strong, a particular channel may be evoked when the household sets out to purchase a given set of goods. This association should result in the attenuation of the geodemographic–channel share of volume relationship in favor of the evoked channel. We argue that the strength of the channel-category association also results in a main effect of associations in channel share of volume. Figure 1 provides an overview of the three research questions and the nature of the expected relationships.

The Role of Channel-Category Associations in Channel Volume Share
In summary, we argue that channels are associated with certain types of product categories (e.g., food items, household items, cosmetics) and a particular geodemographic customer base (e.g., presence of children, affluence). Furthermore, category-channel associations and geodemographics should act in conjunction to drive channel share of volume. More specifically, channels that are strongly associated with a product category should exhibit a weaker geodemographic–channel share of volume relationship.
Empirical Study
Our purpose is to examine the drivers of consumers’ tendency to shop at one type of channel, which we operationalize using channel share of volume as the dependent variable (which we subsequently define in detail). Our main independent variables are channel-category associations and geodemographic consumer-level factors. Although researchers have consistently reported strong effects of consumer characteristics on category volume (e.g., Dardis and Sandler 1971; Rich 1963) and reactions to marketing-mix variables (e.g., Hoch et al. 1995; Shankar and Bolton 2004), the literature offers little guidance on geodemographic factors that might influence channel share of volume. Thus, our selection of geodemographic variables is admittedly exploratory and based on industry practice. We employ a geodemographic segmentation database that segments consumers into a 54-cell lifestyle/life-stage grid and by channel (Figure 2). Specifically, we use Spectra software, which is used by many consumer goods firms that wish to target consumers on a geodemographic basis. We use Nielsen wand-panel data to populate the grid. If firms find a skew such that certain lifestyle or life-stage groups are heavier consumers, they define this as the geodemographic target.

Spectra Lifestyle/Life-Stage Descriptions
The grid is composed of nine lifestyle rows, defined in terms of affluence and urbanicity, and six life-stage columns, defined in terms of age of the head of household (HOH) and the presence or absence of children. As we mentioned previously, the grid can be populated with any variable, such as consumption (i.e., annual volume per household), penetration (i.e., percentage of households purchasing), or buying rate (i.e., annual volume per purchasing household). A Spectra geodemographic grid for ground coffee purchased at grocery stores (annual household volume) is shown in Table 1.
Spectra Lifestyle/Life-Stage Grid for Grocery Store Consumption: Ground Coffee (Annual Ounces/Household)
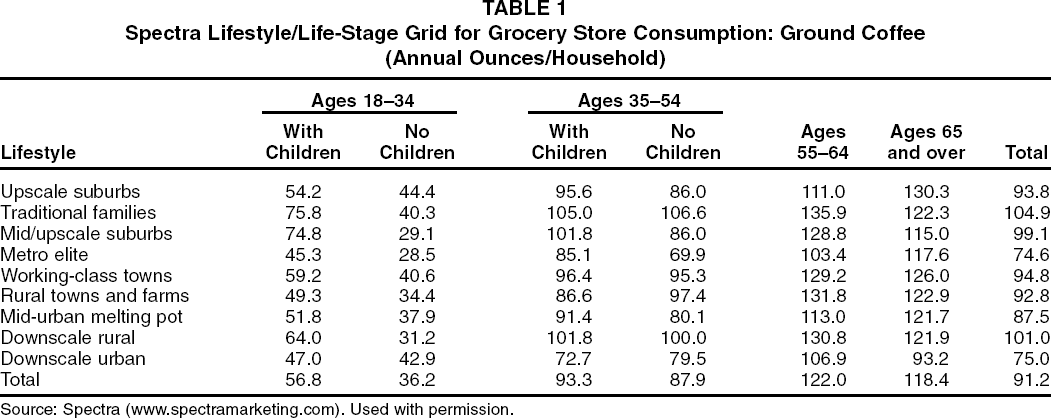
Source: Spectra (www.spectramarketing.com). Used with permission.
The rows in Table 1 are sorted in order of declining affluence. Furthermore, the rows titled “Metro elite,” “Midurban melting pot,” and “Downscale urban” are more urban than the others. The columns are in order of increasing HOH age, and households with HOH ages of 18–34 and 35–54 are broken out in terms of presence or absence of children. In the example grid shown in Table 1, households with HOH ages of 55–64 tend to be heavier consumers of ground coffee through the grocery channel; their annual volume (122.0 oz. per household) is much greater than the overall average (91.2 oz. per household). Similarly, traditional families (104.9 oz. per household) tend to be somewhat heavier purchasers of ground coffee through grocery stores.
To prepare the data for this analysis, we computed channel share of volume for each cell in each grid by dividing the annual volume for that cell for each particular channel by the total annual volume for that cell across all channels. For example, upscale suburban households with HOH ages of 18–34 with children (the upper-leftmost cell in the grid) purchased 77.7 ounces of coffee per household in the year 2000 across the four channels (grocery, mass, drug, and club). The channel share of volume of this geodemographic group was 70% for grocery, 9% for mass, 1% for drug, and 20% for club. We now describe the geodemographic variables used in the analysis and explain how we derived the channel-category association dimensions.
Operationalizing Geodemographics and Channel-Category Associations
Geodemographics
The geodemographic variables that we examine are affluence, urbanicity, presence of children, and HOH age. 2 The variables for urbanicity and presence of children were binary, and those for affluence and HOH age were continuous. Specifically, we used information about the median annual income and urbanicity of the households in the nine Spectra lifestyle rows to define the affluence and urbanicity variables. We used the median household income reported by Spectra for each row in the grid shown in Table 1 to specify the affluence variable. Furthermore, we coded the rows in the grid as a one if the Spectra description in the database definition indicated an urban neighborhood (these are the rows titled “Mid/upscale suburbs,” “Metro elite,” “Mid-urban melting pot,” and “Downscale urban'‘). 3 We used the grid columns to define the presence-of-children indicator variable (i.e., one if children were present and zero otherwise). Finally, we created the HOH age variable using the midpoint of the range in each column (i.e., 26 for HOH ages 18–34, 44.5 for HOH ages 35–54, 59.5 for HOH ages 55–64, and 70 for HOH ages of 65 and over). 4
We tested for potential multicollinearity among independent variables. The correlation matrix and variance inflation factors indicated that multicollinearity is not a problem.
It can be argued that some shoppers choose to live in urban or suburban areas on the basis of proximity to their desired channels, suggesting that urbanicity may be endogenous. Although some people may locate close to channel locations because of channel characteristics, we believe that this is not a serious issue, because our dependent variable is channel volume share, not price or another channel attribute. It seems unlikely that people would locate in urban or rural neighborhoods on the basis of channel share of volume in the neighborhood. Moreover, geographic location is the only variable under consumers’ real control (unlike demographic variables such as age or income) and is just one component of geodemographics. Therefore, we do not believe that endogeneity is a major concern.
To test the robustness of our results to the operationalization of the geodemographic variables, we repeated the analyses for different categorical scale operationalizations of affluence, urbanicity, kids, and age. For example, because a linear coding may be unduly restrictive, we reestimated the model using three age dummy variables (one for 35–54, one for 54–65, and one for 65-and-over categories) for the main and nonlinear effects of age and all of the interactions. The adjusted R2 for the analyses were almost identical, suggesting that our results are robust (e.g., the linear coding adequately captures the age effect).
Channel-category associations
Geodemographics were available directly from the Spectra database, but channel-category associations were not. Thus, we were forced to adopt a “data-fusion” approach, estimating channel-category associations from a different sample and then merging the results with the Spectra-supplied data. To do this, we used data provided by Meyers Research Center in New York. In the fall of 1999, 1698 consumers from five cities participated in a field-intercept survey. They were asked to indicate at which of the following channels they shop in a typical month (number of affirmative responses is shown in parentheses): supermarkets (1698), drugstores (1165), megastores such as Kmart or Wal-Mart supercenters (729), regular discount department stores such as Kmart, Wal-Mart, or Target (966), and warehouse club stores such as Costco or Sam's Club (351). It was important to select channels that carry a relatively common assortment of product categories; otherwise the construct of channel-category associations has little meaning.
Fazio, Williams, and Powell (2000) examine three general approaches for measuring association strength: naming methods, latency methods, and facilitation methods. They demonstrate that the methods converge in terms of assessing association strength. Because shoppers were interviewed in the field, the naming approach was more practical because the other two methods require a computer. In the naming method, respondents are presented with the stimulus (channel, in this case) and asked to recall items that they associate with that channel. Specifically, respondents were first asked to recall up to three product categories that they associate with each channel, followed by the first three words or thoughts other than product categories that come to mind. To mitigate the influence of previously recalled items, subjects were given a maximum number of three items to list (e.g., Farquhar and Herr 1993). As would be expected from an open-ended format, respondents mentioned a wide variety of categories: 113 for supermarkets, 100 for drugstores, 105 for superstores, 98 for regular mass merchandisers, and 107 for club stores.
The naming approach and the resulting perceptual-distance measure have both strengths and weaknesses. The strengths are that the measures enable us to capture memory and salience-based associations between channels and categories, reflect consumers’ cognitive mapping of channels, and take into account consumers’ attribute-based similarity judgments. The weakness is that some of the evoked associations from a consumer probably reflect the consumer's purchases at the different channels, so we must be cautious in interpreting their role in channel patronage decisions.
To identify the strength of the association between product categories and channels, we performed a correspondence analysis (see Hoffman and Franke 1986). Correspondence analysis is a mapping technique that uses cross-tabulation data as input (i.e., the number of product mentions for each channel) and converts the data into a joint space map by using the chi-square value for each cell. It is quite useful in this regard for several reasons. First, its ability to consider multiple categorical variables simultaneously enables us to map jointly the product categories elicited by the open-ended responses. Second, as with other graphical algorithms (e.g., multidimensional scaling, factor analysis), correspondence analysis aids in uncovering the structural relationship among the variables. Third, the only data requirement for correspondence analysis is a rectangular data matrix with nonnegative entries. Thus, it is perfectly suited for the open-ended elicitations that were the source of the data. Finally, correspondence analysis generates a dual display of both the columns (channels, in this case) and the rows (the products). The displays have similar interpretations, which facilitates the detection of relationships.
The primary caveat of correspondence analysis is that the specific distances between the row variables and column variables cannot be interpreted, because the distances do not represent a defined metric (Hoffman and Franke 1986). That is, the columns and rows are scaled independently, so (in our case) the channel scaling can be put through any monotonic transformation. Although the between-set distances cannot be strictly interpreted, a channel tends toward a position in its space that corresponds to the products that are the most prominent in its profile. In other words, the specific distances between the channels and the products should not be interpreted, but the ordinal proximity of particular products to certain channels has meaning. This is because any monotonic transformation of the channel scaling on the map maintains the ordinal distance from a particular category to the channels. For example, it is inappropriate to report that soft drinks are 1.5 units from the club channel and .9 units away from grocery, but any monotonic transformation of the channel scaling will leave soft drinks closer to grocery than to club in a relative sense. 5
Thus, it is important that we use the category positions from the correspondence analysis rather than the distances from particular channels.
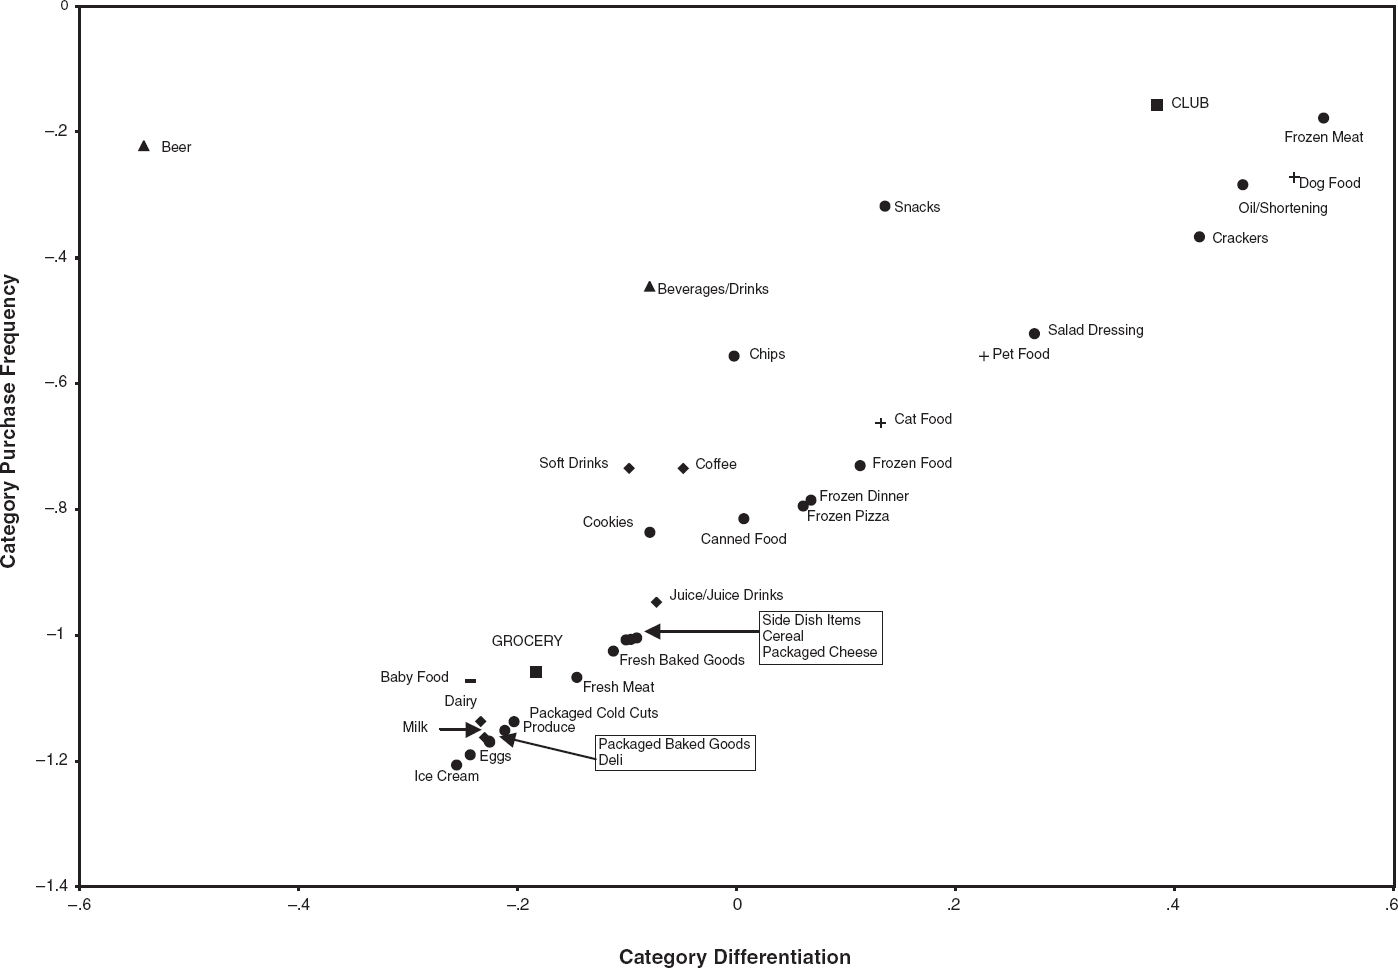
Both channels and products are plotted in Figure 3 (Figures 4 and 5 show expanded views of the two areas in Figure 3 in which several categories cluster). The analysis suggests that two dimensions (hereafter referred to as “association dimensions'‘) adequately capture the variation in product mentions across channels. The vertical dimension captures 55% of the variance, and the horizontal association dimension captures 36%, for a total of 91% of the variance. Notably, a channel triangle is revealed, with the drug channel in the upper-left corner, the grocery channel at the bottom, and the superstores and regular mass merchandiser channels in the upper-right corner. The proximity of the superstores to regular mass merchandisers implies that consumers perceive them as quite similar in terms of the products that each evokes. The club channel is located roughly equidistant between grocery and superstore/regular mass merchandisers.

Correspondence Analysis Map of Categories and Channel Data
For the product categories (see Figures 3–5), the food and beverage items tend toward the bottom of the plot. The pet food and supplies are near the middle of the plot, as are the vice products (e.g., liquor, cigarettes). Less differentiated, or “commodity,” products such as general household items (e.g., toys, clothing, lawn and garden supplies, domestics) and cleaning supplies tend toward the upper-right quadrant, whereas personal care products (e.g., oral care, feminine hygiene, deodorants) and health-related categories (e.g., cold and flu medication, analgesics, vitamins) are in the upper-left quadrant. Grocery tends to be more closely associated with food items, drug is associated with personal care and health-related categories, club tends to bring food items and pet supplies to mind, and the two mass merchandiser channels are associated with less differentiated, infrequently purchased general household items. Thus, we labeled the vertical dimension “category purchase frequency,” with less frequently purchased items in the upper portion, and the horizontal dimension “category differentiation,” with less differentiated products on the right-hand side. This analysis identifies which categories are associated with which channel, thus addressing Research Question 1. Table 2 shows the product category associations along the two dimensions. The results are relevant to the positioning of channels with respect to the products they carry.
Product Categories and Correspondence Analysis Dimensions

Notes: Categories used in estimation are in italics.

Correspondence Analysis Map of Categories and Channel Data: Upper-Right Quadrant
Correspondence Analysis Map of Categories and Channel Data: Lower Quadrants
Several channel-category associations uncovered from correspondence analysis are novel and somewhat counterintuitive. Table 3 provides a summary of the associations and the relevant rationale. The drug channel is closely associated with categories such as alcohol, tobacco, candy, magazines, and soap, which are not intuitively obvious. Alcohol and cigarettes are associated more with the drug channel than with the other channels, though the drug channel is associated with health-related products. The likely reason is that consumers perceive the attributes that are key to the purchase of these categories (convenience, selection, and service) as superior at the drug channel than at the other channels (Inman, Shankar, and Ferraro 2002). Candy is associated with the drug channel more than with other channels, particularly the grocery channel, with which food items are typically associated. Candy is bought on impulse, and it may be more convenient to buy candy at or close to the checkout at the drug channel because the basket sizes are typically smaller in this channel than in the grocery channel. The rationale for associations of categories such as magazines, photo supplies, and soap are provided in Table 3.
Surprising Channel-Category Associations and Their Rationales
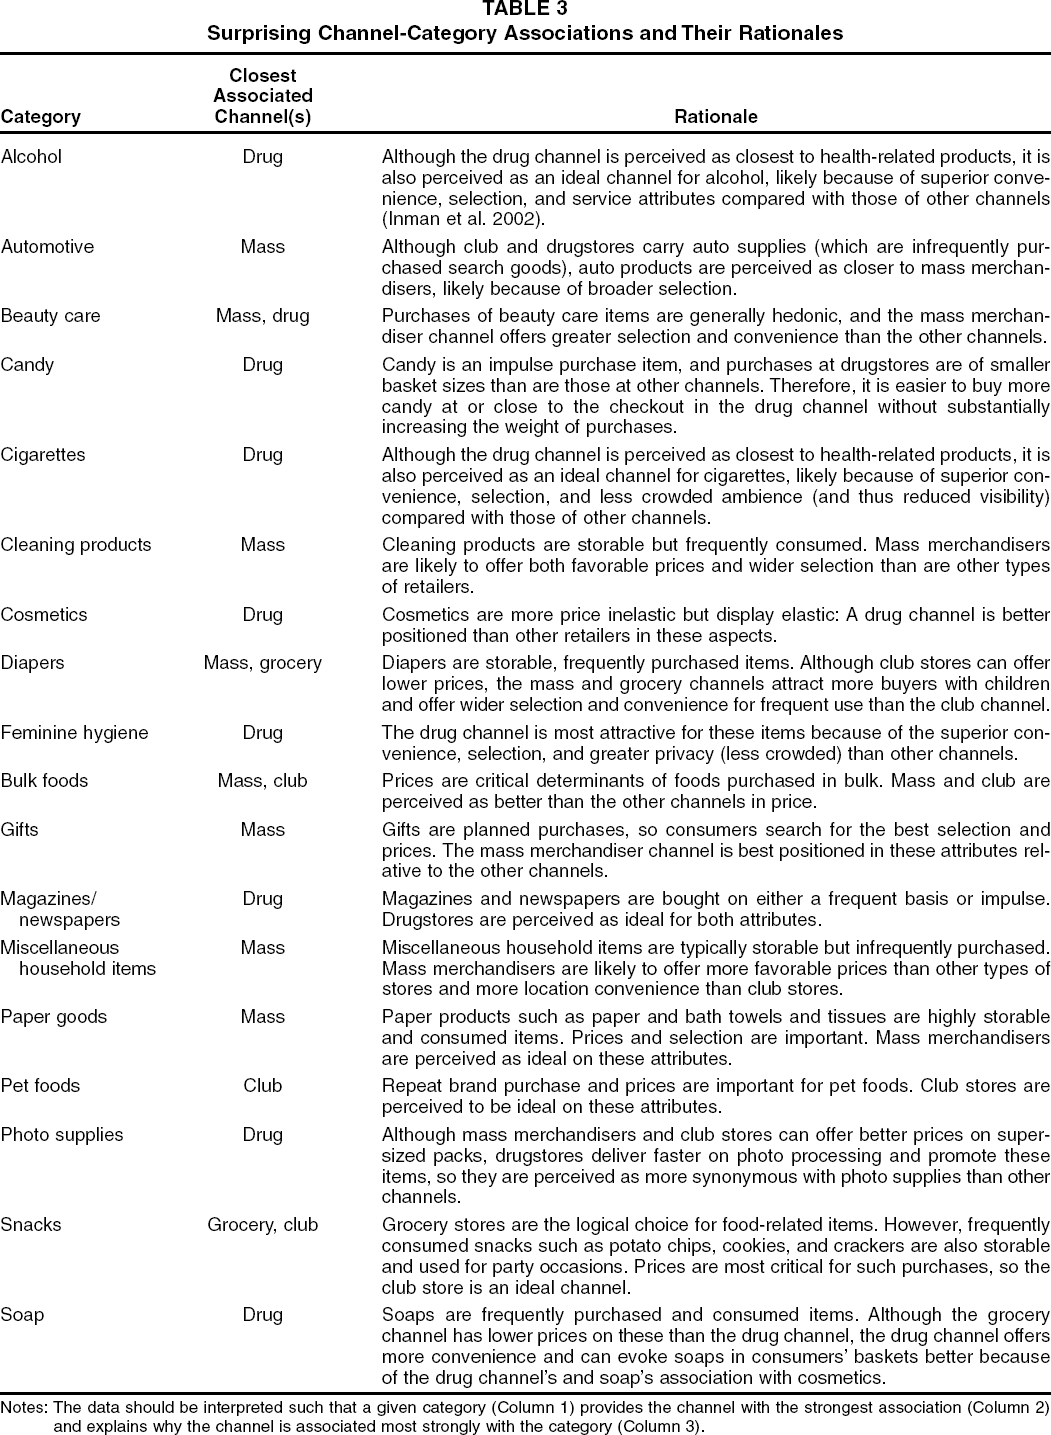
Notes: The data should be interpreted such that a given category (Column 1) provides the channel with the strongest association (Column 2) and explains why the channel is associated most strongly with the category (Column 3).
Consumers perceive the mass merchandiser channel as the closest channel for categories such as automotive, beauty care, cleaning products, gifts, miscellaneous household items, and paper goods. Cleaning products are more closely linked to the mass merchandiser channel than to the grocery or the club channel. Because these items are storable and frequently consumed, prices and selection are important. Although club stores typically offer good prices, the selection is not as wide as it is in mass merchandiser stores, and whereas grocery stores offer wide selection, they do not typically offer lower prices than mass merchandiser stores. Table 3 offers a rationale for the associations of other categories to mass merchandiser stores.
Club stores are strongly associated with bulk foods, frozen foods, pet foods, and snacks. Shoppers typically buy the same brands of pet foods for their pets, because they do not like to change the brands to which their pets have grown accustomed. Therefore, repeat purchases are important for these foods. Because club stores offer some of the best prices for a given brand or set of brands, they are more closely associated with pet foods than are other channels. Bulk foods, frozen foods, and snacks are also purchased by affluent and, often times, stressed-out shoppers (the geodemographic clientele of club stores), who may buy large quantities at low prices so that they do not need to make multiple shopping trips.
Analytical Approach
We merged the measures of channel-category dimensions from the correspondence analysis with the geodemographics database and performed a regression analysis to study the roles of channel-category associations and geodemographics on channel patronage. An aspect of the Spectra system that is suitable for our purpose is that the consumption grids (annual volume per 100 households) are available by channel (e.g., Table 1 is for grocery). That is, we were able to generate separate grids for grocery (73), mass merchandiser (74), drug (63), and club (59) stores.
We tried to generate consumption grids for each of the categories identified in the field study that yielded the channel-category dimensions. Unfortunately, there was not a one-to-one mapping of all the categories from the field study in the Spectra database. For example, the household cleaners category is not in the database, so we used two less-abstract categories: bathroom cleaners and floor cleaners. Furthermore, superstore mass merchandisers and regular mass merchandisers are not broken out separately in the Spectra database. We did not view this as a serious limitation, because the consumers questioned in the field study perceived the two channels as similar. Thus, we attempted to extract a separate category-channel grid for each category across four channels (club, drug, grocery, and mass). The final database consists of 269 category-channel grids across 74 product categories (see Table 2) and yields 14,526 observations (269 grids x 54 cells per grid).
We performed the analysis in two ways: (1) a pooled analysis of all the observations from the channel-category Spectra grids and (2) a hierarchical regression analysis, consistent with previous research (e.g., Bolton 1989; Bolton and Shankar 2003). The pooled regression enabled us to examine the relative effects of each group of factors—namely, type of channel, channel-category associations, geodemographics, and all the possible interactions (three two-way interactions and one three-way interaction)—in one model and to draw insights from them. The hierarchical regression serves as a robustness check. Because the hierarchical regressions are similar to the pooled regression, we report only the pooled regression results.
6
The general equation that we estimate is the following:

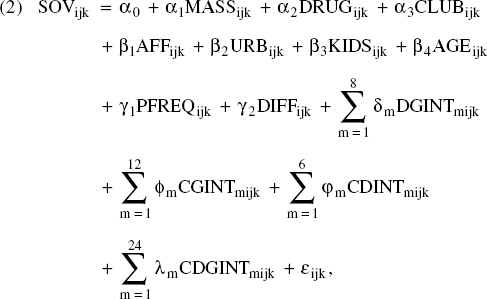
The hierarchical results are available from the authors.
We acknowledge that a limitation of our approach is that the individual channel-share estimates may not be logically consistent (i.e., strictly between zero and one) and that the sum of the channel shares is not constrained to sum to one. However, Inman (1990) reports that parameters estimated with a set of constrained share equations were substantively identical to parameters estimated with an unconstrained set of equations. Thus, we do not believe that this represents a serious concern.
Results
We now discuss the significant effects in the pooled regression model. As is shown in Equation 1, the interpretation of the channel-interaction coefficients is relative to the grocery channel (i.e., grocery is the baseline channel). Furthermore, Dimension 1 is the vertical channel-category association dimension from the correspondence analysis (see Figure 3) that we named “category purchase frequency.” Dimension 2 is the horizontal dimension, which we interpreted as “category differentiation.” As is shown in Figure 3, each of the dimensions ranges between approximately −1.2 and 1.2. Table 2 lists the categories that scored relatively high and low in the two dimensions.
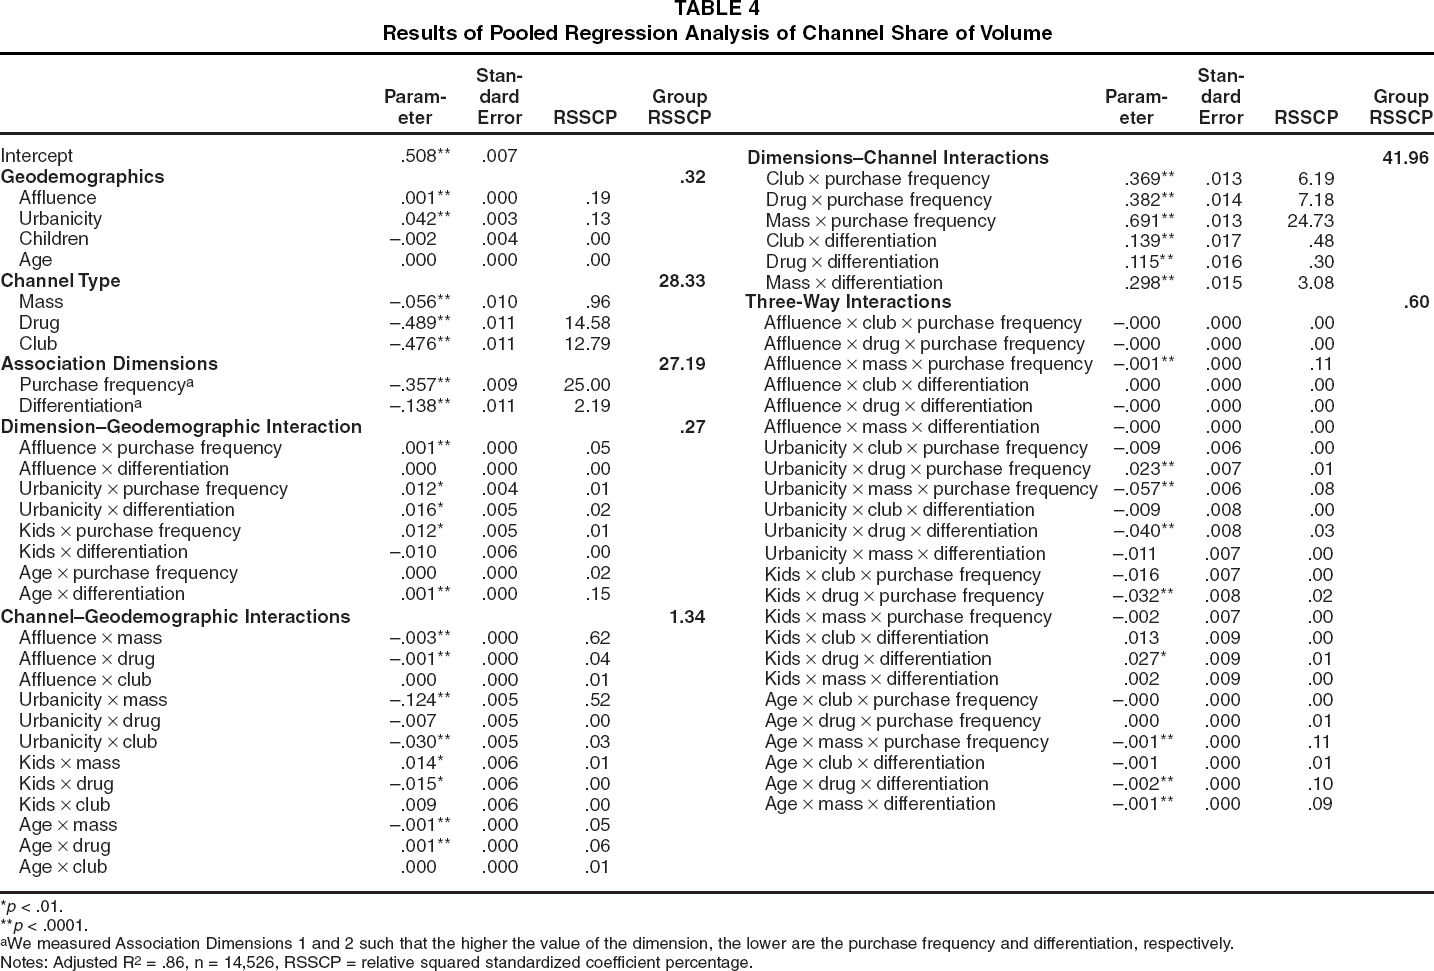
Table 4 shows the individual parameter estimates. Our second research question seeks to examine the direct effects of channel-category associations and geodemographics on channel share of volume. Specifically, we argue that the channel-category associations should have a significant, direct impact on channel share of volume. This thesis is strongly supported, because the base effects (with the channel indicator variables all set to zero) are substantive and significant. Furthermore, the effects of the channel-category associations on volume share vary widely across the channels (i.e., all six channel x association parameters are significant). The effect of purchase frequency ranges from -.357 for grocery to .334 for mass (Table 5 breaks out the results by channel), and the effect of differentiation ranges from -.138 for grocery to .160 for mass. The higher the purchase frequency at a channel, the higher is the channel share of volume; the more a category is differentiated from other categories in a channel, the higher is the channel share of volume.
Results of Pooled Regression Analysis of Channel Share of Volume
p< .01.
p < .0001.
We measured Association Dimensions 1 and 2 such that the higher the value of the dimension, the lower are the purchase frequency and differentiation, respectively.
Notes: Adjusted R2 = .86, n = 14,526, RSSCP = relative squared standardized coefficient percentage.
Estimated Channel Share Sensitivity (Based on Parameter Estimates)

Our results also suggest that geodemographic effects vary quite a bit across channels (i.e., geodemographic x channel interactions); 8 of the 12 geodemographic x channel parameters are significant. The implications are that in terms of affluence, presence of children, and HOH age, the grocery and club channels are equivalent, but club stores attract fewer urban shoppers (i.e., the urbanicity x club interaction is negative). Mass merchandisers draw a younger, less affluent, and more rural clientele with children (all four geodemographics x mass parameters are significant). On average, drugstores tend to attract less affluent, older shoppers without children.
In the discussion of Research Question 3, we argue that the channel-category associations moderate the geodemographic-channel volume share relationship (i.e., the two-way geodemographic x category-channel associations interactions and the three-way geodemographic x category-channel associations x channel interactions). This thesis is supported; 5 of the 8 possible two-way interactions and 9 of the 24 possible three-way interactions are statistically significant (at p < .01). The 14 significant effects are split relatively evenly across the two association dimensions (8 for purchase frequency and 6 for differentiation). Moreover, 4 of the significant three-way interactions involve the mass merchandiser channel, and the other 5 involve the drug channel. As is evident in the two-way geodemographics and channel results, mass merchandiser and drugstore clienteles are different from those of grocery, but club and grocery clienteles are similar.
We also argue that the channel-category associations interact with channel such that channels enjoy a greater volume share for categories with which they are more associated. This is strongly supported; all six of the association x channel interactions are statistically significant. As we predicted, mass merchandisers’ volume share is buoyed for the categories that are more closely associated with mass merchandisers (i.e., as is shown in Figure 4, low category-purchase frequency/low category differentiation). Club's volume share is relatively unaffected by the associations (see Table 4), which makes sense because its position near the center of Figure 3 indicates relatively weak category associations. Finally, drug's volume share is greater for the categories with which it enjoys a closer association (i.e., per Figure 3, low category-purchase frequency/high category differentiation).
Across the four channels there are 60 parameters, which makes interpretation of the results somewhat arduous. In an effort to simplify the exposition, we compiled Table 5, which shows the net channel share equation for each channel (i.e., setting the channel-indicator variables appropriately in Equation 1). Because grocery is the base channel, the model intercept, the geodemographics main effects, the channel-category association main effects, and the two-way interaction between geodemographics and the channel-category associations represent the estimate of grocery channel share of volume (i.e., the channel dummy variables are all set to zero so that all the nongrocery terms drop out). Because the dependent variable is channel volume share, the magnitude and direction of a coefficient may indicate that the impact of the channel and the channel-category association interactions are (1) in the same direction as grocery but weaker/stronger or (2) in the opposite direction as grocery. With the mass merchandiser equation as an example, the share sensitivity intercept (.452) represents the sum of the model intercept (i.e., .508) and the mass merchandiser indicator parameter (-.056). Similarly, the urbanicity x purchase-frequency effect (-.045) is the sum of the urbanicity x purchase-frequency interaction (.012) and the three-way mass merchandiser x urbanicity x purchase-frequency interaction (-.057).
Grocery
Grocery enjoys the greatest base share (i.e., the largest intercept). However, the dimensions affect grocery's average volume share substantially. Because the channel-category association dimensions range between −1.2 and 1.2, the purchase-frequency parameter of -.357 indicates that the grocery channel's share of volume is approximately 86% (i.e., .508 + .357) for categories with a purchase-frequency value of −1.0 and only 15% for categories with a purchase-frequency value of 1.0 (when we control for the other variables). Similarly, differentiation affects grocery's share of volume, albeit to a much lower degree (b = -.138). Grocery's share for a category with a differentiation value of −1.0 is approximately 65%, but it is only 37% for a category with a differentiation value of 1.0. For the geodemographic variables, only affluence and urbanicity exert a significant effect on grocery's volume share. The positive values of the parameters indicate that more-affluent shoppers and more-urban shoppers tend to satisfy their needs in the grocery channel. Furthermore, the interactions between affluence and urbanicity with purchase frequency indicate that this attraction is even stronger for the categories that are more closely associated with grocery (higher purchase-frequency categories). The effects of presence of children and HOH age are weak; only two of the four parameters achieved significance. Households with children tend to shop at grocery stores for frequently purchased categories (i.e., the kids x purchase-frequency interaction is positive and significant), and older consumers tend to shop at grocery for categories that are more differentiated (i.e., the age x differentiation interaction is positive and significant).
Mass merchandisers
Mass merchandisers present a much different picture than grocery does. It is not much of an exaggeration to note that mass merchandisers attract the opposite clientele of grocery. Both channel-category association dimension parameters are positive and significant. The net effect is that mass merchandisers would enjoy a 79% share (i.e., .452 + .334) for categories with a purchase-frequency value of 1.0 and only a 12% share for categories with a purchase-frequency value of −1.0. The effect of differentiation is less but still substantial; mass merchandiser share ranges from 61% for categories with a differentiation value of 1.0 to 29% for categories with a differentiation value of −1.0.
Notably, all the geodemographic effects are statistically different from grocery, and three are of the opposite sign. Mass merchandisers attract less affluent, more rural households than does grocery, and the households tend to be younger and to have children. Furthermore, three of the four interactions with purchase frequency are significant and negative. This implies that younger, less affluent, rural households are attracted to mass merchandisers for infrequently purchased categories. These tend to be nonfood categories, a traditional strength of mass merchandisers. Only one interaction with differentiation is significant: that with age. This means that younger households are attracted to mass merchandisers for categories that are less differentiated.
Club stores
The geodemographic profile of club stores is quite similar to that of grocery, but the role of the channel-category association dimensions is attenuated. The base share of club is only 3% on average (i.e., the intercept is .032), and the channel-category association dimensions serve to shift this by a relatively small amount. Club realizes a 4% share for categories with a purchase-frequency value of 1.0 and a 2% share for categories with a purchase-frequency value of −1.0. The effect of differentiation on club share is practically nil (i.e., the differentiation parameter of -.138 is negated by the club x differentiation interaction of .139). This makes intuitive sense, because the club channel is located near the center of Figure 3, which suggests that it is not particularly associated with many product categories. Furthermore, only 1 of the 12 geodemographic parameters is significant: urbanicity. Compared with grocery stores, club stores attract a slightly less urban shopper. This is probably the result of club stores being located in suburbs, which are not quite urban and not quite rural. In summary, club's share of channel volume is small but relatively stable across product categories.
Drugstores
The drug channel's base share (the intercept) is small, at approximately 2%. Given the size of the base share, the effects of the channel-category association dimensions and the geodemographics are rather limited. The effects of the two channel-category association dimensions are almost the same magnitude but in opposite directions (.025 for purchase frequency and -.023 for differentiation). This implies that drug benefits the most from the categories that are relatively more closely associated with drug, that is, products that are relatively more differentiated and purchased infrequently (e.g., health-related products). For example, drug has a predicted 4% share for a category with a purchase-frequency value of 1.0 (.019 + .025) and for a category with a differentiation value of −1.0 (.019 + .023).
Regarding geodemographics, drugstore shoppers are less likely to have children, and they tend to be older than shoppers in other channels. That is, households without children exhibit a drug-channel share that, on average, is 1.7% (parameter value of -.017) greater than households with children, whereas a household with HOH age of 65 has a predicted drug-channel share that is 3.1% greater than a household with HOH age of 26 (i.e., 65 x .001 - 26 x .001). The affluence parameters are the smallest of all channels; the significance of the two-way affluence x drug interaction deflates the affluence effect for drugstores (i.e., drugstore shoppers tend to be less affluent in general). In contrast, urban shoppers are more likely to patronize a drugstore, which increases the expected share by more than 3%. The geodemographic x association dimensions’ interactions mirror those of the association dimensions’ main effects, and the signs reverse across the dimensions. This implies that drug's volume share benefits from categories with which it is more closely associated (more differentiated and infrequently purchased) among more urban, older households without children.
Discussion
Taken together, the results of the empirical study provide insight into the three research questions we posed in the introduction. First, for channel-category associations, the channels form a channel triangle in which drug, mass merchandisers, and grocery are near the vertices and club stores are in the middle. Each vertex is associated with certain product categories: the grocery channel with food products, the drug channel with medications and health-related products, and the mass merchandiser channel with household items. In contrast, the club channel exhibits more heterogeneity in terms of product categories that readily come to consumers’ minds. In a relative sense, frozen foods, pet foods, and snack items are most closely associated with the club channel; cleaning supplies, automotive, gifts, beauty care, miscellaneous household items, and paper goods are most closely related to the mass merchandiser channel; and tobacco, alcohol, candy, magazines, and soaps are perceived as closest to the drug channel.
The correspondence analysis reveals important new insights into the channel-category associations. For example, animal or pet products map closer to the club channel than to other channels, though a substantial portion of pet food is sold in grocery and mass merchandiser channels (e.g., according to the Nielsen wand panel in 2000, 32% of dry cat and dog food was sold through mass merchandisers, and 54% was sold through grocery stores). Furthermore, miscellaneous items such as hosiery and beauty aids are more closely associated with the mass merchandiser channel, though the drug channel carries many of these items. Cleaning supply items are more closely associated with the mass merchandiser channel than with the club channel, though club stores sell a sizable amount of cleaning supplies. Notably, vice products, such as cigarettes and alcohol, are closest to the drug channel, despite the fact that the drug channel's signature products are health care and medical items and that other channels sell a high amount of vice products (e.g., drug's share of cigarette and liquor sales was 7% and 22%, respectively).
Second, channel share of volume depends directly on the geodemographic factors of affluence and urbanicity and indirectly on all four geodemographic factors (i.e., affluence, urbanicity, presence of children, and HOH age). Drug channel share of volume tends to be driven by older, more urban households without children, and mass merchandiser share of volume is driven by younger, less affluent, nonurban households with children. The drivers of club share of volume factors tend to be quite similar to those of grocery. Notably, the geodemographic groups exhibit the “polygamous loyalty” that Dowling and Uncles (1997) identify; that is, they split their loyalty across multiple channels. Furthermore, the relative variation in the channel splitting varies across categories, depending on the associations of product categories with the channels.
Third, our findings suggest that the channel-category associations influence channel share of volume both directly and indirectly. Figure 6 is a Venn diagram that depicts the percentage of total variation in channel volume share that is attributable to the three factors examined here (channel-category associations, channel, and geodemographics). The strong role of channel-category associations is clear; the associations explain 72% of variation in channel share of volume (when we sum across the main effects and all the interactions). Notably, the lion's share of this explanatory effect derives from the interaction with channel, which accounts for 43% of the total explained variance. In sharp contrast to their role in a specific category (Curry 1993), geodemographics explain only a small proportion of variation in volume share across categories and channels, contributing to only approximately 2% of explained variance. This illustrates the importance of channel-category associations in driving channel volume and emphasizes that it is imperative to consider these associations when mapping out a channel strategy.
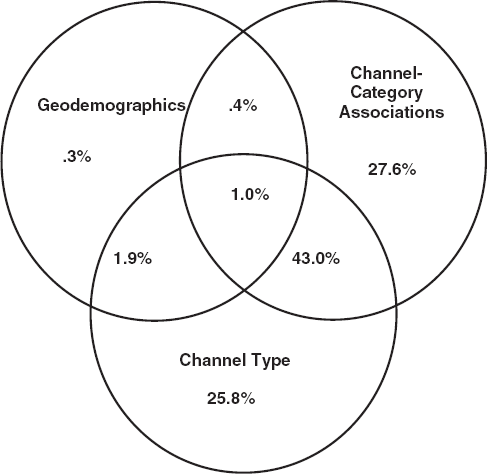
Venn Diagram of Relative Squared Standardized Coefficient Percentages of Channel Type, Geodemographics, and Channel-Category Associations on Channel Volume Share
Illustration of Channel Share of Volume
To illustrate the sensitivity of channel share of volume to the variables, we examined the range in channel volume share across the four channels for four different product categories. Referring to Figure 3, we selected a hypothetical category at the middle of the map (where the two association dimensions are zero) and one near each corner of the channel triangle. These are health care/over-the-counter (OTC) medications near the upper-left-hand vertex (purchase frequency = .90, differentiation = -.63), juices near the lower vertex (purchase frequency = -.95, differentiation = -.07), and cleaning supplies near the upper-right-hand vertex (purchase frequency = .43, differentiation = .93). The estimation of the range of share for each channel for each category was a two-step process. We began by inserting the appropriate values for the association dimensions and channels into the regression results. We then used the solver function in Excel to determine the maximum possible share for each channel given the range of possible geodemographic values (e.g., urbanicity is 0 or 1, age ranges between 26 and 65). The results of the illustration are shown in Table 6.
Illustration of Range in Channel Share
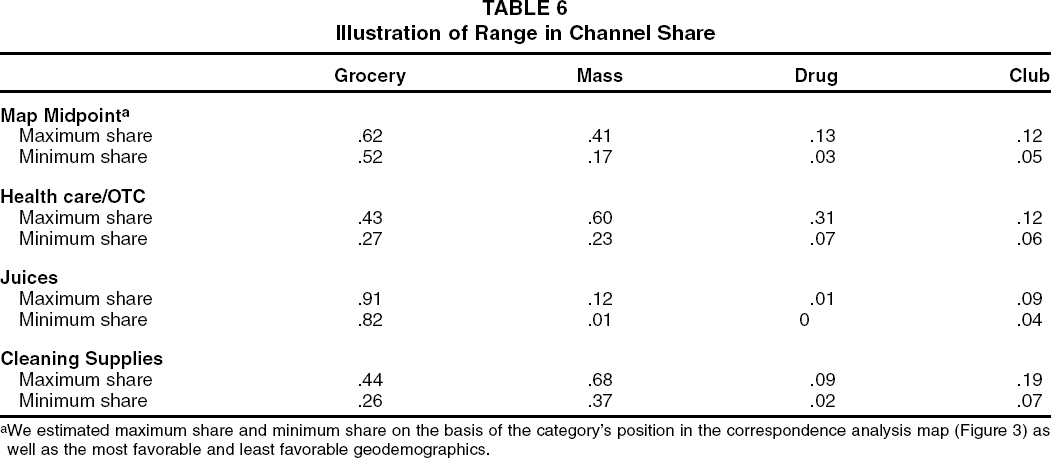
We estimated maximum share and minimum share on the basis of the category's position in the correspondence analysis map (Figure 3) as well as the most favorable and least favorable geodemographics.
The wide variation in channel share as a function of the channel-category associations is readily apparent. The maximum expected share of grocery ranges from 43% for the health care/OTC category to 91% for juices (the category with which it enjoys the strongest association), and mass merchandisers’ maximum expected share ranges from a low of only 12% for juices to a high of 68% for cleaning supplies (the category with which it enjoys the closest association). Similarly, the maximum expected share of drug varies from a low of 1% for juices to a high of 31% for health care/OTC (with which it is most closely associated), whereas club's maximum expected share ranges from 9% for juices to 19% for cleaning supplies. Club's share does not exhibit as much variability across categories, which is a direct outcome of its central location on the map.
Notably, the geodemographic factors create a rather wide range of expected shares across the channels and categories. For example, based on the level of the geodemographic factors, the maximum share of grocery for a category in the center of Figure 3 is ten share points greater than the minimum expected share (62% versus 52%). This difference between the maximum and minimum expected shares is replicated across categories and channels. Thus, although the geodemographics explain a relatively small percentage of the variation, they play a substantial role in driving channel volume and deserve managerial attention.
Managerial Implications
Although the results of our study are not normative, several insights emerge from our analysis. A summary of the linkages among the channels, channel-category associations, geodemographic clientele, interaction effects of the associations and geodemographics, and managerial implications appears in Table 7. The overarching takeaway is that though each channel has its own associated product categories and clienteles, the interaction of the associations and geodemographics offers valuable managerial guidelines for channel-category targeting and promotion decisions.
Links Among Channels’ Categories, Geodemographics, Share Drivers, and Managerial Implications

In addition to the implications highlighted in Table 7, the findings have several managerial implications. First, our results suggest that the geodemographics–channel relationship should not be generalized across product categories without taking category-channel perceptions into account. That is, managers should assess the importance of this relationship in light of the strength of the associations between their product category and the channels through which it is sold. Therefore, retailers’ marketing to geodemographic groups should be specific to product categories and dependent on the extent of category association with that channel.
Second, it may be the case that the tailoring of integrated marketing communications efforts across channels would increase profits. For channels in which there is a strong product association, manufacturers and retailers can leverage that association for competitive advantage. For example, household items are associated more with mass merchandisers. Mass merchandisers can use this knowledge to promote the items in order to reinforce their association with the products, and they can locate the items strategically to try to spur in-store need recognition (Inman and Winer 1998) and leverage interproduct complementarities (Shocker, Bayus, and Kim 2003). Similarly, club stores can promote snack items to capitalize on their association with these categories. In contrast, because mass merchandisers know that the association between their channel and household products is secure, they can move toward securing an association between their channel and other products.
From a public policy standpoint, the households patronizing lower-priced channels such as club stores tend to be more affluent, which may partially be a result of access and knowledge of prices in different channels. Less affluent households are less likely to have transportation to club stores and thereby suffer a double whammy of less affluence and higher prices. This is compounded by the tendency of club and grocery stores to be located in suburbs. It is noteworthy that less affluent rural households do not suffer from this price disadvantage; they have more ready access to mass merchandisers, particularly Wal-Mart, which tends to locate stores in small towns. Older, more-urban people tend to shop at drugstores, possibly because they dislike travel or are less price sensitive.
Further Research
Our findings should be viewed as a first step toward a better understanding of channel shopping behavior, because they suggest several directions for further research. First, our analysis was at the category and channel levels. It may be that certain brands in a category fare better in some channels than in others, perhaps as a function of the match between the target consumer and the channel's shopper base. For example, Target may be associated with more-upscale brands than Wal-Mart. This hypothesis remains unexplored. This type of association may be related to a deeper investigation of channel-category associations from a consumer behavior standpoint. Experimental investigation of consumer perceptions of channels and their associations with categories, and vice versa, would be useful in this regard.
Second, the role of urbanicity in channel share of volume can be explored in greater depth by examining recent channel-purchase data. As more mass merchandiser and club stores locate near urban areas, the negative relationship between urbanicity and share of volume of these channels may be weakened. This hypothesis can be tested with data from urban neighborhoods that have witnessed an increase in the number of mass merchandisers and club stores.
Third, the role of retail branding in channel-category associations and their effects on channel patronage deserve greater attention. For example, Wal-Mart now has different channels: mass merchandiser (Wal-Mart), hypermarket (Wal-Mart Supercenter), and grocery (Wal-Mart Neighborhood). The associations of a product category may extend from one channel to other channels if Wal-Mart branding is common across the channels. These changes in channel-category associations may have noteworthy effects on channel patronage. This possibility can be tested with the help of data from areas in which Wal-Mart operates in multiple channels.
Finally, our analysis has examined channel associations and their role in channel share of volume at a single point in time. If longitudinal data were available, it would be useful to explore the evolution of channel-category and channel-attribute associations over time. For example, mass merchandisers are devoting increasing amounts of shelf space to food items. This may lead to a “drift” of these items toward mass merchandisers and would help address the issue of the direction of the relationship between channels and particular product categories. It would also be worthwhile to determine how channel-service associations evolve as services become more common (e.g., banking, dry cleaning) in these channels.