
Abstract
The authors empirically explore the revenue impact of marketing-mix variables and their interactions. The findings include the following: pharmaceutical direct-to-consumer advertising and detailing (sales force) affect demand synergistically, detailing raises price elasticity, and detailing has a higher return on investment than does direct-to-consumer advertising. The authors also discuss other implications and provide future research directions.
From the 1970s to the early 1990s, the pharmaceutical industry communicated with consumers mainly through nonbranded public service announcements. During that period, the FDA required that DTC advertising mention a specific indication for a brand name drug and include a brief summary of side effects and adverse reactions from the FDA-approved label. In 1997, the FDA relaxed restrictions on the content of DTC, essentially making the advertisements considerably less expensive to broadcast.
However, no matter how many patients DTC may induce to walk into a physician's office, if a physician says no to a request for a specific medicine, significant advertising dollars have been potentially wasted. Given this, drug manufacturers are struggling to measure the cost effectiveness of their multimillion-dollar DTC campaigns. For example, according to Lee Weinblatt, chief executive officer of PreTesting, an advertising consultancy company in Tenafly, N.J., “Over 80% of our clients are questioning the efficiency of their consumer advertising” (PreTesting.com 2004).
Identifying marketing investments that generate a proven return on investment (ROI) is now a main concern for companies because such investments take funding priority over ones made on faith (see, e.g., Lehmann 2002). Moreover, firms are being urged to understand any synergy among the various elements of the marketing mix, such as detailing and DTC, in order to leverage the impact of such interactions. As Gatignon and Hanssens (1987, p. 257) point out, the optimal resource allocations that arise from models that account for marketing-mix interactions can be significantly different from those inferred from, for example, constant elasticity models.
Intuitively, if there were a positive, synergistic effect between DTC and detailing, it would be valuable to employ both simultaneously. However, if there were negative interactions, it might benefit firms to limit the overlap among the mix elements and perhaps devote more resources to the one that has a better return on the dollar. The arguments for examining interaction effects between detailing and DTC also hold for interaction effects between other promotional activities and between price and any other element of the marketing mix. 2 For example, with respect to the latter, if greater advertising reduces (raises) price sensitivity, it enables firms to raise (lower) prices.
These include interactions between meetings or events and detailing and meetings or events and DTC.
However, although academics have had a long-standing interest in understanding the effectiveness of marketing activities, limited attention has been devoted to the study of interactions among the elements of the marketing mix. For example, researchers have investigated the role of price x advertising interactions (for an overview, see Kaul and Wittink 1996), but little is known about the interactions among the various marketing-mix elements that are at the disposal of companies (e.g., in the pharmaceutical industry, these include price; detailing; DTC; and other marketing efforts [OMEs] such as journal advertising, meetings, and events). Our search of the literature, which spans a few decades, identified only eight studies that examine marketing-mix interactions at the aggregate level (see Table 1).
Prior Research on Interactions Between Marketing-Mix Elements
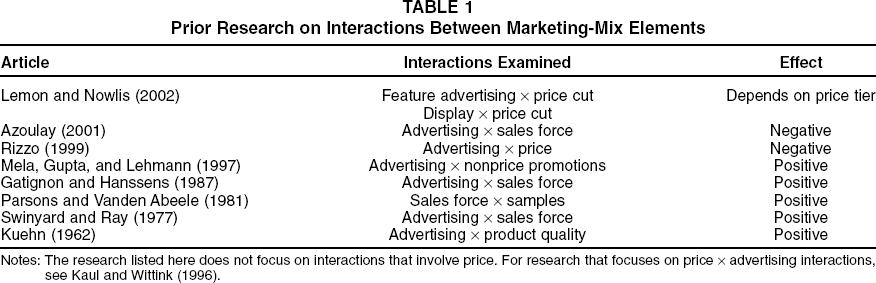
Notes: The research listed here does not focus on interactions that involve price. For research that focuses on price x advertising interactions, see Kaul and Wittink (1996).
Similarly, after reviewing 320 empirical studies on the determinants of (firms') financial performance, Capon, Farley, and Hoenig (1990, pp. 1144, 1159) make the following observations: “Only a handful of studies made an explicit attempt to model interactions among the causal factors,” and “There may be synergies (positive and negative) leading to various optimal combinations…. [W]ork on interaction of causal factors is badly needed if the analysis is to move towards optimal allocation of resources among controllable variables.”
Analogous sentiments are shared by other researchers in related contexts; for example, Blattberg, Briesch, and Fox (1995, p. G125) note: “Few empirical results have been generated regarding the synergies between feature advertising, displays, and price discounts” (for a recent review of that literature, see Lemon and Nowlis 2002). In summary, an understanding of whether marketing-mix elements such as DTC and detailing have a positive or negative synergistic effect appears to be important and warrants research attention.
To that effect, our empirical analysis focuses on two questions: First, are there any significant interaction effects between pairs of marketing-mix elements? For example, is the impact of detailing enhanced by DTC? Second, if there are interaction effects, what is their likely impact on revenues?
The latter question is relevant because previous academic research has largely been concerned with measurement (e.g., estimated demand elasticity, lagged effects of advertising), and the link to revenues (or other measures of financial performance) has rarely been made (see, e.g., Leeflang et al. 2000; Little 1979). There are two exceptions, both sponsored by the Association of Medical Publications: the work of Neslin (2001) and Wittink (2002). The main goal of these studies is to explore the “average” or “median” impact (across categories) of medical journal advertising along with DTC, detailing, and other promotional expenditures. Given the relatively large amount of data (e.g., Neslin analyzes monthly data from 391 brands), it is quite challenging to characterize the interaction effects among promotional expenditures in these studies (see, e.g., Wittink 2002). A common observation across the two studies is that the ROI for DTCs is quite low.
In a complementary way, our empirical analysis examines the second-generation antihistamine category of drugs. In addition, to assess the extent of our results’ category specificity, we analyze antiviral drugs that treat genital herpes. These two categories span the range from extensive use of DTC (antihistamines) to more limited use (antivirals), and they help ensure that the qualitative nature of our results is not driven entirely by the fact that antihistamines constitute a category with significant DTC.
Overall, the distinguishing features of our article are the following: (1) We explore the full range of interactions between pairs of marketing-mix elements and determine their differential impact on category sales and brand shares in two distinct prescription drug categories, (2) we assess the financial implications of detailing and DTC expenditures by providing ROI measures, and (3) we measure the impact of the interactions between marketing-mix elements both on the ROIs for detailing and DTC and on the price elasticities.
The rest of this article is organized as follows: In the next section, we review the relevant literature. The subsequent four sections discuss our model, the data, estimation-related issues, and the results, respectively. The penultimate section summarizes the managerial implications of our analysis, and the final section concludes with directions for further research.
Relevant Literature
Two main streams of research are relevant to our analysis: (1) research on the interaction between marketing-mix elements and (2) other research that examines pharmaceutical promotional spending. We discuss each of these subsequently.
The impact of detailing and DTC can be simply additive. Two recent studies (Neslin 2001; Wittink 2002) report such a possibility. Neslin (2001) uses monthly data from 391 branded products from various pharmaceutical categories and, for a “median” brand, estimates the impact of detailing and DTC on the number of prescriptions written by physicians. 3 He finds that the ROI for $1 of detailing is $1.72, and the corresponding ROI for DTC is $.19. 4 Wittink (2002) expands on this analysis by considering more data points and by distinguishing between the size of the brands and their launch date in characterizing the average response to promotional investments. Wittink also finds considerable difference between the ROIs of detailing and DTC; for example, for brands that have at least $500 million in annual revenues and that launched between 1998 and 2000, ROI for detailing is $11.60 and $1.30 for DTC. 5
The study examines two other promotional variables: (1) professional and medical journal advertising and (2) physician meetings and events.
The study also finds that the ROI for journal advertising is $5.00, the highest among all promotional variables.
Wittink (2002) also considers three therapeutic categories (hypertension, asthma, and arthritis) and examines the impact of promotions without distinguishing between brand-size and launch date. The results for these categories are similar to those that he finds for the difference between the ROIs of detailing and DTC.
Benchmark estimates, such as the preceding ones, obtained from pooling the data across a variety of pharmaceuticals are valuable to the understanding of the impact of promotional expenditures on market response. It is important to extend such research by exploring whether the results, articulated in terms of a median (or average) drug, apply to specific product-markets. Our study provides such an exploration.
In contrast to the additive effects we have outlined, other extant research finds evidence for synergies between marketing-mix elements (for a list of such studies, see Table 1). For example, Swinyard and Ray (1977) find that advertising's effectiveness is enhanced when it follows a personal selling encounter. However, there is also evidence in the literature of a negative interaction between detailing and DTC (e.g., Azoulay 2001); this effect is referred to as “jamming.” The premise of the argument is that detailing typically is a scientific source of information for physicians and that DTC swamps the positive effect, perhaps when physicians generate counterarguments to the claims in the advertisements.
Overall, the conclusions in extant research appear to be that the net interaction effect between detailing and DTC can be positive, nonexistent, or negative. Kaul and Wittink (1996) report evidence for both positive and negative interactions between price and advertising. As we have noted, the interactions also have important managerial implications. In this article, we explore the full range of possible interactions between pairs of the various marketing-mix elements.
Several researchers have estimated demand functions of oligopolistic branded products in various pharmaceutical subcategories (e.g., Berndt et al. 1997; Chintagunta and Desiraju 2004; Rizzo 1999). Although the demand model herein is similar to that in the work of Chintagunta and Desiraju (2004), our study differs in three important ways: First, we allow for a comprehensive set of interaction effects among the various marketing-mix elements. In contrast, Chintagunta and Desiraju focus on the strategic interactions among multimarket competitors in several countries. Second, the antidepressant category that Chintagunta and Desiraju examine does not have significant DTC expenditures for the data duration of their study. In contrast, we investigate two different product categories (antihistamines and antivirals) that have various degrees of DTC investment. Consequently, we account for the effects of DTC. Third, we explicitly include carryover effects of marketing activities in the analysis.
Two other related studies are also worth noting: those of Rosenthal and colleagues (2002) and Wosinska (2002). Both studies consider DTC's impact on demand. Rosenthal and colleagues find that 9% to 22% of category growth can be attributed to DTC. However, the focus of their study is not on profitability implications; furthermore, because of data limitations, they treat promotional spending as a simple flow and do not consider carryover effects. Wosinska uses a large panel of insurance prescription claims (Blue Shield of California) for cholesterol-lowering drugs and empirically makes two observations: First, DTC affects only the market shares of drugs on the formulary (i.e., the approved drug list); even for such drugs, the marginal impact of DTC on demand is lower than the marginal impact of detailing. Second, as we do, Wosinska finds that the impact of DTC is lower than that of detailing. In addition, we estimate the interaction between DTC and detailing and the profitability implications. We now discuss the various elements of our model.
Model
In discussing the model, we refer to the antihistamines product category for expositional convenience. We decompose the sales of each of the focal brands in a given period as the product of the category sales and the share of that brand. Category sales denote the number of prescriptions of all antihistamines (for both the focal brands and other anti-histamines) in that period. Category sales are a function of category-level marketing activities and variables that account for product diffusion over time. The conditional share equation reflects the share of each of the three focal brands and a fourth “brand” that represents all the other antihistamines available in the market. We use a linear sales model for category sales and a discrete choice model for brand share. This hybrid model is appropriate for various reasons, which we discuss subsequently.
First, the category-level sales specification enables us to model category-level diffusion and the marketing activities’ role in the process. It has been suggested in prior research (Wosinska 2002) that marketing activities such as detailing and DTC play a different role in category sales and brand switching. A goal of our study is to investigate the differential effects; in particular, we aim to explore the hypotheses that DTC is the primary marketing activity that drives category expansion and that detailing is the primary marketing activity that drives brand switching.
Second, a discrete choice model is particularly appropriate for modeling brand shares in our problem because physicians make a discrete choice from the available drugs. Our discussions with industry experts revealed that there are virtually no cases of multiple brands of antihistamines being prescribed simultaneously because they are considered substitutes. Furthermore, the models are parsimonious. This is important because we are interested in modeling interaction effects. If we were to introduce all possible interactions between different marketing variables and for different brands, the dimensionality of the problem would make alternative models, such as linear sales models, extremely difficult to estimate with the available data.
In addition, we need to accommodate time-varying choice-sets. Initially, there was only one drug in the category: Claritin. Subsequently, Zyrtec and Allegra were introduced. The mixed-logit discrete choice specification that we use can easily account for such changes in the choice set. Most alternative models cannot account for this without having regime-specific effects (e.g., when there is one brand or two brands) in addition to all the other estimated parameters.
The preceding are our various reasons for employing a hybrid model to explore the issues at hand. We subsequently describe the category sales and conditional share models.
Category Sales Model
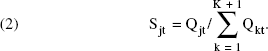
Let Qjt denote brand j's sales in month t, where j = 1, 2, …, K + 1, the first K brands are the focal brands of interest, and the K + 1 brand is the “all-other” brand. We determine category sales by aggregating the sales of all brands. The relationships between brand sales, category sales (CQt), and share (Sjt) are given by the following:

The category sales level depends on the prices, detailing, DTC, and OMEs of all brands in the category. In addition, it depends on factors such as seasonality (SD1 and SD2). 6 To capture possible diffusion effects due to the introduction of new brands and category growth, we include linear and quadratic time trends (t and t2). The category sales regression model is given as follows:
Note that we use SD1 = 1 for March–June (the spring allergy season) and SD2 = 1 for September–October (the fall allergy season).

The category stocks of goodwill associated with detailing, DTC, and OMEs (e.g., meetings) are denoted by CDt, CAt, and COMEt, respectively. The Verispan data we use in the empirical analysis reports a category price for each period, which is the share-weighted price of the individual brands. We denote this price as CPt. The interaction terms between detailing and price, DTC, and OMEs are denoted by CDPt, CDAt, and CDOMt, respectively. Similarly, CAPt and CAOMt represent interaction terms between DTC and price and OMEs, respectively, and COMPt represents the interaction term between OMEs and price. Thus, we account for all possible paired interaction effects. 7 Finally, in Equation 3, et is the random error term and ρ0 – ρ10, κ, τ1, and τ2 are parameters to be estimated. 8
We do not explore higher-order interactions because the data are insufficient to obtain precise estimates for such effects.
Note that category prices, detailing, and DTC are likely to be endogenous (i.e., correlated with the error term). We address this issue by using instruments for these variables.
We employ the standard Nerlove–Arrow (1962) exponential decay goodwill model (see also Lilien, Kotler, and Moorthy 1992, p. 280) for each brand. Let djt, ajt, and omejt represent brand j's level of detailing, DTC, and OMEs, respectively, in period t. Thus, the jth focal brand's goodwill stocks in period t (Djt, Ajt, and OMEjt) are


and

where θD, θA, and θome are the carryover coefficients for detailing, DTC, and OMEs, respectively, and the square root captures diminishing effects (Erickson 1992). We constructed the category stock variables for detailing, DTC, and OMEs exactly as we did for category detailing, DTC, and OME variables, respectively. Note that we could also have captured diminishing effects with quadratic terms or logarithms. A quadratic specification would involve estimation of a large number of additional parameters, particularly because of the interaction terms. A logarithmic specification is unable to deal with zeros in the variables. However, the square root specification avoids such problems and is appropriate for our analysis.
Conditional Share Model
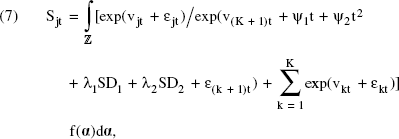
We employ a mixed-logit formulation (see, e.g., Chintagunta and Desiraju 2004; McFadden and Train 2000) to specify the focal brand j's share in period t, denoted by Sjt:
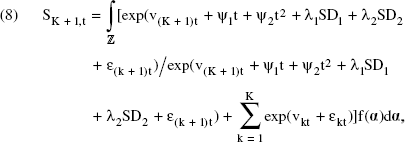
and for the all-other brand, denoted by SK + 1, t:
where

where
Note that t denotes the time, in months, since the introduction of the first of the three brands under consideration and captures the time trend in the share growth (decay) of the focal brands in the market compared with that of all-other brands. If we change this to a variable specific to each drug based on the time of its introduction, only the estimates of the brand-specific intercepts are affected.
We also included higher-order terms, but they did not affect the results significantly.
Our rationale for introducing the term εjt in Equation 7 is as follows: There are several unobserved brand- and time-specific factors—potentially correlated with prices, detailing, and DTC—that could influence a brand's sales. These include the influence of organizations such as health maintenance organizations and other factors such as the publication of medical studies and newspaper articles about newly discovered side effects. All such factors are reflected in εjt, and we assume that it is a mean zero term.
In Equation 7, we explicitly account for heterogeneity by assuming that the αj parameters are draws from some unknown underlying distribution.
11
We use
The variation in the parameters could be due to various reasons, including cross-sectional heterogeneity, by which the preferences and sensitivities to marketing activities could vary.
This mixed-logit formulation does not suffer from the restrictive elasticities that are typically associated with the standard logit model, which is the main reason we use this specification. In addition to the mixed-logit model's allowing for more flexible substitution patterns, because it preserves the basic logit structure, it can be interpreted as the aggregation of choice probabilities of heterogeneous utility-maximizing agents. 12 Note that we could have specified a mixing distribution on the other parameters as well (e.g., price sensitivity, detailing sensitivity). However, because of data limitations, we restrict ourselves to specifying this distribution only for the brand intercepts.
For a more detailed discussion of how this mixed-logit approach allows for flexible substitution patterns, see, for example, Nevo (2000) and Berry, Levinsohn, and Pakes (1995).
Overview of the Data
In this section, we discuss the data for the first category we study: second-generation antihistamines. A reason for our focus on antihistamines is the increasing use of DTC by leading firms in the category. Furthermore, industry experts indicate that in categories in which generics have been introduced, firms tend to reduce (if not discontinue) detailing activities. Therefore, to better understand the impact of detailing, it is critical to select a category in which generics have not yet accrued significant market shares. For these reasons, we focus on the marketing-mix decisions of three branded antihistamines: Claritin, Zyrtec, and Allegra.
Our data, obtained from Verispan, comprise observations on three brands of second-generation antihistamines and the fourth all-other brand, which is the aggregation across all other antihistamines (first-generation antihistamines and prescribed over-the-counter medications). The second-generation antihistamines perform much like the first-generation drugs (e.g., Chlor-Trimeton, Benadryl) but improve “quality of life” considerably as a result of improved side-effects profiles (e.g., less drowsiness).
The observations in the data are for the entire U.S. market, on a monthly basis, from April 1993 through March 2002. For each brand, the data set tracks the total prescriptions written, the average retail price of the prescription, detailing expenditures, DTC expenditures, and OME expenditures. Descriptive statistics for the data appear in Tables 2 and 3, and Figures 1–4 depict the time series of sales, detailing expenditures, DTC expenditures, and OME expenditures, respectively. Note that the timing of introduction of the three brands is as follows: Claritin in April 1993, Zyrtec in January 1996, and Allegra in August 1996.

New Prescriptions

Detailing Expenditures
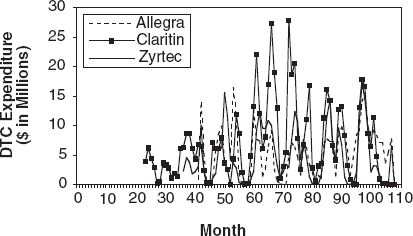
DTC Expenditures

OMEs Expenditures
Number of Prescriptions and Market Shares: Antihistamines

Prices, Detailing, DTC, and OMEs: Antihistamines

Notes: Prices and expenditure on detailing, DTC, and meetings are all expressed in constant January 1993 dollars.
Estimation Issues
Methodology
The category demand function in Equation 3 is a simple linear regression. We used the methods laid out in the work of Berry (1994) and Nevo (2000) to obtain estimates for the parameters of the brand-share function in Equation 7. We deflated prices using the consumer price index for all urban consumers. We deflated detailing expenditures using the wage series for all workers. We obtained the consumer price index and wage series from the Bureau of Labor Statistics (BLS).
Our price variable is the average retail price per prescription. We believe that this is a reasonable measure because, according to industry experts, physicians or patients often use price per prescription to compare medications.
Instruments
Our analysis assumes that firms’ prices, detailing, and DTC activities are endogenous in the category sales and brand- share models. Thus, we needed to instrument for these variables in the estimation because they could be correlated with the error terms. We used three sets of instruments in the estimation. The first set has variables that could potentially drive the costs of producing the drugs and includes the producer price index (PPI) for pharmaceuticals, obtained from BLS. This series captures the prices for bulk drugs and therefore a component of the costs faced by the marketers of brand name antihistamines. In the estimation, we allowed the instruments to influence prices of the various brands differentially by interacting them with the brand intercepts in the estimation. Furthermore, we used lagged values (up to 12 periods) of the PPIs interacted with the brand intercepts as additional instruments. Thus, we constructed 36 (12 × 3 = 36) instruments from the PPIs.
For detailing instruments, we compiled the data for the number of employees from the annual reports of the firms in our data set. Although firms report financial numbers to the Securities and Exchange Commission every quarter, they report the number of employees only annually. We assumed that the number of employees in any month was the same as for the year. Thus, we developed one instrument from the employee data. 13 Finally, we used the PPIs for television, radio, and print advertising (which we obtained from BLS) as instruments for DTC. We also included interactions of the instruments for price, detailing, and DTC to construct the overall instrument matrix. 14
Note that the firms in the data set are Schering-Plough (maker of Claritin); Aventis (maker of Allegra), which was formed by the merger of Rhone-Poulenc and Hoechst (thus, for earlier periods, we used the sum of employees for the two firms); and Pfizer (maker of Zyrtec), for which we added Warner-Lambert's figures before it merged with Pfizer.
We also conducted two additional sets of analysis. First, we conducted a robustness check using another set of instruments that contained promotional expenditures in the nasal steroid category. There are common underlying factors that drive promotional spending in both categories. In addition, regulatory factors, seasonality, and other institutional factors are similar between the two categories. Thus, the nasal steroid promotional activities are likely to be correlated with those in the antihistamine category but uncorrelated with the error term. Second, we also compared predictions for a holdout sample with the sets of instruments. The overall results are consistent; all these analyses are available on request from the authors.
The Heterogeneity Distribution
We assumed that the set of parameters,
Carryover Parameters
The carryover parameters (θD, θA, and θome) could not be estimated and needed to be fixed. Our preliminary analysis with simple models that allow for the estimation of these parameters revealed that carryover parameters were 86%, 75%, and 92% for detailing, DTC, and OMEs, respectively. For our estimation, we fixed the carryover rates at these values. 15 The rates seem to be consistent with other findings in the literature. For example, Roberts and Samuelson (1988, Table 2) report advertising retention rates of greater than 80% in the cigarette industry, and Berndt and colleagues (1997) report a carryover rate of 85% for advertising in the antiulcer pharmaceutical market. 16
We found the parameters using a grid search for a simple aggregate logit model with an outside good to represent category growth. The aggregate logit model reduces to a linear regression, and we chose the parameters with the highest R2. Such a grid-search method is a fairly standard way of estimating the carryover parameters. For example, Wittink (2002) uses a grid search to find the carryover parameter; similarly, Guadagni and Little (1983) use a grid search to find the carryover for the loyalty smoothing parameter. Berndt and colleagues (1997) also use a grid-search methodology similar to ours, in which we estimate the model for various values of carryover and choose the set of parameters for which the sum of squared residuals is the lowest. Note that if we conducted this grid search for our full model, each iteration of the mixed-logit model would take several hours.
For further evidence on retention rates (including on monthly data), see Clarke's (1976) survey of results from more than 70 studies that use the distributed lag structure.
Standard Errors
We computed the heteroskedasticity and autocorrelation consistent standard errors using Newey and West's (1987) estimator.
Results and Discussion
This section is divided into several subsections that are organized as follows: We begin by discussing the parameters of the demand function. We then discuss the single- and multiperiod ROI measures for DTC and detailing. We next discuss the impact of marketing-mix interactions on ROI and consider the impact of the interactions on price elasticity. Finally, we present the results from the antiviral category.
Parameters of the Demand Function
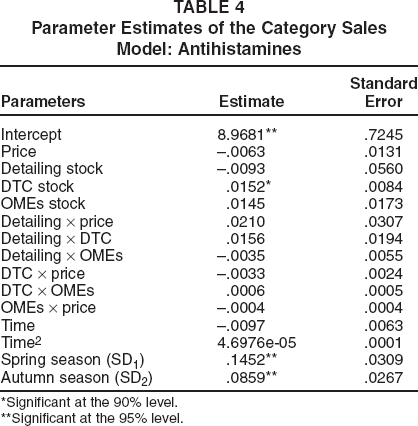
In Table 4, we provide the parameter estimates and the standard errors from the category sales regression model in Equation 3. Note that in this model, we explicitly account for the endogeneity in price, detailing, and DTC stock variables by using PPIs for pharmaceuticals as instruments for prices; employees in all the three firms in the category as instruments for detailing; and PPIs for radio, television, and print advertising as instruments for DTC. We find that after controlling for the two seasonal effects and the diffusion effects through the time trend, only DTC has a statistically significant effect. This finding is consistent with previous research (Wosinska 2002). Table 4 also indicates that none of the marketing-mix interactions are statistically significant. We find that the two seasonal dummy variables have significant effects, which reflects the strong seasonality in the category as a whole.
Parameter Estimates of the Category Sales Model: Antihistamines
Significant at the 90% level.
Significant at the 95% level.
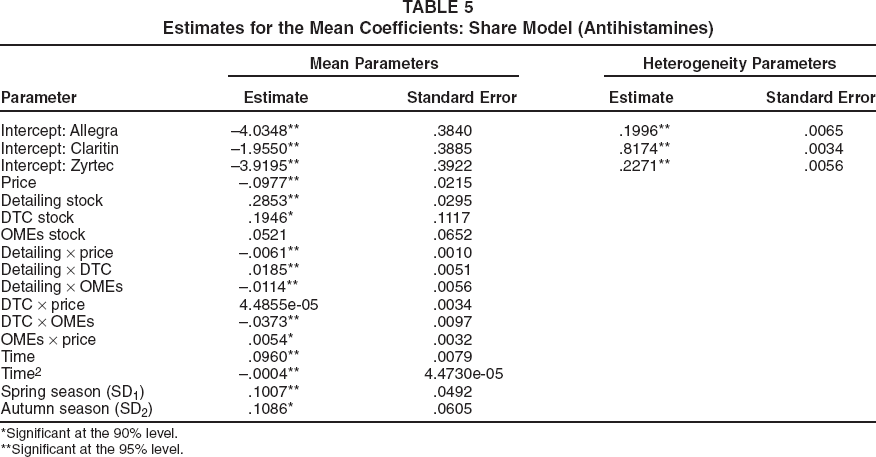
We report the estimates for the parameters of the conditional share model, from Equation 7, in Table 5. 17 We find that Claritin is the most preferred brand, followed by Zyrtec and Allegra, in that order. The parameter estimates for the main effects of price, detailing, and DTC are statistically significant and have the expected signs. Detailing and price are significant at the 95% level, and DTC is significant at the 90% level. However, the parameter for the direct effect of OMEs is insignificant. These results, together with the ones for the category sales model (Table 4), reveal a notable contrast. Although detailing has a significant effect on brand switching but not category sales, DTC has significant effects both on category sales and on brand switching.
Estimates for the Mean Coefficients: Share Model (Antihistamines)
Significant at the 90% level.
Significant at the 95% level.
Note that we instrumented for all endogenous variables in this estimation, and the “base brand” is the all-other brand that has been included in the analysis.
It is worthwhile to compare these findings with ones from previous empirical research. Rosenthal and colleagues (2002) find that detailing and DTC affect only category sales (not brand share); furthermore, DTC has a greater impact than detailing on category sales. Wosinska (2002) finds that both DTC and detailing affect brand share, but the impact of detailing is greater than that of DTC. As does Wosinska (2002), we find that detailing has a greater effect on brand switching than DTC.
We find that there are four interaction effects that are significant at the 95% level: the interactions between (1) detailing and price, (2) detailing and DTC, (3) detailing and OMEs, and (4) DTC and OMEs. In addition, the interaction between OMEs and price is significant at the 90% level. The interactions between detailing and price, between detailing and OMEs, and between DTC and OMEs are all negative. The interactions between OMEs and price and between detailing and DTC are positive.
The positive interaction between detailing and DTC implies that there is synergy between the two marketing activities. In other words, a physician sales call (which usually emphasizes the therapeutic benefits of a brand) has a greater impact when combined with the brand's television or print advertisement (which induces consumers to ask their physician about it). In the context of pharmaceutical promotional expenditures, to our knowledge, this is the first time that such a positive synergy has been documented.
In contrast, the finding of significant, negative interactions between OMEs on the one hand and DTC or detailing on the other hand points to the lack of synergy between these pairs of activities. Coupled with the finding of no significant main effect for OMEs, it appears that OMEs’ influence on the demand for the three antihistamines is limited.
The set of interactions between price and detailing and between price and OMEs is also notable. As we noted previously, the detailing x price interaction is negative and significant. Because the main effect of price is negative, a negative interaction implies that greater detailing increases price sensitivity. In turn, this implies that more detailing reduces the prices that firms can charge for their drugs. The OMEs x price interaction is significant at the 90% level but, in contrast to the detailing x price interaction, is positive. This implies that greater amounts of OMEs reduce price sensitivity and therefore enable firms to charge a higher price for their drugs. The interaction between price and DTC is not statistically significant.
Next, to understand the joint impact of main and interaction effects of the promotional expenditures, we compute the short-term promotional elasticities. For example, by “short-term detailing elasticity,” we refer to the percentage change in current-period sales (prescriptions written, in our case) for every percentage change in detailing investments. These elasticities enable us to compare the estimated magnitudes of the coefficients of detailing and DTC investments for the three brands. We compute the elasticities by simulating the new sales of each brand by varying the respective promotional variable by 1%. In principle, when a variable changes for a particular brand, it also changes for the category as a whole. Therefore, the elasticities incorporate the effects through the brand-share model and the category model. Detailing share and DTC elasticities are reported in Table 6.
Current-Period Detailing and DTC Elasticities: Antihistamines
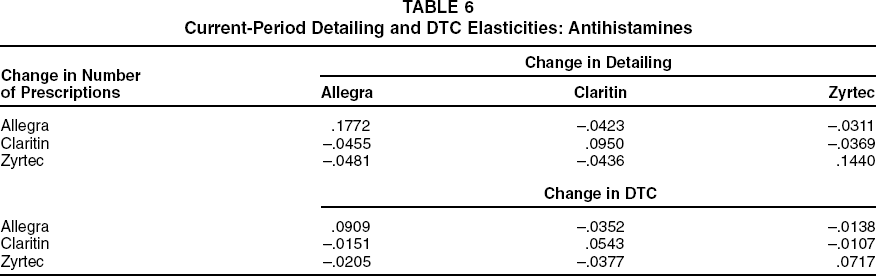
Inspection of the elasticities reveals that, overall, detailing has a much greater impact on shares than does DTC. 18 Furthermore, Allegra's detailing has the greatest negative effect on the shares of the other two brands, and Zyrtec's detailing investments have the least effect. Although the DTC own-elasticity for Claritin is the lowest of the three brands, its DTC cross-elasticities are higher than those of the other brands. Thus, although the own-effect of Claritin's DTC is low, it is still able to affect the other brands’ shares more than they affect its share.
These results appear to be largely consistent with those reported by Wosinska (2002), who used individual-level data. They are also consistent with Wittink's (2002) analysis of large brands (i.e., with revenues of more than $500 million) introduced in 1998–2000 (see “Literature Review” herein). However, Wittink does not present explicit elasticity estimates.
This pattern of elasticities implies that the nature of competition across brands is highly asymmetrical. For example, the first entrant (Claritin) is able to affect sales of the other brands negatively through DTC investments, but it is not as susceptible to the other brands’ DTC investments. In the case of detailing investments, Allegra has the greatest effect on the sales of the other brands, and the effect of Claritin is smaller but comparable. Coupled with the higher intrinsic preference for Claritin (Table 5), its high cross-elasticities imply that the brand is in a strong position in the antihistamine marketplace. Allegra's detailing has a large impact on other brands, but its DTC has a relatively small impact. In contrast, the effect of Zyrtec's detailing and DTC investments on the sales of the other brands is relatively small. Nevertheless, that Zyrtec can influence its sales through promotional investments is good news for the brand; the high own-elasticities suggest that it is able to influence its own sales by stealing share from the all-other group that we included in the analysis.
ROI Measures
We now turn to short-term or single-period ROI, which is the revenue impact of the marginal dollar spent on a particular promotional activity:
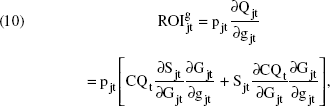
where g is the promotional activity and G is the goodwill stock associated with the promotional activity (i.e., d and D denote detailing, and a and A denote DTC), p is the price, Q is the sales, CQ is the category sales, and S is the share of the respective brand. We also computed the ROIs by simulation; we varied the respective promotional activity by one dollar and simulated the new sales. Table 7 presents the current- and multiperiod ROIs. 19 Note that these ROIs are in terms of revenues that correspond to retail prices. Thus, actual revenues for the manufacturing firm would be lower because the revenues would be net of retail and wholesale margins. This must be kept in mind during discussions of the ROI numbers.
ROI Measures: Antihistamines

Notes: Multiperiod indicates current period + 11 subsequent periods.
We discuss how we computed the multiperiod ROIs later in this section.
Table 7 reveals that average current-period detailing ROIs are $1.28 for Allegra, $1.49 for Claritin, and $1.10 for Zyrtec. Thus, the marginal $1 spent on detailing returns more than $1 in revenue. This finding supports an increase in the level of detailing, except if it induces competitive reaction that raises rival detailing expenditures and makes the increased spending not pay out. We find that the ROIs for DTC are lower than the ROIs for detailing and less than $1. Specifically, the average current-period ROIs are $.85 for Allegra, $.66 for Claritin, and $.76 for Zyrtec. That ROIs are less than $1 suggests that firms would be better off reducing their expenditure on this marketing activity. However, as we discuss in the next paragraph, to obtain a more complete picture of investment returns, both single- and multiperiod ROIs should be assessed.
Current-period ROIs ignore that effects of marketing investments last more than one period. Indeed, in our specification, there is carryover of 86%, 75%, and 92% for detailing, DTC, and OMEs, respectively. When a firm raises its promotional expenditure by one dollar, that one dollar affects goodwill not only for the current period but also for future periods. When this intertemporal linkage is taken into account, a multiperiod ROI needs to be reported.
We used the following procedure to compute a multi-period ROI: For a given set of values of all the independent variables, we computed the expected value of the dependent variables (shares, category sales, and consequent revenues). Then, we raised a given promotional expenditure for a single focal period by one dollar and computed the new revenues in the current and subsequent periods (under the assumption that competitors do not react to such an increase in expenditure). We repeat this experiment for all periods (except the last 11 periods) and report the multiperiod ROI as the average change in the sum of revenues for the current and 11 subsequent periods for every additional one dollar spent on that promotional activity in the current period. That is, multiperiod ROI represents the change in revenues for a year from the period in which the promotional activity changes. These ROIs are also reported in Table 7 for both detailing and DTC. We note that long-term ROIs for detailing and DTC are much higher than for single-period ROIs (Table 7). Thus, detailing continues to have a greater effect than DTC, even over a longer horizon.
It is worth comparing our findings with those in previous studies that report ROIs for detailing and DTC. Neslin (2001) reports (multiperiod) ROIs of $1.72 for detailing and $.19 for DTC. These are considerably lower than the ROIs in our study. However, when we compare our ROIs with those reported for large categories (i.e., categories with median brands that have revenues of more than $200 million per year; under this definition, antihistamines are a large category), our results are more comparable. Neslin reports the detailing ROI for large categories launched in the 1994–1996 period to be $6.76; for large categories launched after 1996, the detailing ROI was $10.29. These are comparable to the ROIs in our study (between $7.65 and $9.19). However, we find that ROIs for DTC are much higher than even those that Neslin reports for large categories: $1.37 for large categories launched after 1996. This could reflect the antihistamine category's status as a poster child for DTC.
Similar conclusions can be drawn from a comparison of our results with those of Wittink (2002). Our detailing ROIs are consistent with those in Wittink's study (for the large brands introduced in 1998–2000), but the ROIs for DTC are much larger in our case. 20 This contrast underscores the importance of examining different submarkets of the industry and parsimoniously accounting for category-expansion, share-stealing, and carryover effects to grasp the revenue impact of promotional investments fully.
In addition, our long-term ROIs are higher than those reported in the work of Wittink (2002) for the smaller brands (i.e., less than $500 million in annual revenues) and for the larger brands that were launched before 1998.
It is useful to note three other studies that examine ROIs for advertising in nonpharmaceutical categories. Lambin (1970) studies a mature category of consumer durables in Europe and finds that ROI for advertising is $1.25 (i.e., the incremental $1 causes revenues to increase by $1.25). Horsky (1977) finds that the total incremental gross margins over the course of a year due to an incremental $1 spent on advertising are $1.77 without discounting, $1.60 with discounting, and $1.04 for the current period. Peles (1971) reports a current-period incremental gross margin of $.77 and a long-term incremental gross margin of $1.70 for every incremental $1 spent on advertising. Our results are similar to the ones in these studies in that an additional $1 spent on advertising raises revenues by more than $1.
Impact of Marketing-Mix Interactions on ROI
Because our focus is interaction effects, we assess the impact of all the significant interaction effects on ROIs for detailing and DTC. All interaction effects except that between price and DTC are significant at least at the 90% level. We assessed the impact of these interactions on ROIs by determining the effects of changes in price, OMEs, and DTC on detailing ROIs and those of detailing and OMEs on ROIs for DTC. For example, to study the impact of the interaction effect between detailing and price, we varied price by 5% to determine the effect that change has, for example, on detailing ROIs. We implemented the price variation by simulating the category sales and brand shares using the category and share models at 95% and 105%, respectively, of the actual price levels. Similarly, we analyzed the effect of DTC on detailing ROIs and price and detailing on ROIs for DTC. We report these results in Tables 8 and 9.
Effect of Price, DTC, and OMEs on Detailing ROI: Antihistamines
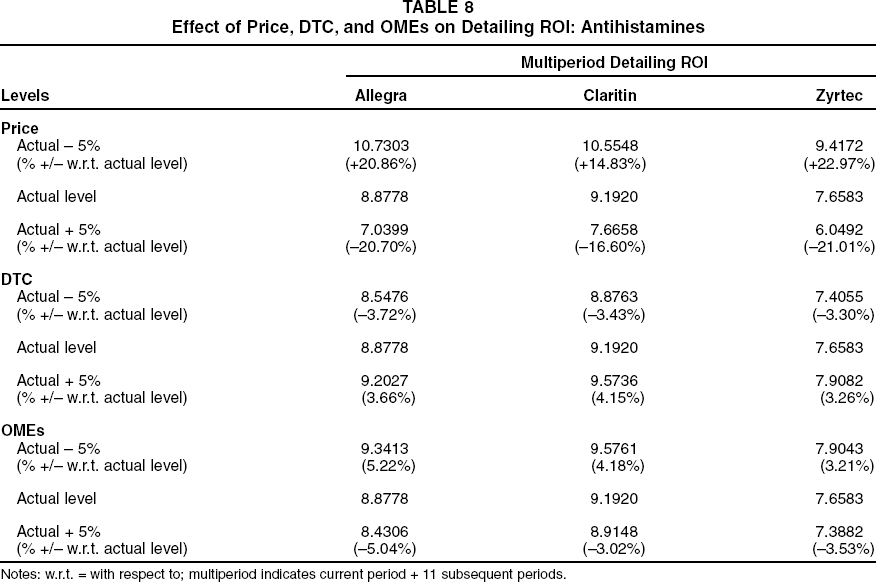
Notes: w.r.t. = with respect to; multiperiod indicates current period + 11 subsequent periods.
Effect of Detailing and OMEs on DTC ROI: Antihistamines

Notes: w.r.t. = with respect to; multiperiod indicates current period + 11 subsequent periods.
An examination of these results reveals that compared with the other variables, price has a much greater impact on detailing ROIs. A 5% increase in price decreases detailing ROIs by 16% to 21% for the three brands. Conversely, a 5% decrease in price increases detailing ROIs by 15% to 23%.
Detailing and DTC both have a positive effect on each other's ROI; that is, increased DTC causes detailing ROI to increase, and vice versa. Detailing ROI increases by 3% to 4% with a 5% increase in DTC, and it decreases by a similar amount when DTC decreases by 5%. The decrease in ROI for DTC is between 6% and 16% for a 5% decrease in detailing, and the ROI for DTC increases by 9% to 12% with a 5% increase in detailing.
A notable result is that detailing has a greater effect on ROIs for DTC than vice versa. This is because the interaction effect between detailing and DTC constitutes a greater component of the total DTC effect than of the total detailing effect (because the main effect of DTC is much less than the main effect of detailing). Thus, the interaction effect plays a bigger role for ROIs for DTC.
In addition, OMEs have a relatively small effect on detailing ROIs but a much greater effect on ROIs for DTC. A 5% increase in OMEs causes detailing ROIs to decrease by 3% to 5%. There is a similar percentage increase in detailing ROIs if OMEs decrease by 5%. However, ROIs for DTC decrease by 14% to 28% when OMEs increase by 5%. When OMEs decrease by 5%, ROIs for DTC increase by 12% to 23%. The different magnitudes of effects on ROIs for detailing and DTC reflect that the interaction effect is a much greater proportion of ROIs for DTC than for detailing.
In summary, note that price has a large, negative effect on detailing ROI, larger than effects due to OMEs. Next, detailing has a greater effect on ROIs for DTC than vice versa. Here, we have documented not only the synergy between detailing and DTC but also the asymmetrical effects on firms’ revenues. In addition, OMEs have a greater (negative) impact on ROIs for DTC than for detailing.
It is worthwhile to note that an interaction effect exists between DTC and detailing on brand sales simply because DTC has a significant effect on category volume and because detailing has a significant effect on brand shares. Thus, even in the absence of any explicit interaction effect in the brand-share model, we would still observe an implicit interaction effect. Higher DTC would increase category volumes; thus, detailing ROI would be affected even if the explicit interaction were to be shut off. To investigate this, we conducted a simulation in which we set the explicit interaction terms in the category and brand-share models to zero and computed the change in detailing ROIs for a 5% change in DTC. The results are reported in Table 10. Note that because there is no explicit interaction in the share model for this simulation, the absolute levels of these ROIs are different from those reported in Table 7. In particular, note the percentage changes in ROIs with 5% change in DTC: We find that a 5% increase in DTC causes detailing ROIs to increase by approximately .7% to 1.2%. A 5% decrease in DTC causes detailing ROI to increase by 1% to 3.5%. This is a notable result because it demonstrates a unique synergistic effect in pharmaceutical categories: DTC drives category volume by leading patients to talk to their physicians, and detailing then steals share by inducing physicians to prescribe the focal drug.
Effect of DTC on Detailing ROIs: Antihistamines

Notes: Effects pertain to category sales only; that is, the interaction effect in the share model is turned off. w.r.t. = with respect to.
Impact of Marketing-Mix Interactions on Price Elasticities
We have discussed the implications of the interaction effect between price and the marketing variables on ROIs. However, the two significant interaction effects between price on the one hand and detailing or OME on the other hand also have implications for price elasticities. We begin this discussion by recalling the debate in the literature on advertising's effect on price elasticities (see Kaul and Wittink [1996], who report empirical evidence for both positive and negative effects of advertising on price elasticities). We explore these interactions using an approach similar to the one used for analyzing the interaction effects on ROIs. We vary detailing and OMEs for the focal brand by 5% and record the change in the price elasticities. These results are reported in Table 11.
Effect of Detailing and OMEs on Price Elasticity: Antihistamines

Notes: w.r.t. = with respect to.
We find that greater detailing increases price elasticities. A 5% increase in detailing increases price elasticities by 1.5% to 2%. A 5% decrease in detailing similarly decreases price elasticities by approximately 1.5% to 2%. The interaction effect between OMEs and price has the opposite sign of that between detailing and price. Thus, an increase in OMEs causes price elasticity to decrease. For example, if OMEs increase by 5%, price elasticities decrease by approximately 1.5% to 2.5%. There is a similar increase of 1.5% to 2.5% in price elasticities when OMEs decrease by 5%. These results can have important implications for firms’ pricing policies (see, e.g., “Managerial Implications” herein).
Results from the Antivirals Category
The results we have reported are for the antihistamine category. Although there are likely to be differences between categories in returns on promotional activities, it would be useful to determine whether our key results on ROI are specific to the category under study or whether the results can be applied more generally. Of specific concern is that the antihistamine category has an extremely high level of DTC among all therapeutic categories. Therefore, we conducted an identical analysis for the antivirals category in which DTC expenditures are nonzero but still are much smaller than those in the antihistamine category.
Although genital herpes is an incurable disease, it can be controlled and its symptoms mitigated through the use of specific antiviral drugs. The first drug to be introduced in this category was Glaxo Wellcome's Zovirax (generic: acyclovir), which is available both in tablet and topical (cream) forms (Glaxo Wellcome subsequently merged with Smith-Kline Beecham to form GlaxoSmithKline). SmithKline Beecham launched Famvir (generic: famciclovir) in July 1994 but sold it to Novartis in 2000 when Smithkline merged with Glaxo (to meet Federal Trade Commission requirements). The merged entity GlaxoSmithKline launched another drug in the category, Valtrex (generic: valacyclovir), in September 1995. In April 1997, Zovirax went off patent, and generic substitutes became available.
The highest-share brand in the category is currently Valtrex. Before its introduction, Zovirax was the market leader. Valtrex is the only brand that had significant DTC levels, whereas Famvir and Zovirax had almost none. The expenditure on detailing was relatively steady, and all brands have invested in detailing.
Our data set for the category consists of a monthly time series that extends over 11 years of sales, prices, and promotional expenditures for all brands in the category. We set Zovirax topical as the base brand for the brand-share model because, unlike the antihistamine category, there is no all-other brand in the antiviral case.
We report the detailing elasticities for the antiviral category in Table 12. (Valtex is the only brand in the category that invested in DTC activity, and its current-period DTC elasticity is .1777.) All the elasticities have the expected signs, and their magnitudes are comparable to those for the antihistamine category. Furthermore, we report the ROIs for detailing and DTC in Table 13. The current-period detailing ROI is greater than one for all three brands in the category, which suggests that the marginal dollar spent on detailing returns more than one dollar in marginal revenues for all three brands in the category. The ROI for DTC is only reported for Valtrex, because it is the only brand in the category that invested in DTC. For Valtrex, the ROI for DTC is less than one, which suggests that the marginal dollar spent on DTC for the brand returns less than one dollar in marginal revenue in the current period. Although the magnitudes of the ROIs vary from those for antihistamines, the nature of results we obtained is nevertheless similar to the nature of results in the antihistamine category.
Current-Period Elasticities: Antivirals

ROI Measures: Antivirals
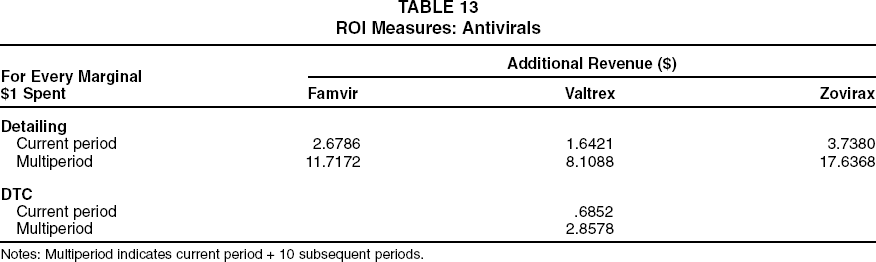
Notes: Multiperiod indicates current period + 10 subsequent periods.
The multiperiod ROIs for detailing and DTC are also reported in Table 12. The nature of these multiperiod ROIs for detailing and for DTC is similar to that for antihistamines. Specifically, we find that the detailing and DTC ROIs are both greater than one in the long run. Although we were unable to conduct an analysis of the full set of interactions between pairs of marketing-mix elements, as we did in the antihistamine category, the interaction effects are consistent with those for that category. For example, detailing has a similar effect on price elasticity as it does in the case of antihistamines. A 5% reduction in detailing causes price elasticities to decrease by 1.34% for Famvir, .91% for Valtrex, and 2.07% for Zovirax. A 5% increase in detailing similarly causes price elasticities to increase by 1.31%, .9%, and 2.01%, respectively. Thus, greater detailing leads to higher elasticities and thus lower prices.
Managerial Implications
This article's purpose has been to explore the interactions between pairs of marketing-mix elements and how the interactions affect ROI. Accordingly, our econometric analysis identified several statistically significant interactions and estimated the impact of the interactions on ROI. Although we have reported and discussed our results, here we reiterate the four results that we deem the central takeaways of the analysis.
First, our analysis finds that the interaction between price and detailing is negative. Because a higher price adversely affects demand, the negative interaction implies that at higher levels of detailing, the demand is even more sensitive to higher prices. A manager who employs higher detailing levels faces a downward pressure on prices. We believe that this finding counters the often-repeated tenet, “marketing tends to raise prices by (artificially) differentiating the products.” Contrary to such expectations, detailing efforts seem to reduce differentiation. However, it must be noted that there are many other factors that drive managers’ pricing decisions, such as firms’ objectives for recovering research and development costs, health maintenance organizations’ formulary decisions, and other intermediaries’ policies. Thus, pricing policy may not always reflect the interaction effect that we have identified.
Second, a brand's expenditures on detailing and DTC can affect sales in two ways: by affecting product category sales and by affecting the brand's share of category sales. Our analysis reveals that whereas DTC has a significant effect on category sales, detailing does not. In contrast, both detailing and DTC affect brand shares, and we find that detailing has a much greater effect than DTC. The implication is that when managers want to drive up category volume, perhaps in the early stages of a product's life cycle, they should consider allocating a substantial portion of the marketing budget to DTC. In contrast, in the more mature phases of the drug life cycle (but before the entry of generics), it seems beneficial for them to use a mix of detailing and DTC, with a greater emphasis on detailing.
Third, when making resource allocation decisions, it is important for managers to consider synergies among the various marketing investments. In this context, two of our findings are particularly relevant: (1) the positive interaction between DTC and detailing and (2) the negative interaction between OMEs and either DTC or detailing. Industry observers often question the value of pharmaceutical manufacturers’ increased DTC spending, particularly when studies such as those of Neslin (2001) and Wittink (2002) show relatively poor returns on DTC. However, the positive interaction that we identified implies that higher levels of DTC may indeed make detailing more effective. These two expenditures work hand-in-hand, and managers can generate an effect that is greater than the sum of its parts by using these marketing-mix elements simultaneously. Next, the negative interaction between OMEs and detailing (or DTC) implies that managers approach OME resource allocation more carefully. It appears that OME spending jams the value of the other marketing-mix elements. In this case, managers are well advised to limit the overlap between OMEs and either DTC or detailing, perhaps by targeting different segments (or groups) of physicians with OMEs or by separating OMEs and DTC (or detailing) temporally.
Fourth, our analysis developed both short- and long-term ROI benchmarks for specific subcategories of pharmaceuticals. Recall that unlike our study, which focuses on one category of pharmaceuticals at a time, both Neslin (2001) and Wittink (2002) approach ROI estimates by aggregating various (categories of) drugs. However, the commonality among the studies (including ours) is that the ROI for DTC is less than that for detailing; although the exact numerical values vary from study to study, the pattern seems to be fairly robust. We also provide explicit long-term ROI estimates and find that long-term ROIs are approximately four to seven times single-period ROIs. We note that an increase in detailing has a greater impact on ROIs for DTC than vice versa. Finally, although there are individual differences between the antihistamine and antiviral categories, our results for both categories suggest that detailing ROIs are higher than DTC ROIs.
The main implication is that whereas the ROI estimates developed for a given product-market may or may not apply to other categories, it is relevant for managers to identify and understand the underlying drivers of ROI. In this article, we endeavored to highlight the role of interactions in some detail. Research that explores other drivers of financial performance of marketing variables is certainly warranted.
Conclusion
We opened this article with the objective of addressing two issues: (1) the empirical characterization of the interactions between pairs of marketing-mix elements and (2) the development of benchmarks for the impact of promotional expenditures (with a particular focus on detailing and DTC expenditures) on both short- and long-term ROIs.
Using monthly observations from April 1993 to March 2002, we examined market shares, prices, and promotional expenditures of three brands (Claritin, Zyrtec, and Allegra) in a subcategory of pharmaceuticals. We focused on this particular category because of the high expenditures on DTC and because generic products have not yet appeared in the market for second-generation antihistamines. To provide a robustness check, we repeated our analysis on a second category: antivirals to treat genital herpes.
Our findings reveal that detailing primarily affects the brand share positively; in contrast, DTC has a significant, positive effect on both brand share and category sales. Detailing ROIs are greater than DTC ROIs. Furthermore, there is a synergy between the effects of the two promotional variables on brand share. We find that changes in detailing have a greater impact on DTC ROI than vice versa (i.e., changes in DTC have a smaller impact on detailing ROI). In addition, we find significant interaction effects between price and promotional expenditures, and we quantify the impact of these interactions on detailing and DTC ROIs. Next, long-term ROIs are several times greater than single-period ROIs; for example, for DTC, they are approximately five times greater.
A feature of DTC is that it is less “targeted” than detailing; that is, whereas the detailing activity ensures that the target physician is appropriately informed, DTC does not have the power to ensure a 100% reach to target (potential) patients. Consequently, it may not be surprising that DTC ROI is less than that of detailing. However, what is more surprising is the industry's increasing expenditures on DTC despite the relatively poor short-term returns. Our analysis suggests that a positive interaction between DTC and detailing may be a reason for increased expenditures; however, other potential reasons for the expenditures are worth exploring.
Therefore, further research should explore alternative paths by which DTC affects sales and should consider measuring the impact of different media used in DTC. Further research will also help characterize the extent of strategic interactions (i.e., levels of competition and cooperation) among brands. These issues underscore the importance of investigating firms’ optimal budget allocation problems. Overall, our analysis provides a valuable benchmark for further research, and as our brief discussion suggests, much work remains to be done in this important area of marketing.