
Abstract
In this article, the authors examine consumers’ behavior with respect to expiration dates for grocery store perishable products. A better understanding of such behavior can both guide efforts to educate consumers about the risks associated with perishables that are approaching their expiration dates and help managers implement effective promotional strategies for these products throughout the course of their shelf lives. Both of these approaches can help reduce waste due to spoilage.
The importance of perishables for store profitability and store image has been supported by several market facts. First, in 1999, sales of perishable goods rose 4.5% and accounted for 69.4% (approximately $305 billion) of all retail food sales and just more than 50% of all supermarket retail sales (Supermarket Business 2000). Second, produce represents 12.7% of total store sales and is the second most profitable category behind frozen foods (Berner 1999). Third, meat and produce tend to be the departments on which consumers base their value judgments about stores (Kerin, Jain, and Howard 1992). These trends may explain why grocery stores advertise 19 varieties of peppers and stock more than 400 produce items (Turcsik 2003).
Despite their importance, perishable products are difficult to manage because of their random weights, lack of specific Universal Product Codes for different product variations, and different forms of sale (e.g., raw, semiprepared, fully prepared), to name just a few issues. Perishables are so complex that many retailers are unable to implement any type of category management strategies for them (Litwak 1997). However, according to the Blattberg, Chaney & Associates consulting firm, “the key to successful category management (of perishables) is to understand how the consumer makes category decisions” (Litwak 1997, p. 166). Such understanding could lead to actions that benefit grocery store managers, consumers, and society as a whole.
A better understanding of consumers of perishable goods would enable managers to implement discounting policies that reduce shrinkage (waste due to spoilage), a major problem in perishable categories. Departments such as produce, bakery, and meat lose approximately 4.5% of their goods to spoilage (compared with 2% overall), which can cost a grocery store $70,000–$340,000 a year, depending on the size of the store (Supermarket News 1997). Furthermore, a grocery store may be able to increase its profits by as much as 15% by minimally reducing the shrinkage of perishable goods (Hennessy 1998). Discounting aging perishables may be an effective way to accomplish this goal, especially in light of evidence that the short- and long-run effectiveness of price promotions is greater for perishable goods than for other categories (Nijs, Dekimpe, and Steenkamp 2001). In addition, discounting perishables would benefit consumers by enabling them to make tradeoffs between buying a more expensive but fresher item and buying one that is discounted but may be perceived as riskier because of its approaching expiration date (though it is still safe to consume). This policy could also build trust between consumers and managers who avoid selling products that are close to their expiration dates at full price. In the end, discounting perishables would benefit society as a whole by reducing the unnecessary waste that spoilage causes each year. Despite these benefits, however, it seems difficult and perhaps imprudent to implement such discounting strategies without a better understanding of consumers’ awareness and interpretation of expiration dates, as well as the way that consumers’ willingness to pay (WTP) for a perishable varies throughout the course of the product's shelf life.
A better understanding of consumer behavior with regard to perishable categories could also aid efforts to educate consumers about food dating (the dates found on product packaging). Currently, there is ambiguity about the usage and regulations of what consumers often refer to as “expiration dates.” Except for infant formula and baby food, the Food and Drug Administration does not require manufacturers to date their products, nor does it have federal regulations governing dating (Tufts University Health & Nutrition Letter 1997). Therefore, food dating is a voluntary process typically provided in one of three forms: (1) “Best before,” which indicates the date after which a product is no longer of its “best” quality, generally is used for products such as baked goods, cereals, snacks, and some canned foods; (2) “use by,” which indicates the date after which a product is no longer of sufficient quality and should not be consumed, is used for products such as eggs, yeast, and refrigerated dough; and (3) “sell by,” which indicates the last day a product should be sold (though most remain safe to eat up to seven days past this date or longer if stored in a freezer), is most commonly used with meat, seafood, poultry, milk, and bread. Because of the different forms of product dating, misconceptions among consumers about their meaning is common. 1
We identified consumers’ misconceptions of how grocery store perishables age during their shelf lives in a pilot study in which the majority of consumers (61%) perceived that “sell by” dates represent the last day on which the product should be consumed rather than sold. Furthermore, a large proportion of consumers (42%–82%, depending on the category) reported the misconception that the quality of a perishable deteriorates continuously from the time it is put on the shelf. The results are available from the authors.
However, the problem is not limited to expiration dates; 2 it applies to food labels in general. A recent Food Standard Agency survey (Whitworth 2001) reports that more than one-quarter of all consumers find labels difficult to understand, and one-third do not know the significance of “use by” or “best before” dates. Although approximately 60% of consumers claim that they check food labels and expiration dates on food packages, only one-third of them know what to do with food when it is one day past its “use by” date (Whitworth 2001). As the findings show, research is necessary to understand consumers’ awareness and interpretation of expiration dates to implement programs that could change misconceptions about and behavior with respect to product dating.
We use the term “expiration date” to denote “sell by,” “best before,” and “use by” dates.
Despite this evidence, perishable products have received little or no attention in the marketing literature (Krider and Weinberg 2000). In response, our main objectives are to examine (1) consumers’ awareness of expiration dates, (2) their WTP for a perishable throughout the course of its shelf life, and (3) the role that risk plays in the choices consumers make when buying perishable goods. 3 Whereas studies have investigated the influence of perceived risks on brand preference (Dunn, Murphy, and Skelly 1986), product classification (Murphy and Enis 1986), product liking (Cardello 2003), and attitudes toward pesticide use on produce (Huang 1993), our research is the first to investigate the impact of perceived risks and expiration dates on consumer behavior in grocery store perishable categories.
We thank two anonymous reviewers for suggesting perceived risk as an important driver of behavior in perishable goods categories.
We develop a set of hypotheses that we test empirically through a survey of consumers’ perceptions and behaviors with respect to the following important perishable categories: chicken, beef, milk, yogurt, lettuce, and carrots. We use products from the meat and poultry, fresh produce, and dairy categories because of the large percentage of all grocery store perishable sales in these categories: 30.4%, 22.5%, and 16.9%, respectively (Supermarket Business 2000). We chose two products from each perishable category to obtain insights into behavior both across products and within product types. Our findings support many of the hypotheses, and we use the findings to make recommendations to managers of grocery store perishable goods and to develop a research agenda for further studies in these under-researched but important categories.
Literature Review
To date, much of the research on perishable goods has come from the operations research literature and has focused on optimizing pricing, ordering, and restocking strategies for aging goods, most of which do not appear in grocery stores (e.g., fashion goods, broadcast spots). In Table 1, we present a subset of these studies and summarize the problems investigated, the characteristics of the categories studied, and the main findings.
Summary of Selected Research on Perishable Goods from the Operational Research Literature

Although these studies address some issues relevant to managers of perishable goods, such as pricing, restocking, and ordering policies, the characteristics of the products studied differ from consumable grocery store perishables, which makes the findings from these studies impractical for managing such products. For example, a grocery store perishable has a relatively short shelf life, typically one to three weeks. Therefore, a manager's ability to update information throughout the life of the product, as is done in many of the operations research studies, is limited. In addition, the quality of grocery store perishables decreases until they eventually spoil and can no longer be sold, unlike fashion goods, for which the utility of the product, though it may decay over time, never reaches zero, or broadcast spots, for which the value of the good may actually increase over time if the expected number of viewers increases before the sale of the broadcast spot (e.g., when two teams from big, metropolitan cities advance to the Super Bowl). Because grocery store perishables spoil, managers must understand consumers’ WTP across the shelf life of these products to be able to sell them before they go bad. However, the most important distinction between our research and that of the operations research literature is that most of the studies in Table 1 make assumptions about consumer effects in their models. In contrast, we explicitly study consumers’ perceptions and behavior in grocery perishable categories through a survey study.
The few studies that have considered grocery store perishable goods and goods with similar characteristics have modeled optimal inventory policies (Giri and Chaudhuri 1998; Hariga 1997; Khouja 1996), pricing policies (Gold 1981; Rajan and Steinberg 1992), ordering and issuing (restocking) policies (Fujiwara, Soewandi, and Sedarage 1997), and the impact on store choice (Krider and Weinberg 2000). Although the management of goods such as fresh meat, poultry, and dairy depends on many of the factors captured in these studies (e.g., seasonality, inventory, buy-back deals), an understanding of consumers’ awareness of, perceptions of, and behavior with respect to expiration dates is missing. A study that is similar in spirit to ours is Huang's (1993), which addresses the effect of risk perceptions of pesticide use on consumers’ WTP for residue-free produce. However, that study does not include expiration dates, and it focuses solely on perishables that use pesticides; in contrast, we focus on a broader range of grocery perishables that includes meat, poultry, dairy products, and produce.
Our study is also different from those mentioned previously in that we explicitly focus on consumers’ perceptions and behaviors in specific, important grocery store perishable goods categories. Therefore, our study represents the only work to explicitly investigate consumers’ awareness of expiration dates, their WTP for a perishable as it ages, and the influence of perceived risk on such behaviors.
Hypotheses Development
During the past 15 years, perishable food scares—such as salmonella in eggs, milk, and poultry; listeria in pate and certain soft cheeses; and bovine spongiform encephalopathy (more commonly known as mad cow disease) in meat— have caused health concerns among consumers and have brought about significant changes in their purchasing habits (Mitchell 1998). For example, the retail volume sales of beef and veal dropped 63% in 1996 after a public announcement linked bovine spongiform encephalopathy to Creutzfeldt-Jakob disease, a fatal brain disease in humans, and in 1989, retail sales of eggs dropped 21% after an outbreak of salmonella (Yeung and Morris 2001). Furthermore, these scares have caused investors to devalue stocks of companies that sell related products (e.g., McDonald's, Jack in the Box, Outback Steakhouse) by up to 5% (Shell 2003). The main factor driving the behavior of consumers and investors in these situations is the perceived risk associated with purchasing and consuming an unhealthy perishable good.
Perceived risk, defined as the expected negative utility associated with the purchase of a particular brand or product (Dunn, Murphy, and Skelly 1986), influences consumers not only for categories affected by highly publicized food scares but also for everyday, common purchase decisions. As a result, consumers take actions to lower the perceived risk associated with a purchase by (1) shifting or postponing their purchase, (2) purchasing well-known brands, (3) seeking advice or endorsement from a trusted source (Yeung and Morris 2001), or (4) in the case of perishable goods, searching for visual and other cues of freshness, such as expiration dates in the case of perishable goods.
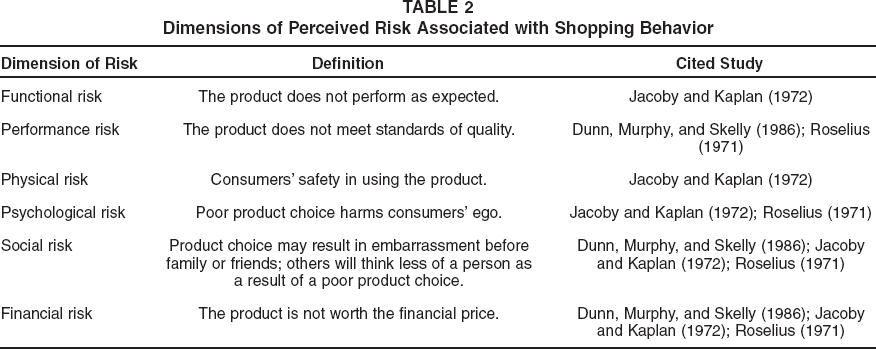
The types of perceived risks that influence consumer decision making include functional, performance, physical, psychological, social, and financial (Greenleaf and Lehmann 1995; Havlena and DeSarbo 1990; Jacoby and Kaplan 1972; Roselius 1971) (for definitions of these types, see Table 2). The influence of the different types of risk on shopping behavior varies depending on the brands considered or the categories of interest. For example, Dunn, Murphy, and Skelly (1986) study the influence of perceived risk on preferences for generic, store, and national packaged-goods brands and find that social risk plays a minor role compared with financial and performance risks. Alternatively, Murphy and Enis (1986) classify product categories on the basis of consumers’ shopping effort and price risk dimensions. They report that convenience goods, which include produce and other grocery staples, tend to rank lower than preference, shopping, and specialty goods in terms of the effect of effort and risk on behavior. However, recent evidence demonstrating the importance of perishables for store choice and shopping experience and the flood of recently publicized food scares involving perishable goods may lead to different results than those found approximately 20 years ago.
Dimensions of Perceived Risk Associated with Shopping Behavior
Frequency of Checking Expiration Dates
Prior studies have shown that as the risks associated with a product increase, so does consumers’ desire for information before they make a purchase (Blackwell, Miniard, and Engel 2001; Dowling and Staelin 1994; Greenleaf and Lehmann 1995). In an attempt to reduce the risks, consumers may search for product attributes and information before making a purchase. Because a relevant piece of information for a perishable good is its expiration date, we propose the following:
Consumers who perceive high levels of risk associated with a perishable product check its expiration date more frequently than do consumers who perceive low levels of risk (positive main effect).
In Table 2, we define the risks included in our study. As we mentioned previously, no theory exists in the literature about the relative importance of these risks in any context, let alone in the context of perishable grocery store goods. However, we expect that functional, performance, and physical risks dominate the other risks (psychological, social, and financial) because of their relationship with product quality and the highly publicized and important health risks associated with many of the products in our study.
Consumer research recognizes familiarity and expertise as characteristics that influence consumers during the various stages of their decision-making process (Bettman and Park 1980). Consumers with greater category experience are better able to search out, encode, and recall information than are those with less experience (Alba and Hutchinson 1987; Johnson and Russo 1984; Maheswaran and Sternthal 1990). Because expiration dates provide valuable information about a product's remaining shelf life, we expect that consumers with greater category experience are better able and more likely to search out expiration dates. Furthermore, as their category experience increases, the impact of uncertainty and risks associated with a perishable should decrease because consumers rely more on the expertise that they have accumulated in the category. Therefore, we expect that consumers’ increased category experience dampens the impact of perceived risks on the frequency of checking expiration dates. Alba and Hutchinson (1987, p. 411) define familiarity and expertise as “the number of product related experiences accumulated by the customer.” Therefore, we use household consumption rate as a proxy for category experience and propose the following:
Consumers from households with high consumption rates of a perishable product check its expiration date more frequently than do consumers from households with low consumption rates (positive main effect).
The effect of perceived risk on how frequently consumers check expiration dates is smaller for consumers from households with high consumption rates than for those from households with low consumption rates (negative interaction effect).
Consumers can take measures to stop or extend the aging process of most perishables, such as freezing, cooking, or using the product immediately. In such situations, the information that the expiration date provides is of less value to consumers because the product is less likely to spoil. Therefore, such consumers may be less likely to seek out expiration information. Similarly, stopping the aging process should reduce the impact of the risks associated with spoiling, and the effect of perceived risks on the frequency of checking expiration dates should be dampened. Thus:
Consumers who plan to stop the aging process of a perishable product check its expiration date less frequently (negative main effect).
The effect of perceived risk on how frequently consumers check expiration dates is smaller for consumers who plan to stop the aging process of a perishable product (negative interaction effect).
WTP for a Perishable Throughout the Course of Its Shelf Life
When consumers buy a perishable, they must consider the likelihood that the product will spoil. As the likelihood of spoilage increases, the value of the product, and thus consumers’ WTP for it, should decrease. Because the number of days before the product reaches its expiration date is a measure of the likelihood of spoilage, we expect that as the product approaches its expiration date and the number of days decreases, WTP for the product decreases.
Consumers have a higher WTP for perishable products that have more days before their expiration date (positive main effect).
The inverse relationship between perceived risk and WTP has been documented for products that use pesticides (Eom 1994; Huang 1993). In addition, when the risks of failure are high, consumers will trade some risk by reducing the resources that they allocate to acquire the product (Huang 1993; Yeung and Morris 2001). Therefore, we propose that as the perceived risks associated with a perishable increase, consumers’ WTP decreases in exchange for accepting a greater risk.
Consumers with higher perceptions of risk for a perishable product have a lower WTP (negative main effect).
However, risks may be consumer specific. For example, perishables consumed by households with higher consumption rates are less likely to spoil, and therefore their value to such consumers is greater than it is to households with lower consumption rates, especially as the product approaches its expiration date. As a result, household consumption rate should have a direct and positive impact on WTP, both overall and with respect to how WTP decreases as the expiration date approaches. Furthermore, as the household consumption rate increases, the negative impact of risk perceptions on WTP should decrease because the risk of spoilage is reduced. Thus, we propose the following:
Consumers from households with higher consumption rates have a higher WTP (positive main effect).
The effect of the number of days before the expiration date on consumers’ WTP is smaller for consumers from households with high consumption rates than for those from households with low consumption rates (positive interaction effect whereby WTP decreases at a slower rate as the number of days decreases).
The effect of perceived risk on consumers’ WTP is smaller (less negative) for households with high consumption rates than for those with low consumption rates (positive interaction effect whereby the negative effect of risk is dampened).
Finally, in cases in which consumers plan to stop the aging process of a perishable, because the product is less likely to spoil, its value to consumers should be greater. Thus, stopping the aging process should have a direct and positive impact on WTP, both overall and with respect to how WTP decreases as the expiration date approaches. Furthermore, stopping the aging process should lower the impact of the perceived risks associated with the perishable on WTP.
Consumers who plan to stop the aging process of a perishable product have a higher WTP (positive main effect).
The effect of the number of days before the expiration date on consumers’ WTP is smaller for consumers who plan to stop the aging process of a perishable product (positive interaction effect whereby their WTP decreases at a slower rate as the number of days decreases).
The effect of perceived risk on consumers’ WTP is smaller (less negative) for consumers who plan to stop the aging process of a perishable product (positive interaction effect whereby their WTP decreases at a slower rate).
In Table 3, we summarize these hypotheses and the variables we use to test them.
Summary of Hypotheses, Variable Definitions, and Variable Measurement

”How often do you check for an expiration date when buying each of the following products?” 1 = “never,” 5 = “always.”
”What is the most you would be willing to pay for product j if it were due to expire in (7, 4, or 1) days?” (divided by shelf price).
ln the interest of space, we use “risk” here to represent an interaction with all risk variables. When estimating the model, we included a separate term to capture the interaction of HHConsume and Stop with all risk variables in the model.
Empirical Research
We conducted a survey to test our hypotheses with regard to consumer behavior in six perishable categories with printed expiration dates on their packaging: prewashed/precut lettuce, prewashed/precut carrots, milk, yogurt, chicken, and beef. A convenience sample of 300 consumers participated in our study, for which the only screening criterion was that the respondent did a substantial amount of grocery shopping for his or her household. Participants came from two large metropolitan areas in the Midwest and Southeast United States. To assess consumers’ WTP throughout the course of the products’ shelf life, we distributed three versions of the survey in which we inquired about participants’ WTP for a perishable with seven (85 surveys), four (93 surveys), or one (92 surveys) day(s) remaining before it reached its expiration date. After we cleaned the data of missing observations, there were 270 usable surveys. We report summary statistics about consumers’ perceptions of the products in Table 4.
Summary Statistics About the Product Categories Investigated

A majority of consumers (69%–84%, depending on the product category) believed that the quality of perishables deteriorates throughout the course of their shelf life, though retailers maintain that the quality remains relatively constant until the product passes its expiration date. This finding suggests an opportunity for retailers to smooth demand throughout the course of the products’ shelf life by educating consumers about the actual risks of purchasing a product close to its expiration date and about the way perishables age over time. However, because such efforts might be received with skepticism, it would be in retailers’ best interests to obtain the support of the Center for Food Safety and Applied Nutrition, which distributes printed materials that describe food labels; to encourage cookbook authors and food editors to emphasize food safety; and to disseminate public service announcements by all media (Hunter 1994). However, until such coordination occurs, discounting products as they approach their expiration dates may be the most viable strategy.
Model Specification
We conducted an exploratory factor analysis of the six risk dimensions to determine if they could be reduced to fewer constructs. We used a principal components analysis with Varimax rotation to obtain the factor loadings (oblique rotation gave similar results). In all six categories, a two-factor solution, in which both factors had eigenvalues greater than 1 and the remaining factors were less than 1, provided the best fit. We report the results of this analysis in Table 5.
Factor Loadings

For all six products, functional, performance, and physical risks load more heavily onto the factor that we label “product quality risk” (PQR), and psychological, social, and financial risks load more heavily onto the factor we label “personal risk” (PR). The PQR factor captures the perceived risks associated with product quality as a perishable approaches its expiration date and the associated health risks, and the PR factor captures risks associated with the negative emotions a consumer experiences when a product fails, such as the impressions others form about the consumer, the way the consumer feels about him- or herself, and the frustration of a financial loss. Using the results from Table 5, we recast the data to create PQR and PR. Although both models (two- and six-factor risk) provide similar results, for parsimony we use the two-factor model to capture the perceived risks associated with perishables. We also include a set of consumer characteristics in an exploratory effort to assess their influence on the frequency of checking expiration dates and consumers’ WTP. We used the following estimated equations to test our hypotheses:


Mean with standard deviation is in parentheses.
Percentage of respondents who planned to stop the aging process of the product on arriving home; they were male, were older than age 45, had a yearly income greater than $50,000, and worked full time.
Because respondents answered questions across all six categories, these figures do not differ across products.
We thank an anonymous reviewer for this suggestion.
Results
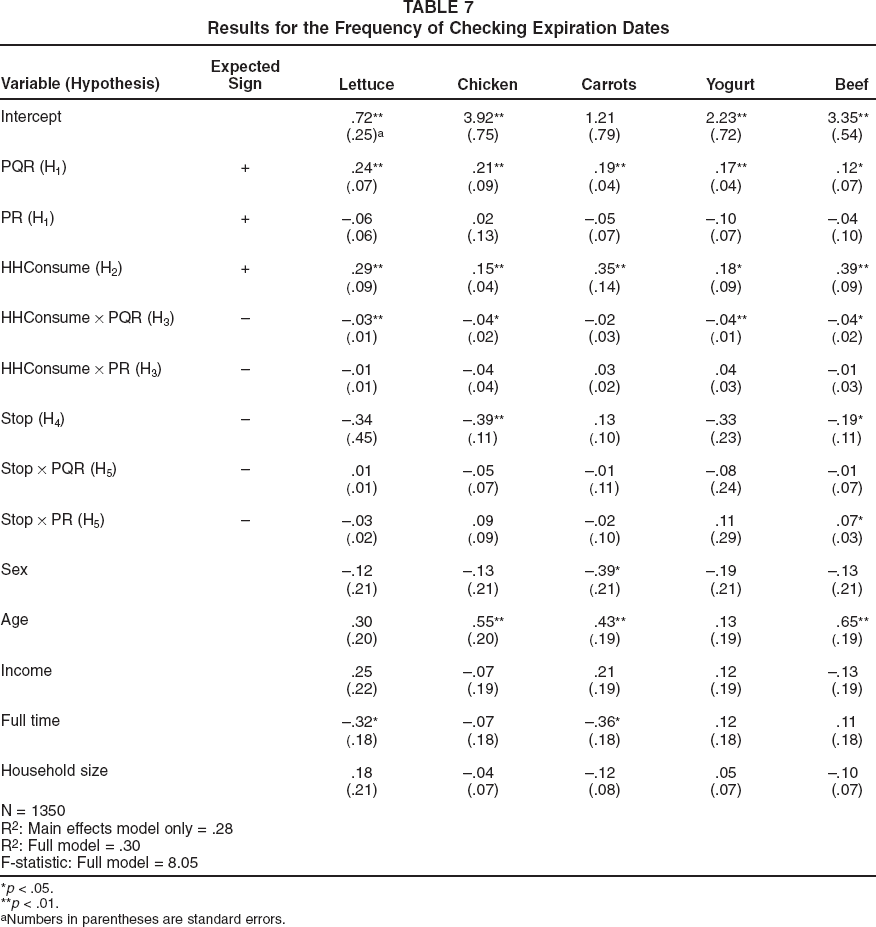
To test H1–H5, we estimated Equation 1 using the PROC MIXED procedure in SAS. This procedure allows for repeated measures within consumers, which was a characteristic of our data, given that participants answered similar questions across categories. We omitted the data from the milk category because of a lack of variance in the dependent variable (93% of consumers “always” or “usually” check expiration dates in this category; see Table 4). We provide the results in Table 7.
Results for the Frequency of Checking Expiration Dates
p < .05.
p < .01.
Numbers in parentheses are standard errors.
We find support for H1; the greater the risks associated with a product, the more frequently consumers check expiration dates. However, this finding holds true only for PQR in all five categories but not for PR. Therefore, PQR, or the perceived risks associated with the quality of a perishable that is approaching its expiration date and the resultant health risks, are the most salient types of risks and are positively correlated with the frequency with which consumers check expiration dates. However, a higher level of PR is not associated with a greater frequency of checking expiration dates. This finding suggests that marketers should encourage consumers to check expiration dates in categories in which PQR is low and in which consumers therefore do not frequently check expiration dates, thus enabling consumers to make more informed decisions.
We also find strong support for H2. 5 In all five categories, we find that consumers with greater category experience, as indicated by their household consumption rate, are more likely to check expiration dates. We also find that when PQR perceptions are high, the impact of the household consumption rate on the frequency of checking expiration dates is minimized, in support of H3. However, the same cannot be said for PR in terms of its support for H3.
We find additional support for this hypothesis through an observation study and personal interviews with consumers, which revealed that those who shop infrequently in a category rarely, if ever, check expiration dates, and many do not even know that expiration dates exist in those categories.
We do not find convincing evidence to support H4 or H5; thus, stopping the aging process does not appear to affect the frequency with which consumers check expiration dates. This might be because the act of stopping the aging process is usually situational, whereas the habit of checking expiration dates is an act that spans multiple shopping trips. In addition, the decision to stop the aging process may depend on the consumer's knowledge of the number of days before the product expires, something that is obviously unknown prior to the consumer's checking the expiration date.
Finally, when we consider the demographic variables, we find that older consumers are more likely to check the expiration dates of chicken, carrots, and beef, whereas consumers who do not work full time are more likely to check lettuce and carrots. We could generalize from these findings that consumers with more free time are more likely to check expiration dates, and therefore marketers should focus on consumers with less free time (e.g., younger consumers, those working full time) to ensure that they are aware of expiration dates and are making informed decisions. However, because of the lack of strong consistency in the findings across the five categories, more research is necessary before we can make conclusions of this nature.
To test H6–H13, we estimated Equation 2 (WTP), again using the PROC MIXED procedure in SAS, and we present the results in Table 8. The results support H6 in all six categories. Furthermore, we note that WTP decreases linearly for produce and dairy and exponentially for beef and chicken as the number of days left before the product's expiration decreases. 6 In Figure 1, we graph the decline in WTP for all six categories as the products go from seven days to one day before their expiration dates, holding all other variables constant. The way that WTP decreases throughout the course of the product's shelf life provides information about consumers’ perceptions of how product quality deteriorates over time and the likelihood of the product spoiling at various points. In turn, this information provides insights into how discounts can help retailers sell products as they approach their expiration dates.

WTP as a Percentage of List Price Throughout the Course of a Perishable's Shelf Life
Results for WTP for a Perishable

p < .05.
p < .01.
Numbers in parentheses are standard errors.
The best-fitting model for chicken and beef operationalizes Days as e(days).
These functional forms were supported in other similar studies that we conducted for this research, which are available on request.
The different functional forms for chicken and beef suggest that a deeper discount is necessary earlier in their shelf lives to encourage a purchase. In the stores of the managers we interviewed, chicken and beef are the only perishable products discounted when they approach their expiration dates. This trend may explain the different functional forms for these categories; namely, consumers become conditioned to expect a discount when discounting is already practiced. In addition, chicken and beef are statistically the most risky of the six categories in terms of PQR. 7 Therefore, another possible explanation for the exponential relationship between WTP and days before expiration for beef and chicken is that products with high PQR require a multiplicative rather than additive discount to entice a purchase. However, more research on this topic is necessary to make such a conclusion decisively.
We base this finding on an analysis of variance that tests for statistical differences in PQR and PR across the six product categories. The results are available from the authors.
On the basis of the trends in Figure 1, we also note that WTP (as a percentage of the list price) for products with one day left before expiration is the lowest for milk, perhaps because milk is the only product for which the aging process is difficult to stop (e.g., milk cannot be cooked, except perhaps in a recipe, or frozen). Therefore, the only means of stopping the aging process is by consuming the gallon of milk immediately, a task that takes more than a day for an average household. Therefore, with only one day before expiration, milk's value should be low, as is reflected by the low WTP.
As with H1, we find support for H7 with respect to PQR (in all categories but yogurt) but not PR. As consumers’ PQR perceptions increase, their WTP for the product decreases. However, this relationship does not hold for risks related to social and financial forces. It is not surprising that PR is not significant, because the products we study are not “status” goods, nor do they require a substantial financial investment. Therefore, for products for which PQR is high, such as beef and chicken, managers should consider greater discounts to compensate for the greater risks associated with these products if they want to sell aging inventory. Other products with high PQR that we do not study herein might include fish or lunch meats. Alternatively, discounting may not be as crucial for perishables for which PQR is lower.
Next, there is no consistent evidence that consumers with higher household consumption rates are willing to pay more for a fresh product, regardless of the number of days remaining before the product reaches its expiration date (H8). However, we find support for H9 because as the product approaches its expiration date, WTP decreases at a faster rate for households with lower consumption rates in every category but chicken. In all categories except lettuce, the negative effect of PQR on WTP is dampened for house-holds with higher consumption rates, in support of H10 for PQR. However, the same does not hold true for PR. Thus, consumers with higher consumption rates are willing to pay more for a product as it approaches its expiration date than are those with lower household consumption rates. This trend presents an opportunity for managers to target discounts at households with lower consumption rates, and therefore WTP, to sell perishables nearing their expiration dates.
We also find that though stopping the aging process does not affect overall WTP for a fresh perishable, regardless of the number of days remaining before expiration (H11), consumers who plan to stop the aging process are willing to pay more for a perishable as it approaches its expiration date than are those who do not plan to do so (H12). The results strongly support H12 in all categories except milk, whose aging process, as we noted previously, largely cannot be stopped. In all categories except lettuce, the negative impact of PQR on WTP is moderated for consumers who plan to stop the aging process, in support of H13 for PQR. However, again, the same does not hold true for PR. According to these findings, managers should encourage consumers to stop the aging process of a perishable immediately, especially in categories with high PQR. Some encouragements might include communicating the importance of freezing a product (at the point of purchase or otherwise), providing recipe ideas for the appropriate quantity of the perishable as it is packaged and sold, and selling smaller packages of perishables so that the entire product may be consumed or used in a recipe on the day it is purchased.
Finally, from the demographic variables, we find supporting evidence that older consumers and larger households are willing to pay more for perishables, if all else is equal. For example, it is not surprising that larger households have a higher WTP if we assume that they are able to consume the same amount of perishable goods more quickly than are smaller households. In turn, their risk of not being able to consume the product before it expires is lower, and their value of and WTP for the perishable is higher.
Conclusions and Further Research
We investigate consumers’ behavior in six important grocery store perishable categories with printed expiration dates: yogurt, milk, precut lettuce, precut carrots, beef, and chicken. We focus on three main aspects of decision making in these categories: (1) the frequency with which consumers check expiration dates, (2) their WTP for a perishable product throughout the course of its shelf life, and (3) the perceived risks associated with perishables as they approach their expiration dates. We develop a set of hypotheses that predict the relationship among these three aspects of behavior in perishable categories and the variables that moderate them, and we test the hypotheses using a survey study. We present a summary of our results in Table 9.
Main Findings and Implication
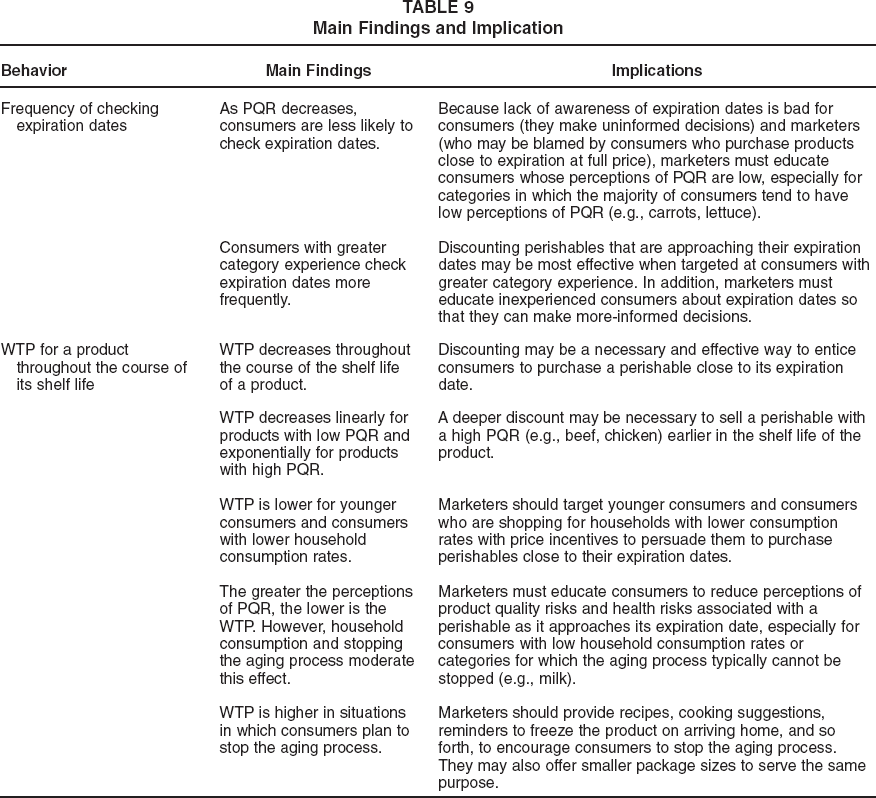
When investigating the frequency with which consumers check expiration dates, we find that increases in PQR—a factor that captures functional, performance, and physical risks—have a positive impact on the frequency with which consumers check expiration dates. However, this effect does not hold for the PR factor, which captures psychological, social, and financial risks. We also find that consumers with greater category experience, as measured by household consumption rate, check expiration dates more frequently.
Discounts may be necessary to sell aging inventory to consumers who are aware of expiration dates, and our findings suggest that such promotions should be targeted at experienced consumers, those with higher perceptions of PQR, and those who shop in categories in which there is a greater tendency to check expiration dates, such as beef and chicken. For example, experienced shoppers could be identified by means of scanner data, which reveal those who shop more frequently in a category, and the technology necessary to target these consumers with price promotions is on the horizon. As Keenan (2003, p. 63) notes, “with new gadgets such as electronic shelves and digital price labels coming down the pike, retailers may eventually be able to change prices in the blink of an eye—and send electronic messages to shoppers’ carts for custom-made deals.”
However, marketers also must pay special attention to educating consumers who infrequently check expiration dates (e.g., inexperienced consumers, consumers with low PQR, younger or full-time employed customers) about the existence and importance of such dates, especially in categories for which PQR is low for most consumers, such as carrots and lettuce. This effort would help avoid the potential ill will that is created in cases in which uninformed consumers unintentionally buy a perishable good close to its expiration date only to get it home and place blame on the store when it spoils sooner than they expected. In addition, marketers can minimize confusion by educating consumers about the different meanings of expiration dates or by adopting a more uniform classification method to date foods.
With respect to WTP, we find support for the hypothesis that WTP decreases throughout the course of the product's shelf life, which suggests the need to educate consumers that product quality, and thus the value of the perishable, does not decline as the product approaches its expiration date. To be credible, this education would need support from third-party sources, such as the Center for Food Safety and Applied Nutrition (Hunter 1994). However, in the meantime, discounting may be an effective way to persuade consumers to purchase a perishable close to its expiration date.
We also find that WTP decreases linearly throughout the shelf life for lettuce, carrots, milk, and yogurt (products with relatively lower PQR) and exponentially for beef and chicken (products with relatively higher PQR). Therefore, a deeper discount earlier in the shelf life may be necessary to sell beef, chicken, and similar perishables. In addition, we find that WTP is lower for households with lower consumption rates, smaller households, and younger consumers. Therefore, discounting perishables that are approaching their expiration date will be most effective when it is targeted at these segments.
Finally, we find that WTP is greater when consumers plan to stop the aging process and that this effect is stronger the closer the product is to its expiration date. On the basis of this finding, we suggest that managers (1) remind consumers at the point of purchase of the importance of freezing a product, (2) provide recipe ideas for the appropriate quantity of the perishable as it is sold and locate common combinations of food items together (e.g., strawberries next to angel food cake) to encourage ideas for immediate consumption, or (3) sell smaller package sizes so the perishable can be consumed or used in a recipe on the day it is purchased.
In conclusion, we recognize that the decision of how to market grocery store perishables, including whether and how much to discount perishables as they approach their expiration date, requires a more in-depth analysis of the profit margins of each product and of the effects of discounting on store traffic, category volume, and cross-category effects. However, our results provide grocery store managers with some insights into the impact of discounting perishables on consumers’ behavior and perceptions. Furthermore, we show how perceived risk, a widely studied topic that has not been applied to perishable goods, can be used to understand and generalize behavior more effectively in these important categories. We hope that this research encourages others to examine consumer behavior in these profitable and important categories in an effort to aid managers in determining their product strategies.
Further research attempts might investigate the PQR dimension to determine whether our results for this important risk dimension are generalizable to other perishable categories. It also might be beneficial to conduct a field experiment to examine the impact of discounting perishables on purchase behavior. Such an effort would facilitate a more comprehensive analysis of consumers’ WTP for a perishable throughout the course of its shelf life and may answer questions such as when and by how much the product should be discounted. It would also be worthwhile to examine how the WTP function changes when a fresher, more expensive batch of goods is shelved alongside an older, discounted set of products.
Finally, a more in-depth study of the management of perishables and its effect on store image would be of interest. Our interviews with managers revealed that many stores discount beef and chicken but are reluctant to discount dairy or produce for fear that such actions will tarnish the store's image. However, our findings reveal that consumers do not perceive any differences among the products examined in our study in terms of the effect that discounting them has on store image (see Table 4). Furthermore, some products that managers traditionally do not discount (e.g., carrots, lettuce, yogurt) are less likely to affect store image negatively when discounted than are those that managers already discount (e.g., chicken, beef). Therefore, for each product category, managers should weigh the trade-offs between the potential benefits of discounting to sell inventory and its potential negative effects on store image. As recent research suggests, organizations can also publicize socially responsible programs to create a competitive advantage in the marketplace (Lichtenstein, Drumwright, and Braig 2004). By presenting their discounting as an alternative to throwing away the product, stores can promote a socially responsible image that may provide both short- and long-term benefits for the store.