
Abstract
Marketing executives are being urged to speak in the language of finance to gain internal support for marketing initiatives. Responding to this call, the authors examine the impact of a firm's advertising and its research and development (R&D) on the systematic risk of its stock, a key metric for publicly listed firms. They hypothesize that a firm's advertising and R&D expenditures create intangible assets that insulate it from stock market changes, lowering its systematic risk. They test the hypotheses using a panel data on 644 publicly listed firms between 1979 and 2001, consisting of five-year moving windows. They scale the firm's advertising and R&D expenditures by its sales. After controlling for factors that accounting and finance researchers have shown to be associated with systematic risk, the authors find that advertising/sales and R&D/sales lower a firm's systematic risk. The article's findings extend prior research that has focused primarily on the effect of marketing initiatives on performance metrics without consideration of systematic risk. For practice, the ability of advertising and R&D to reduce systematic risk highlights the multifaceted implications of advertising and research programs. The article's findings may surprise senior management, some of whom are skeptical of the financial accountability of advertising programs.
As we discuss subsequently, to eliminate potentially confounding effects of firm size on systematic risk, in the empirical estimation, we scale the firm's advertising and R&D by its sales.
Portfolio theory (Lintner 1965; Sharpe 1964), a key development in finance, posits that investors can diversify away a portion of the risk associated with a firm's stock by constructing a portfolio of stocks whose returns correlate imperfectly with one another. In equilibrium, the risk that is priced in the stock market is the stock's systematic risk, which is a function of the extent to which the stock's return changes when the overall market changes. 2 This market-driven variation in a firm's stock returns, which cannot be diversified away, is its systematic risk. By construction, the stock market, as a whole, has a β of 1.0. A stock whose return falls (or rises) more than the market's return falls (or rises) in response to a change in the market has a β greater than 1.0. If a stock's return falls (or rises) less than the market's return falls (or rises) in response to a change in the market, its β is less than 1.0. Thus, β, a measure of the stock's sensitivity to market changes, is an important metric for publicly listed firms.
Thus, β is measured as (covariance [stock and market])/(variance [market]).
In this article, we examine the relationship between a firm's advertising and R&D and its systematic risk. Recent developments in the market-based assets theory (Srivastava, Shervani, and Fahey 1998) suggest that a firm's advertising creates intangible market-based assets (e.g., brand equity) and that these assets strengthen performance—including sales growth, market share, and profitability (Boulding and Staelin 1995; Erickson and Jacobson 1992)—and shareholder value (Joshi and Hanssens 2004; Rao, Agarwal, and Dahloff 2004). We suggest that the consumer loyalty and the bargaining power over distribution channel partners inherent in these intangible market-based assets help insulate the firm from the impact of stock market downturns, thus lowering the firm's systematic risk. On the basis of developments in the finance literature, we propose another way that advertising-created market-based assets might affect a firm's systematic risk. Frieder and Subrahmanyam (2005, p. 57) note that because of increased firm awareness due to advertising, all else being equal, “investors prefer holding stocks with high recognition and consequently, greater information precision.” Grullon, Kanatas, and Weston (2004) find that a firm's advertising results in broader ownership of the stock. We anticipate that this broader ownership may insulate the stock's return from market downturns.
Consistent with these theoretical developments, two recent studies (Madden, Fehle, and Fournier 2006; Singh, Faircloth, and Nejadmalayeri 2005) have explored the relationship between a firm's advertising and its systematic risk. Singh, Faircloth, and Nejadmalayeri (2005) report a significant, negative relationship between a firm's advertising and its systematic risk. Using a sample of “best-performing firms” from the Stern–Stewart database for the period between 1998 and 2001, Singh, Faircloth, and Nejadmalayeri find that greater advertising expenditure (operationalized as advertising dollars) is associated with lower systematic risk. Madden, Fehle, and Fournier (2006) compare the performance of three stock portfolios—a portfolio of firms with strong brands (using Interbrand's measure of brand strength), a portfolio of firms excluding firms with strong brands, and a portfolio of all firms—and find that the portfolio of firms with strong brands had higher returns and lower systematic risk than the other two portfolios.
Singh, Faircloth, and Nejadmalayeri's (2005) and Madden, Fehle, and Fournier's (2006) studies raise intriguing research questions: Will the negative relationship between advertising (or brand strength) and systematic risk hold under other conditions, such as a more general sample that includes poorly performing firms, or with measures of advertising scaled for firm size (to remove the confounding effect of firm size)? Will the negative relationship between advertising and systematic risk hold when other accounting characteristics that have been shown to link to a firm's systematic risk, which may vary across portfolios, are controlled for (but were not controlled for in Madden, Fehle, and Fournier's study)? In addition, there is a research opportunity to incorporate unobserved firm heterogeneity (to rule out endogeneity caused by omitted variables) and to use lagged predictor variables (to rule out reverse causality), issues that have not been examined in prior research. There is also evidence in the literature that links a firm's R&D expenditure to its financial performance (Boulding and Staelin 1995; Capon, Farley, and Hoenig 1990; Erickson and Jacobson 1992) and shareholder value (Jaffe 1986). We hypothesize that as in the case of advertising, R&D creates intangible market-based assets that insulate the firm from the negative impact of stock market downturns, thus lowering the firm's systematic risk.
Accordingly, we examine the impact of a firm's advertising and R&D on its systematic risk, proposing that a firm's advertising and R&D lower its systematic risk. We test the hypotheses using data on publicly listed firms that we obtained from the COMPUSTAT and Center for Research on Stock Prices (CRSP) databases for the period between 1979 and 2001, which resulted in the creation of a panel data set of 19 five-year moving windows with 3198 observations for 644 firms. Following precedent in the finance literature (Damodaran 2001), we estimate the firm's systematic risk using 60 months of stock returns in a five-year moving window and equal-weighted stock market returns. To eliminate the potentially confounding effects of firm size on systematic risk, we scale the firm's advertising and R&D expenditures by its sales.
We control for the firm's growth, leverage, liquidity, asset size, earnings variability, and dividend payout, factors that finance and accounting scholars have shown to be associated with systematic risk. The model includes two additional control variables that may affect a firm's systematic risk: firm age and competitive intensity in the industry. We estimate the effect of a firm's advertising/sales and R&D/sales on its systematic risk using a fixed-effects model formulation that accounts for unobserved firm heterogeneity and serial correlation of errors.
The results strongly support the hypotheses that higher advertising/sales and higher R&D/sales lower a firm's systematic risk, after we control for factors that prior research has shown to be associated with systematic risk. These two effects are robust to alternative estimates of systematic risk (we estimate β using value-weighted, as opposed to equal-weighted, market returns and relax the restriction that all 60 months of stock returns must be present to estimate β) and to alternative measures of advertising and R&D (we scale them by assets rather than by sales), and the results are not driven by multicollinearity. Our findings are novel and important and hold implications for both marketing theory and practice.
We organize the article as follows: In the next section, we provide a brief overview of systematic risk. We develop hypotheses that relate a firm's advertising and R&D to its systematic risk. We then describe the proposed estimation approach, the data, the measures, and the results. We conclude with a discussion of the study's contributions, its limitations, and opportunities for further research.
An Overview of Systematic Risk
A central issue in portfolio theory in finance is the maximization of returns for people who invest in assets, that is, in firms’ stocks (Lintner 1965; Mossin 1966; Sharpe 1964). The key idea of portfolio theory is that investors can construct a portfolio of stocks with imperfectly correlated returns and thus eliminate nonsystematic (i.e., individualistic) risk associated with those stocks. The remaining variability, the firm's systematic risk, reflects the extent to which its stock's return responds to movement of the average return on all stocks in the market.
In 1970, Beaver, Kettler, and Scholes (hereinafter, BKS) related systematic risk to variables that describe the financial position of a firm. Specifically, they suggested that greater systematic risk is related to the following:
Higher growth because, in a competitive economy, the excessive earnings opportunities may erode when new firms enter the industry;
Greater leverage because the earnings stream of common shareholders becomes more volatile as debt increases;
Lower liquidity because liquid or current assets result in less volatile returns than do fixed assets;
Smaller asset size because smaller firms have greater default risk;
Lower dividend payout because the need to offer steady dividends causes firms with greater volatility to pay out a lower percentage of earnings;
Higher levels of earnings variability because this results in a lower payout to stockholders; and
Higher earnings covariability with the market because this results in higher earnings volatility, again lowering the return on the stocks.
Considering two periods (1947–1956 and 1957–1965), BKS (1970) (1) regressed the aforementioned firm characteristics on systematic risk in the first period and (2) examined whether a model of systematic risk from the first period predicted systematic risk in second period better than did systematic risk in first period.
Two diverse streams of empirical research have emerged from BKS's (1970) study. The first stream of research, which is not related to the current study's objectives, focuses on the prediction of the firm's systematic risk in a future period (Elgers 1980; Eskew 1979; Ismail and Kim 1989). The second stream of research, which is more pertinent to the current study, augments the predictor variables in BKS's study with additional firm characteristics that may explain systematic risk. Although there are several studies in this stream, our review indicates a lack of cumulative knowledge building in this area. Rather, each study adds some new variables to a subset of the variables in BKS's study. Variables considered in prior research include dividend policy (Bildersee 1975), financial structure (Hill and Stone 1980), operating leverage (Mandelker and Rhee 1984), earnings funds flow and cash flow (Ismail and Kim 1989), international diversification (Goldberg and Heflin 1995), and strategic profiles (Veliyath and Ferris 1997).
Similarly, two studies (Bharadwaj and Menon 1993; Kroll, Wright, and Heiens 1999) explore the relationship between aspects of a firm's marketing strategy and its risk. Using service strategic business units from the Profit Impact of Marketing Strategy database, Bharadwaj and Menon (1993) find that some aspects of marketing (e.g., promotional expenditure, sales force expenditure, relative price) are associated with lower variability in return on investment, whereas other aspects of marketing (e.g., advertising, customization) are associated with higher variability in return on investment. Although variability in return on investment, a surrogate for total risk, confounds systematic risk with nonsystematic risk, these results suggest a relationship between firms’ marketing activities and their systematic risk. Kroll, Wright, and Heiens (1999) consider a surrogate for systematic risk, the covariance of firms’ cash flows relative to a market portfolio of equities, and they find that the superior product quality of strategic business units (again, using the Profit Impact of Marketing Strategy database) decreases the surrogate measure of risk. As we noted previously, Singh, Faircloth, and Nejadmalayeri (2005) and Madden, Fehle, and Fournier (2006) find that higher levels of advertising expenditure are associated with lower systematic risk.
Note that there is a vigorous, ongoing debate about the usefulness of systematic risk for predicting future firm value in the finance literature (Fama and French 1992). 3 However, our focus is on β as a measure of risk, not on β as a predictor of future firm value. To reiterate its central role in investment practice, systematic risk is an important metric for publicly listed firms that measure their stocks’ vulnerability to market downturns. Indeed, as testimony of its importance, a review of current investment practices indicates that leading investment firms (e.g., Fidelity, Merrill Lynch, and Value Line) use β extensively in the construction of investment portfolios. Thus, shareholders and senior management of publicly traded firms are interested in β and, consequently, in the impact of advertising and R&D on β.
Using historical data, Fama and French (1992) examine whether expected returns are better predicted by the firm's previous βs than by other variables. Using realized average returns, they find a stronger empirical correlation of future firm value with a firm's book-to-price and size but not with the measure of its historic βs.
In summary, although there is much work that relates a firm's accounting characteristics (e.g., dividend payout, growth, leverage, liquidity, asset size, earnings variability) to its systematic risk, much less is known about the relationship between important indicators of marketing strategy (e.g., advertising, R&D expenditures) and systematic risk. Singh, Faircloth, and Nejadmalayeri (2005) and Madden, Fehle, and Fournier (2006) provide two exceptions. To address this research gap, we examine the effects of a firm's advertising and R&D, two important manifestations of the firm's marketing strategy, on its systematic risk.
Theory
We now develop hypotheses that relate a firm's advertising and R&D to its systematic risk. To eliminate the potentially confounding effects of firm size on systematic risk, in the empirical estimation, we scale the firm's advertising and R&D by its sales. We first discuss the effects of the firm's advertising on its systematic risk and then discuss the effects of R&D on systematic risk.
Advertising
A large body of work indicates that advertising has a direct effect on various firm performance metrics, including sales (Leone 1995), profit (Erickson and Jacobson 1992), and firm value (Joshi and Hanssens 2004). Reinforcing these performance rewards to advertising, developments in brand equity (Aaker 1996; Keller 1998) suggest that firms’ advertising efforts create consumer and distributor brand equity, an intangible market-based asset with important strategic and performance implications. For example, increased advertising and the resultant brand equity increase the differentiation of a firm's products (Kirmani and Zeithaml 1993) and make them less easily substitutable (Mela, Gupta, and Lehmann 1997). Increased brand equity also increases price premiums (Ailawadi, Neslin, and Lehmann 2003) and lowers price sensitivities (Kaul and Wittink 1995; Sethuraman and Tellis 1991). Furthermore, increased advertising and the resultant higher brand equity produce an asymmetric sales response to sales promotions (Blattberg, Briesch, and Fox 1995), such that highly advertised brands are affected less (than less advertised brands) by competitors’ sales promotions.
In addition to the benefits of advertising and brand equity in current product markets, advertising and the resultant brand equity also strengthen and stabilize the firm's performance in new product markets. For example, the brand equity of current flagship brands generates greater receptiveness of consumers and distribution channel partners to new product introductions (Kaufman, Jayachandran, and Rose 2006) and enables the firm to migrate customers to more profitable products and/or to cross-sell products to existing customers (Kamakura et al. 2003). Thus, as Srivastava, Shervani, and Fahey (1998) suggest, brand equity can function as financial hedging contracts when firms enter new markets with new technologies. In addition, brand equity also creates both consumer and distributor loyalty, acts as a barrier to competition, and provides bargaining power over distributors; these are all benefits that insulate a firm's stock from market downturns and thus lower its systematic risk (Veliyath and Ferris 1997).
Finally, a firm's brand equity may lower its systematic risk by serving as a capital market information channel to the firm's stockholders (Frieder and Subrahmanyam 2005; Grullon, Kanatas, and Weston 2004). Grullon, Kanatas, and Weston (2004) report that firms with higher advertising have higher liquidity and greater breadth of stock ownership. Frieder and Subrahmanyam (2005) report that a firm's increased brand perceptions (consistent with higher brand equity, as we discussed previously), a direct outcome of its increased advertising, increases ownership of the firm's stock by individual investors (relative to institutional investors) because of individual investors’ preferences for stocks with higher-quality information (advertising plays an information role for a firm's stockholders). This higher liquidity and increased breadth of ownership may help insulate the firm's stock returns from market downturns, thus lowering its systematic risk. Thus:
The higher a firm's advertising, the lower is its systematic risk.
R&D
There is a large body of finance, management, and marketing research that relates the intangible assets created by R&D to the firm's financial performance. Although there is a debate about the sizes of the effects of R&D investments on different performance metrics (Boulding and Staelin 1995; Erickson and Jacobson 1992), it is well established that firms’ R&D investments generate persistent profits (Roberts 2001), high stock returns (Chan, Lakonishok, and Sougiannis 2001; Mizik and Jacobson 2003; Pakes 1985), and superior market value (Jaffe 1986). In a meta-analysis of 210 profitability studies, Capon, Farley, and Hoenig (1990, p. 1157) conclude, “Dollars spent on R&D have an especially strong relationship to increased profitability.”
As with advertising-created market-based assets, R&D-created market-based assets may also insulate a firm's stock from market downturns. Veliyath and Ferris (1997) report a relationship between the strategic profile of a firm, including its advertising- and R&D-driven differentiation, and its systematic risk. Similarly, the number of a firm's new product introductions lowers its systematic risk (Chaney, Devinney, and Winer 1991). This relationship between R&D and systematic risk occurs because a firm that invests in R&D exhibits greater dynamic efficiency and greater flexibility than its competitors (which invest less in R&D), enabling it to adapt to environmental changes, including in input prices, technologies, and customers (Miller and Bromiley 1990). This efficiency and flexibility help insulate the firm from market downturns, thus lowering its systematic risk.
We focus on the effects of a firm's R&D, an activity with uncertain returns, on its systematic risk. If the focus is on total risk (nonsystematic risk and systematic risk), R&D may increase total risk because R&D may decrease the predictability of a firm's future income streams (Kothari, Laguerre, and Leone 2002). Analysts exhibit greater disagreement about year-ahead earnings for R&D-intensive firms than for other firms (Barth, Kasznik, and McNichols 2001). Another study notes that postinvestment reported earnings are more highly variable for firms with higher R&D levels than for firms with lower R&D levels (Chambers, Jennings, and Thompson 2002). To the extent that these kinds of volatility are specific to a firm or an industry, they are nonsystematic and can be diversified away (Lubatkin and O'Neill 1987).
In summary, although extant empirical research suggests that R&D can increase a firm's nonsystematic risk, this literature also suggests that R&D creates strategic differentiation, efficiency, and flexibility, which insulate the firm from market downturns, thus lowering its systematic risk. Thus:
The higher a firm's R&D, the lower is its systematic risk.
Method
Data
The data for this study included all firms listed on the New York Stock Exchange (NYSE) during the period between 1979 and 2001. We obtained accounting, financial, advertising, and R&D data on firms from COMPUSTAT, and we obtained their stock prices for the computation of systematic risk from CRSP.
Measures
The dependent variable, systematic risk, is an inherently long-term construct that captures the extent to which a firm's stock return covaries with market return (BKS 1970). A firm's systematic risk changes slowly over time. We followed the precedent in prior finance research (Damodaran 2001) and estimated the firm's systematic risk using a five-year moving window; we accomplished this by using stock returns for the previous 60 months, relative to the equal-weighted return for the stock market for that period. We subsequently tested the robustness of the results to β estimates relative to the value-weighted returns and for β estimates when monthly stock returns were available for at least 50 of the 60 months of the moving window (which enables us to increase the number of firms in the data set). In addition, to avoid problems associated with low-priced stocks, we excluded a stock from the five-year moving window if the average of its monthly closing stock prices was less than $2 (Ball, Kothari, and Shanken 1995; Hertzel et al. 2002). Finally, we included a firm in the moving window only if it reported information on its advertising and R&D in COMPUSTAT for all years in the five-year moving window.
Systematic Risk
Similar to BKS's (1970) approach, we use monthly stock data to compute firm i's systematic risk measure βi(hat), ex post, for a period by using a least squares regression of the form:

where Rit = Ln(Dit + Pit)/P′it − 1 and Rmt = Ln(Lt/Lt − 1), where Rit is the ex post rate of return for stock i during period t; Rmt is an index of the ex post return for all NYSE firms during month t (i.e., the market rate of return); αi is the intercept of the fitted line of Rit using Rmt; Dit is the cash dividend payable on common stock i in month t; Pit is the closing price of common stock i at the end of month t; P′it − 1 is the closing price at the end of month t − 1 adjusted for capital changes (e.g., stock splits, stock dividends); and Lt and Lt − 1 are the Fisher's link relative, a market price index of all firms on the NYSE at months t and t − 1, respectively, adjusted for dividends and all capital changes. The slope of the regression equation βi(hat) is the empirical estimate of systematic risk βi of firm i.
We obtained βi(hat) by estimating a separate regression using the monthly stock returns for each firm i for each five-year moving window, resulting in up to 19 observations per firm. For the first moving window, we used the monthly stock returns for all firms on CRSP for 1979, 1980, 1981, 1982, and 1983 to compute the firm's systematic risk. For the second moving window, we used the monthly stock returns for firms for 1980, 1981, 1982, 1983, and 1984. For the final moving window, we used the monthly stock returns for all firms for 1997, 1998, 1999, 2000, and 2001. To ease interpretation of the results, we eliminated 52 observations in which the firm's estimated systematic risk was negative.
Advertising and R&D
We measured advertising by the mean of the firm's advertising expenditure, as reported in DATA45 and scaled by its sales reported in DATA12, for the five-year period from the annual data reported in COMPUSTAT. DATA45 in COMPUSTAT includes the cost of advertising media (radio, television, newspapers, and periodicals) and promotional expenses. 4 We measured R&D by the mean of the firm's R&D expenditure, as reported in DATA46 and scaled by its sales reported in DATA12, for the five-year period from the annual data reported in COMPUSTAT. Scaling the firm's advertising and R&D expenditures by its sales rules out the alternative explanation that the negative effect of advertising and R&D on systematic risk may be due to larger firms having lower systematic risk. We subsequently test the model and report that estimation results are robust to scaling of the advertising and R&D by the firm's assets (DATA6) instead of its sales.
Prior research has shown that sales promotion activities negatively affect brand loyalty (Mela, Gupta, and Lehmann 1997) and have a nil effect on stock returns (Pauwels et al. 2004). We are aware that some firms may report sales promotion expenditure as a part of their advertising expenditure. However, because firms do not indicate the split between advertising and sales promotions, we assume that most advertising expenditures reported in DATA45 in COMPUSTAT are related to communication of product benefits to customers. Thus, differences in the percentage of such misreported advertising expenditure that pertains to sales promotion add error to our estimates, making our tests of hypotheses conservative.
Given the theoretical processes discussed in the hypotheses development, we anticipate a lagged effect of a firm's advertising and R&D on its systematic risk. Thus, we used lagged measures of advertising/sales and R&D/sales, which preclude a potential reverse-causality explanation of the effects (Boulding and Staelin 1995).
Accounting Variables
Given this study's objective of exploring the effects of a firm's advertising and R&D on its systematic risk, as accounting researchers have done, we use accounting variables that BKS (1970) use as control variables in our model. Accordingly, we included six accounting characteristics of the firm in the model: asset growth rate, leverage, liquidity, asset size (log), earnings variability, and dividend payout (for the logic for the operationalization of these variables, see BKS 1970, p. 666). The inclusion of the firm's asset size serves as a further control for the effects of the firm's size on its systematic risk. We are unable to include covariability of earnings, which BKS include in their model, because its calculation requires ten years of data. We provide the definitions of these measures and the data fields from COMPUSTAT used for BKS's computation in the Appendix.
Additional Control Variables
We also included two additional control variables in the model. First, we included the firm's age, which we measured by the number of years since its listing on the stock market, because older firms may have lower systematic risk. Second, to control for industry-specific effects, following the suggestion of an anonymous reviewer, we included the industry's competitive intensity, which we measured with Herfindahl's four-firm concentration ratio as the proportion of market shares of the largest four firms to the industry's sales at the two-digit Standard Industrial Classification level. A priori, we do not hypothesize the directional effect of competitive intensity. The fixed-effects formulation we employ to estimate the model precludes the inclusion of time-invariant industry dummies in the model.
A total of 3198 observations (for 644 firms) had complete data on systematic risk, lagged advertising/sales, lagged R&D/sales, and the control variables. The number of firms in the sample by each moving window suggests that, over time, the number of firms in each moving window increases at first, reaches a maximum (N = 371 in Window 10 [years = 1989–1993]), and then declines to 162 in the last moving window (years = 1997–2001). This drop in the number of firms in the moving windows over time occurred because of missing data for advertising and R&D. The average value for systematic risk for all firms in a given window varies across the years, ranging from .856 (Window 14) to 1.140 (Window 18), whereas average asset size (log) ranges from $6.243 million (Window 14) to $4.951 million (Window 6). Lagged advertising/sales and lagged R&D/sales vary as follows: for average lagged advertising, highest = .055 in Window 15 to lowest = .033 in Window 1; for average lagged R&D, highest = .088 in Window 15 to lowest = .036 in Window 1. Of the observations, 3% reported zero advertising expenditure, and 3.9% reported zero R&D expenditure. Table 1 contains the descriptive statistics and correlation matrix of the measures, and Figure 1 contains the frequency distribution of asset size (log) and systematic risk of observations in the study.

Frequency Distribution
Descriptive Statistics and Bivariate Correlation Matrix for Variables in Proposed Model
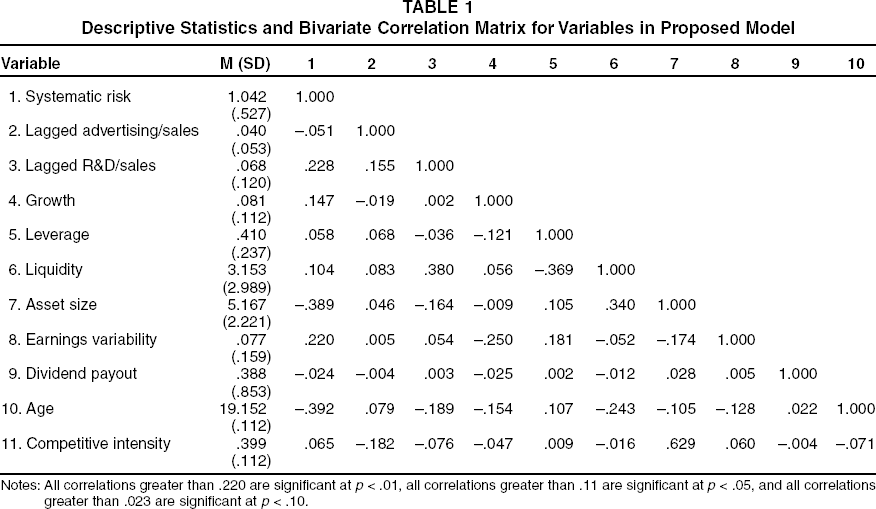
Notes: All correlations greater than .220 are significant at p < .01, all correlations greater than .11 are significant at p < .05, and all correlations greater than .023 are significant at p < .10.
A perusal of Table 1 and Table 2 (which we discuss in detail subsequently) suggests that the pattern of bivariate correlation matrix in Table 1 is different from the pattern of regression results in Table 2. For example, the model estimation results in Table 2 indicate that advertising/sales and R&D/sales have coefficients that are negative and significant at p < .01. However, in the bivariate correlation matrix in Table 1, the correlation between R&D/sales and β is positive and significant at p < .01, and the correlation between advertising/sales and β is negative and significant only at p < .10. This “disconnect” occurs because the bivariate correlation matrix does not account for the fixed effects, serial correlation, or window dummies in our model structure. To explore this issue further, we created an “adjusted” bivariate correlation matrix, in which we removed the effects of fixed effects, serial correlation, and window dummies from the predictor variables by regressing fixed effects, serial correlation, and window dummies on each of the predictor variables and systematic risk. We used the residuals from each of these regressions to create an adjusted correlation matrix (this and all other results that we do not report herein are available on request). The pattern of correlations in the adjusted correlation matrix corresponds closely to the regression results in Table 2. 5 Thus, multicollinearity does not appear to be driving the results of the model estimation.
We also performed stepwise regression analyses, adding one predictor variable at a time to the model, and found consistent results for the effects of lagged advertising and lagged R&D (the directionality, significance, and the sizes of the coefficients) across these stepwise regressions, showing that there are no harmful effects of multicollinearity.
Advertising, R&D, and Systematic Risk: Estimation Results

p < .10.
p < .05.
p < .01.
We used factor-scored predictor variables for this model.
Notes: Coefficient (standard errors) are in the columns. The models also include window dummies, some of which are significant at p < .01.
Results
Model Estimation Procedure
Because the panel data set of moving windows consists of repeated observations of firms, we estimated a fixed-effects, cross-sectional, time-series regression model with a correction for serial correlation of errors (Baltagi and Wu 1999; Bhargava, Franzini, and Narendranathan 1982; Woolridge 2002). Specifically, the model has the following structure:

where ∊it = ρ∊it − 1 + ηit (|ρ| < 1, and ηit is independent and identically distributed [i.i.d.] with mean 0 and variance σ2h) and νi are assumed to be fixed parameters that may be correlated with the covariates Xit. The Xit include the accounting variables of growth, leverage, liquidity, asset size, earnings variability, dividend payout, age, competitive intensity, and advertising and R&D. The failure to correct for serial correlation of errors, if it is present, can result in inflated standard errors of parameter estimates and incorrect tests of hypotheses (for the detailed statistics of the fixed-effects panel data model with correction for first-order serial correlation of errors, see Bhargava, Franzini, and Narendranathan 1982). 6
The most frequently analyzed process in the empirical econometrics literature is the first-order autoregression, or AR(1), process in which the errors across time t and t – 1 are correlated. Higher-order processes involving several periods are both intractable and place a high burden on the researchers to justify more complex time-series processes. Thus, as Greene (2003, p. 257) notes, “the first-order autoregression has withstood the test of time and experimentation as a reasonable model for underlying processes that probably, in truth, are impenetrably complex.”
We estimated the model using the “xtregar” procedure in STATA 9.0. In addition to the predictor variables of lagged advertising/sales and lagged R&D/sales, we also included BKS's (1970) control variables and the two additional control variables of age and competitive intensity. As discussed previously, we used lagged measures of advertising/sales and R&D/sales. Because this structure precludes a potential reverse-causality explanation, we can explore a causal relationship between advertising/sales and systematic risk and between R&D/sales and systematic risk (Boulding and Staelin 1995). We included dummies for each moving window to account for any differences across windows.
We checked for first-order serial correlation in errors, as Woolridge (2002) proposes. This test rejected the hypothesis that there is no first-order serial correlation (p < .01), in support of the inclusion of an autoregressive (AR1) disturbance term. We report the results of the estimation of the proposed model in Column 1 of Table 2.
The proposed model is statistically significant (F(671, 2527) = 17.90, p < .01), and the R-square (within) for the proposed model is .161. The rejection of the hypothesis of null fixed effects (F-value is significant at p < .01) reinforces the need for fixed-effects correction. The estimated autocorrelation coefficient, ρ, is large at .668, and the Durbin–Watson statistic (Baltagi and Wu 1999) is not significant (t = 1.200, n.s.), reconfirming the need to adjust for serial correlation in errors.
We first compare the coefficients of the accounting variables in this study with BKS's (1970) results. We note that BKS report significant effects for dividend payout (b = –.58, p < .01), growth (b = .84, p < .05), and earnings variability (b = 3.03, p < .01). In our results, significant coefficients indicated that growth (b = .359, p < .01) and leverage (b = .515, p < .01) are positively associated with a firm's systematic risk, whereas asset size (b = –.091, p < .01) is negatively associated with systematic risk. Given the changes in stock market regimes over time and the refinements in the estimation procedure we use herein (i.e., we use a panel data model, incorporating fixed effects and serial correlation in errors), the differences in this study's coefficients relative to those that BKS report are not surprising. 7 We infer that differences among our findings, those in BKS's study, and those of BKS's model approach with the 1980–1999 data (see n. 6) arise because of differences (1) in stock market regimes across the years that result from changes in the range of predictor variables and (2) in the econometric estimation procedure between our study and BKS's study—we incorporate information on the panel data structure in the estimation, whereas BKS do not.
We also estimated the model that BKS (1970) estimate for the 20 years in this study by constructing two data sets—one for the period 1980–1989 and one for the period 1990–1999—by averaging the various accounting variables for the 10 years following the procedure in BKS's article. The results of the ordinary least squares regression for the model with accounting variables were significant in both 10-year periods: Period 1: F(6, 338) = 22.501, p < .01; Period 2: F(6, 231) = 17.742, p < .01. The R-squares are as follows: Period 1 = .285, and Period 2 = .315). The following accounting variables were significant: for Period 1, growth (+ and p < .01), leverage (+ and p < .05), earnings variability (+ and p < .01), and asset size (– and p < .01); for Period 2, growth (+ and p < .10), leverage (+ and p < .05), earnings variability (+ and p < .01), and asset size (– and p < .01). From these results, we can observe the impact of methodology. With BKS's data and methodology, growth, earnings variability, and dividend payout were significantly associated with β, but asset size and leverage were not associated with β. In terms of why BKS did not identify asset size and leverage as predictors of β, recall that BKS eliminated leverage and asset size in a stepwise regression of data averaged over 10 years. We conjecture that panel-structure-adjusted correlations may have shown that leverage and asset size were (as they are now) good predictors of systematic risk. The raw correlation structure in our panel data is consistent with this conjecture. In the panel data set, correlations of liquidity with both asset size (ρ = .34) and leverage (ρ = –.37) are high. In summary, we suggest that the difference between our results and BKS's results are, in large part, driven by our up-to-date econometric estimation approach. After correcting for methodology, the remaining differences in our findings might be due to change in the marketplace, or they might be because BKS's use of stepwise regression artificially eliminated leverage and asset size that our proposed model (with its panel structure) identifies as important predictors of β.
With respect to the other control variables, the firm's age (b = –.022, p < .01) and competitive intensity (b = –.885, p < .01) are significantly associated with lower systematic risk. The accounting variables of liquidity (b = .001, n.s.), earnings variability (b = –.018, n.s.), and dividend payout (b = .000, n.s.) are not related to systematic risk.
We next discuss the two hypothesized effects. The results indicate that as H1 and H2 predicted, respectively, higher lagged advertising/sales (b = −3.187, p < .01) and higher lagged R&D/sales (b = –.501, p < .01) lower the firm's systematic risk. Following an anonymous reviewer's suggestion, we reestimated the proposed model, including the square of lagged advertising/sales and the square of lagged R&D/sales, to explore nonlinear effects. The results were similar to those we report in Column 1 of Table 2, with no significant effect for the squared terms. We discuss this finding in detail in the “Discussion” section. We also reestimated the model using the interaction effect of lagged advertising and lagged R&D, but we find no support for this interaction effect. Thus, the estimation results strongly support H1 and H2, indicating that after we control for factors that accounting researchers have shown to affect the firm's systematic risk, increases in both advertising/sales and R&D/sales lower a firm's systematic risk.
Additional Analyses
Explanatory Power of Proposed Model
We compared the performance of the proposed model, which includes lagged advertising/sales and lagged R&D/sales, with a baseline model that includes only the accounting measures of growth, leverage, liquidity, asset size, dividend payout, and earnings variability and the two additional control variables of age and competitive intensity (we do not report the results here). The model with lagged advertising/sales and lagged R&D/sales outperforms the baseline model on the basis of the Schwarz Bayesian information criterion (a lower number indicates superior fit): The proposed model = 3705.873, and the baseline model = 3741.607. The direction and significance levels of the coefficients of BKS's (1970) variables in this baseline model without lagged advertising/sales and lagged R&D/sales are unchanged, again confirming that there is no evidence of multicollinearity of lagged advertising/sales and lagged R&D/sales with the control variables.
Alternative Estimates of Systematic Risk
The proposed model we report in Column 1 of Table 2 uses equal-weighted market returns to estimate the firm's systematic risk. To examine the robustness of the proposed model's results to alternative specifications for systematic risk, we also estimated β for the five-year moving window using the value-weighted market return, and in general, we obtain consistent results for the effects of advertising/sales and R&D/sales on the firm's systematic risk with value-weighted β estimates (see Column 2 of Table 2).
To examine the robustness of the negative effects of advertising/sales and R&D/sales on β, we expanded the data to include firms for which only 50 of the 60 months of stock returns in a moving window were available for β estimation. Columns 3 and 4 of Table 2 contain the results of model estimation using equal-weighted and value-weighted measures of market return in the β estimation for the expanded sample, which includes observations with 50 or more months of stock returns for the 60-month moving window. The effects of advertising/sales and R&D/sales on systematic risk using the larger data set of firms with as few as 50 months of stock returns are similar to those we obtained using the smaller data set, which includes firms for which all 60 months of stock returns were available to estimate β.
Changes Regression
Following an anonymous reviewer's suggestion, we explored the robustness of the results using a changes regression (Boulding and Staelin 1995). We created the difference value for a variable as the difference between the variable at time t and at time t – 1. The correlation matrix of the differenced variables suggested potential multicollinearity problems, especially between “change in advertising scaled by sales” and “change in R&D scaled to sales,” which perhaps is not surprising because increases in R&D are likely to be associated with increases in advertising. To reduce the impact of this multicollinearity, we orthogonalized predictor variables using factor analysis. Varimax rotation ensured that each factor had only one predictor variable that loaded heavily on that factor (variables’ loadings on their respective factors exceeded .98). We report the results of the changes regression models using difference scores for β, which we estimated with 60 months of equal-weighted returns using both raw predictor variables and factor-score predictor variables (to adjust for potential multicollinearity in the raw predictor variables) in Columns 5 and 6 of Table 2. The results of this estimation indicate a reasonable model fit and suggest that increases in a firm's lagged advertising/sales and lagged R&D/sales reduce the firm's systematic risk, in support of H1 and H2. 8
In general, we obtain similar results for the models that use β computed with value-weighted market return.
Reverse Causality
As we noted, the model we estimated considered the impact of the firm's advertising/sales in Period t – 1 and R&D/sales in Period t – 1 on systematic risk in Period t to rule out reverse causation. However, it is possible that either because of inertia (i.e., advertising budgets and R&D budgets are set as a percentage of sales) or because managers are forward looking, advertising and R&D budgets in Period t – 1 may be related to Period t's firm characteristics, particularly, systematic risk.
To rule out reverse causality, we performed the Granger-causality Wald tests (Dekimpe and Hanssens 2000; Granger 1969). Specifically, we performed Granger-causality Wald tests for each time series in the data set using a bivariate approach (Leeflang and Wittink 1992) between (1) the firm's systematic risk and its advertising/sales and (2) the firm's systematic risk and its R&D/sales. The results of the Wald tests indicate that a firm's systematic risk does not “Granger cause” either advertising or R&D, empirically ruling out the reverse-causality explanation.
In addition, we performed two regressions to rule out potential reverse-causality explanations. First, we regressed advertising/sales in Period t as a function of all predictor variables in the proposed model and β in Period t – 1. Second, we regressed R&D/sales in Period t as a function of all predictor variables in the proposed model and β in Period t – 1. Both models included fixed effects, an autocorrelation error term, and window dummies. The results of the regressions (we do not report these here) indicate that consistent with the lack of reverse causality we established previously, β in Period t – 1 does not affect either advertising/sales or R&D/sales in Period t.
Potential Endogeneity of Advertising and R&D
Following the explanation that a firm's managers may be forward looking, we also attempted to rule out potential endogeneity explanations of the firm's advertising/sales and R&D/sales. First, our fixed-effects formulation rules out endogeneity that might be caused by omitted variables. Second, following the work of Boulding and Staelin (1995), we checked for endogeneity of lagged advertising/sales and lagged R&D/sales using an instrumental variable estimation procedure.
We used the firm's advertising/sales and R&D/sales in Period t – 2 as the instrument for the firm's advertising/sales and R&D/sales in Period t – 1 and reestimated the model that relates a firm's two-period-lagged advertising/sales and R&D/sales to its systematic risk. The results of this instrumental variable estimation procedure (we do not report these here) are consistent with those we obtained with the one-period-lagged predictor variables of advertising/sales and R&D/sales reported for the proposed model in Column 1 of Table 2. Following the instrumental variable estimation, we also performed the Davidson–MacKinnon test (Woolridge 2002; pp. 118–22) of endogeneity for lagged advertising and lagged R&D and found no support for endogeneity of either advertising or R&D.
Alternative Measures of Advertising and R&D
In the results discussed thus far, we scaled both the firm's advertising and R&D expenditures by its sales. Following an anonymous reviewer's suggestion, we reestimated the model with measures of the firm's advertising and R&D scaled by its assets. The results (we do not report these here) using a model identical to the model reported in Column 1 of Table 2, but with advertising/sales and R&D/sales replaced by the advertising/assets and R&D/assets, respectively, indicate a reasonable model fit (F is significant at p < .01). The directionality of the parameter estimates of the predictor variables are consistent with those we report in Column 1 of Table 2, though the significance level changes to p < .05; advertising/assets (b = –.737, p < .05) and R&D/assets (b = −1.024, p < .05) lower the firm's systematic risk.
Alternative Measure of Earnings Variability
In addition, again following an anonymous reviewer's suggestion, we reestimated the model using cash flow variability as a control variable rather than earnings variability, as BKS (1970) use. Again, the results (we do not report these here) indicate a reasonable model fit (F is significant at p < .01); the results are consistent for the effects of both advertising/sales (b = −3.509, p < .01) and R&D/sales (b = –.443, p < .05) on systematic risk.
Thus, the results are robust to alternative model specifications, including the regression of differenced variables; alternative measures of systematic risk, including equal-weighted or value-weighted market returns and 60 months or 50 months of returns; alternative measures of advertising and R&D scaled by the firm's sales or assets; and earnings variability or cash flow variability. We also empirically rule out reverse causality (i.e., systematic risk lowers advertising and R&D) and endogeneity of both advertising and R&D expenditures. In summary, the additional analyses strengthen our confidence in our key findings that both lagged advertising/sales and lagged R&D/sales lower a firm's systematic risk.
Discussion
The accountability of marketing initiatives, especially as measured by metrics of interest to a firm's shareholders, is under increasing scrutiny from senior management and finance executives who control marketing budgets. Not surprisingly, marketing scholars have turned their attention to relationships between various aspects of a firm's marketing strategy and shareholder value, producing a wealth of insights that indicate an important role for marketing in shareholder wealth creation. However, there are few insights that relate a firm's marketing initiatives to its systematic risk, an important metric of risk for publicly listed firms. We examine the impact of a firm's advertising and R&D, two important manifestations of a firm's marketing strategy, on its systematic risk.
Theoretical Implications
To our knowledge, this is the first empirical study to cover a broad, multi-industry sample of firms over a 22-year period to demonstrate that after accounting and finance factors related to systematic risk are controlled for, increases in advertising/sales and R&D/sales lower a firm's systematic risk. The negative relationship between a firm's advertising expenditure and its systematic risk (shown by Singh, Faircloth, and Nejadmalayeri [2005] in a limited empirical context and by Madden, Fehle, and Fournier [2006], who do not control for accounting and finance factors and firms-specific effects) holds up for all firms across a period that extends from 1979 to 2001. By focusing on the firm's systematic risk, an important metric of considerable interest to senior executives of publicly listed firms, we address the several calls for marketing scholars and practitioners to speak in the language of finance (Rust et al. 2004; Srivastava, Shervani, and Fahey 1998).
The finding of a nonsignificant effect of the quadratic term for a firm's advertising/sales and R&D/sales on its systematic risk is notable and merits discussion. We offer two possible explanations for this phenomenon. First, perhaps there are diminishing returns to increased advertising/sales (and R&D/sales) for some range of advertising/sales (and R&D/sales) values, and perhaps advertising/sales (and R&D/sales) values have been constrained well below that optimum level, such that the relationship is linear. Such a situation may occur if firms are wise enough to set advertising/sales (and R&D/sales) for optimal financial returns and if the optimal financial return level is lower than that required to deliver the lowest β. Alternatively, the linear effect of advertising/sales may occur because a firm's senior management and finance executives lack the tools to evaluate the potential impact and thus set advertising/sales below levels that yield the lowest systematic risk. A second possible explanation for our inability to detect a quadratic effect when there are diminishing returns to increases in advertising/sales is heterogeneity across firms, industries, and/or time in the relationship between advertising/sales and β. As finance and accounting researchers have done previously, in the interest of generality, we estimate our model with the broadest possible cross-section of firms and industries and for an extended period, which lends confidence to the study's findings. Further research that explores firm, industry, and/or time-specific effects that moderate the effects of advertising on a firm's systematic risk may uncover firms, industries, or periods for which such diminishing returns may be identifiable.
In a departure from most prior studies of systematic risk that have used a silo-based approach (i.e., used only accounting and financial measures), we include accounting, financial, and marketing variables (in this case, advertising and R&D) in our model of systematic risk. The negative impact of advertising/sales and R&D/sales on systematic risk in our model, which also includes financial variables, suggests the potential interchangeability between a firm's marketing and financial choice variables in managing systematic risk. Further research that examines other interchangeable effects of other aspects of firms’ marketing and financial strategies on metrics of interest to capital markets (e.g., cost of capital, intangible value, stock returns) would be valuable to senior marketing executives, who are often under pressure from senior management teams to justify investments in advertising and R&D programs.
This study's finding that a firm's advertising/sales and R&D/sales lowers its systematic risk, combined with results from other studies (Madden, Fehle, and Fournier 2006; Mizik and Jacobson 2003) that show that a firm's advertising increases its stock return, leads to an interesting conjecture. Consistent with the notion that advertising and R&D increase a firm's stock returns, a post hoc analysis indicated that lagged advertising/sales and lagged R&D/sales were highly correlated with the firm's intangible value (ρ[advertising/sales, Tobin's q] = .013, p < .01; ρ[(R&D/sales, Tobin's q] = .283, p < .01). Specifically, we conjecture that the risk-lowering and return-enhancing effects of advertising and R&D may contribute to the anomaly that Fama and French (1992) identify. Although the capital asset pricing model assumes that firms with greater systematic risk can expect higher future returns, Fama and French find that there is no relationship between a firm's risk in one period and its return in the future. If firms that invest in advertising and R&D are able to raise their returns while lowering their risk, it might be expected that there would be no empirical evidence of the high risk–high return link. Such an effect would be consistent with the finding in the finance literature that investors prefer highly advertised firms (Grullon, Kanatas, and Weston 2004) and the finding in the marketing literature that advertising has a direct impact on stock price beyond its indirect effect through increased sales (Joshi and Hanssens 2004). Empirical research that explores this issue further would be valuable and would contribute to both the marketing and the finance literature.
Managerial Implications
The study's findings also generate useful implications for managerial practice. Given the increasing calls for the accountability of marketing initiatives, our findings that a firm's higher advertising/sales and R&D/sales lower its systematic risk are novel and useful. Marketing executives can use these findings to stress the multifaceted role of strong advertising and R&D programs, beyond their effects on market (e.g., sales, market shares) and financial (e.g., return on assets, cash flow) performance outcomes.
Given the dual benefits of advertising and R&D for firm value through effects on both stock returns (Mizik and Jacobson 2003) and systematic risk, firms must be cautious in cutting back on their advertising and R&D programs. A reduction in a firm's advertising or R&D can have a double negative effect, not only reducing its financial performance, attendant cash flows, and stock returns but also increasing its systematic risk, cost of capital, and discount rate.
We believe that the study's findings may surprise senior management and finance executives, some of whom may view their firms’ advertising and R&D programs as discretionary activities. Indeed, we believe that marketing executives can raise potentially provocative questions about whether extant allocation norms for advertising and R&D (e.g., as a fixed percentage of sales) still apply. Could marketing executives rightfully argue that some proportion of the firm's advertising and R&D budgets be considered a financial expenditure aimed at lowering its interest burden?
Although we are mindful about this study's limited influence in changing finance managers’ mind-sets about the uncertain returns to their firms’ advertising and R&D investments, we hope that it serves as an impetus for an ongoing dialogue among senior management, finance executives, and marketing executives about the important “financial” role of their firms’ advertising and R&D expenditures (Rust et al. 2004).
Indeed, the study's specific findings can guide marketing executives to initiate a dialogue with their finance counterparts. For example, what are the firm's historical levels of advertising/sales, R&D/sales, and systematic risk, both independently and compared with those of other firms in the industry? What are the implications of advertising and R&D budgets going forward not only for the firm's marketing objectives (e.g., sales, market share) and financial objectives (e.g., cash flows, return on assets) but also for its systematic risk? We anticipate that the answers to these and related questions could guide the development of benchmarks to assess the returns to advertising and R&D programs. Such ongoing dialogue may be instructive to senior management and finance executives who control advertising and R&D budgets but are skeptical about the financial accountability of returns to these investments.
Limitations and Further Research
Given data availability constraints for publicly listed firms, we focused on the relationship between a firm's systematic risk and its advertising and R&D, two important indicators of the firm's emphasis on differentiation and, therefore, of its marketing strategy. Theoretical research using complementary methods (e.g., in-depth interviews, surveys, field studies) to develop a conceptual model and propositional inventories that relate other elements of marketing strategy (e.g., marketing channels) to systematic risk will be useful in setting a research agenda for further empirical research.
Furthermore, we measured the firm's advertising and R&D using aggregated, annual dollar amounts scaled by the firm's sales. Although advertising and R&D expenditures are important, especially from the perspective of senior management and finance executives, they represent consolidated input measures, which do not account for differences in implementation of advertising (e.g., creativity of advertising campaigns, efficiency of media planning) and new product development programs (e.g., intellectual property rights, new product success rates, entry timing). Disaggregated measures of a firm's advertising and R&D programs for all publicly listed firms are not available. Further research that focuses on a few industry contexts and uses disaggregated measures of the various elements of advertising programs and new product development programs, including aspects of the programs’ effectiveness, could provide a useful extension to generate actionable managerial implications regarding the effects of various elements of a firm's advertising and new product development program on its systematic risk.
In summary, we view this study as an important first step in establishing that advertising and R&D lower systematic risk of a firm's stock. We hope that the study's findings stimulate further work in this area.
Footnotes
Proposed Model Predictor Variable Definitions and Measures
COMPUSTAT Data Items Used in Constructing Variables

| Name of Variable Component | COMPUSTAT Annual Data Items |
|---|---|
| Advertising/sales | DATA45/DATA12 |
| R&D/sales | DATA46/DATA12 |
| Total assets | DATA6 |
| Income available for common stockholders | DATA20 |
| Market value of common stock (Pt) | DATA24 × DATA25 × 1000 |
| Total senior securities (TotalSecurity) | DATA5 + DATA9 + DATA10 |
| Current asset (CurrentAsset) | DATA4 |
| Current liabilities (CurrentLiability) | DATA5 |
| Cash dividends (CashDividend) | DATA21 |
| Herfindahl's concentration index | DATA12 |