
Abstract
Keyword advertising, or “sponsored links” that appear alongside online search results or other online content, has grown into a multibillion-dollar market. Providers of keyword advertising, such as Google and Yahoo, profit by auctioning keywords to advertisers. An issue of increasing importance for advertising providers is the “share structure” problem—that is, of the total available resources for each keyword (in terms of exposure), how large a share should be set aside for the highest bidder, for the second-highest bidder, and so on. The authors study this problem under a general specification and characterize the optimal share structures that maximize advertising providers’ revenues. They also derive results on how the optimal share structure should change with advertisers’ price elasticity of demand for exposure, their valuation distribution, total resources, and minimum bids. The authors draw implications for keyword auctions and other applications.
The surge of keyword advertising has attracted attention from academic communities. Several researchers have examined the design of keyword auctions (e.g., Edelman, Ostrovsky, and Schwarz 2007; Liu, Chen, and Whinston 2009; Varian 2007) under the framework of “slot/position auctions,” in which the highest advertiser gets the best slot, the second-highest advertiser gets the second-best slot, and so on. In contrast, we view resources for auctioning as the aggregate exposure that all available slots generate for a keyword phrase and propose that advertising providers can choose “share structures”—that is, how large a share of the total advertising resources should be set aside for the highest bidder (advertiser), for the second-highest bidder, and so on. 1 The focus of this article is to address the share structure problem in keyword auctions.
Different slots may generate different amounts of exposure. For example, empirical studies suggest that higher-ranked slots generate more exposure than lower-ranked ones on the same page (Pieters and Wedel 2004).
It is practical for advertising providers (including advertising networks and publishers) to manage share structures actively and communicate them to advertisers. To tailor the share of advertising resources allocated to an advertisement, advertising providers may randomize the allocation of the advertisement among available slots. For example, advertising providers can let two advertisers time-share a slot. An advertising network can also choose the number of Web sites on which to display an advertisement. To communicate the share structure to advertisers, advertising providers can provide estimated exposure for the highest bidder, the second-highest bidder, and so on, so that advertisers can bid accordingly. 2
Indeed, Google provides advertisers an estimated position along with the expected number of impressions in its Traffic Estimator tool. This tool can be used to communicate the share structures to advertisers before auctions because it provides sufficient information on how much exposure can be expected for being in a particular rank.
For several reasons, advertising providers should actively manage share structures rather than simply assign the first slot to the highest advertiser, the second slot to the second-highest advertiser, and so on. 3 First, for some keywords, advertisers far outnumber the available slots. As a result, advertising providers may want to let multiple advertisers time-share a slot. Second, assigning the jth slot to the jth-highest advertiser may be a natural choice when there is a single Web site, but with the expansion of keyword advertising, advertising providers, such as Google and Yahoo, tend to have a large advertising network that offers many similar Web pages at the same time. Being in the top slots of all Web pages may be too much exposure for any single advertiser. Third, how advertising slots are located on a page is often up to the publishers. Slots may have no meaningful ranking (e.g., horizontally arranged slots may generate roughly the same exposure). In summary, many advantages exist for advertising providers to tailor the shares of advertising resources for advertisers of different ranks in the bidding outcome.
Advertising providers do not publish details of their auctions. However, existing evidence suggests that they use the latter approach. For example, Google states, “Ads are positioned on search and content pages based on their Ad Rank. The ad with the highest Ad Rank appears in the first position, and so on down the page” ” (https://adwords.google.com/support/bin/answer.py?answer=6111). Yahoo and MSN similarly display higher-ranked advertisements in more favorable positions.
The issue of optimal share structures holds special importance for online advertising. Keyword auctions power both “sponsored search” (i.e., keyword advertisements that appear alongside search engine results) and “contextual advertisements” (i.e., keyword advertisements that appear alongside regular content). For example, Google uses keyword auctions to sell both sponsored search on its main search site and contextual advertisements on hundreds of thousands of Web sites in its advertising network. Keyword advertising providers also actively seek expansion of keyword auctions to other advertising formats, such as display and video advertising, and to other media, such as mobile devices, radio, and print advertising. Recently, Google acquired DoubleClick, a leading Internet display advertising provider, which has helped it expand beyond keyword advertising. Google allows advertisers to bid for placement of video advertisements on the popular video site YouTube. Both Google and Yahoo offer auction-powered print advertising services. As of March 2008, Yahoo's Newspaper Consortium comprised more than 600 newspapers. Google's Print Ads has enlisted more than 700 newspapers. As more advertising resources become available for auctions, it is of increasing importance for advertising providers to optimize share structures for these resources.
We use a game-theoretical framework to address the optimal share structure problem. To our knowledge, this article is the first to endogenize the share structure of online advertising auctions and to study its optimal design. We assume that the advertising provider can divide total advertising resources into multiple shares. Advertisers’ valuation for a share is determined by the size of the share and a private valuation factor. Advertisers are invited to bid their willingness to pay per unit of resource (or unit price). The advertising provider allocates shares such that the advertiser that offers to pay the highest unit price receives the largest share, the advertiser who offers to pay the second-highest unit price receives the second-largest share, and so on. We use this model framework to identify factors that are relevant to the share structure design problem and derive managerial guidelines on how different factors affect the optimal share structure design.
This article makes a substantive contribution to the literature on keyword auction design. First, we characterize the optimal share structure in a general setting. We conclude that when advertisers’ valuation is linear or convex in share size, a single grand share is optimal. When advertisers’ valuation is sufficiently concave, multiple shares may become optimal. In general, the optimal share structure consists of a series of “plateaus,” or consecutive shares of identical size. We find that the occurrence of plateaus is determined mainly by the distribution of advertisers’ valuation factors.
Second, we offer insights into how the optimal share structure should change with several underlying demand or supply factors. We focus on how the steepness of the optimal share structure is affected by the following factors: advertisers’ price elasticity, advertisers’ valuation distribution, total resources, and minimum bids. A share structure is steeper if it has larger high-ranked shares and smaller low-ranked ones.
We define advertisers’ price elasticity as the percentage of change in advertisers’ demand for exposure resulting from a 1% change in price. We find that as advertisers’ price elasticity decreases, the advertising provider should use a less steep share structure. When advertisers have near-perfect or perfect elastic demand, the advertising provider should use the steepest share structure, allocating as many resources as possible to the highest advertisers.
A change in advertisers’ valuation distribution affects the optimal share structure in the following way: The optimal share structure should remain the same in the case of “scaling” (i.e., multiplying each advertiser's valuation factor by a common factor) and be less steep when the valuation distribution is “shifted” to the right (i.e., increasing each advertiser's valuation factor by a common factor).
When total resources increase, the absolute share sizes increase. However, changes in percentage values of shares depend on how advertisers’ price elasticity of demand changes in total resources assigned to them. Top bidders should receive a larger percentage of the total resources when advertisers’ price elasticity of demand increases in the amount of resources allocated. The converse is true when advertisers’ price elasticity decreases.
We also show that the advertising provider should use a less steep share structure when imposing an optimally set minimum bid than when not imposing a minimum bid. Together, these results provide useful guidelines on how to manage share structures to fit specific market conditions.
We organize the rest of the article as follows: In the next section, we discuss the related literature. Then, we set forth our model and derive general results on optimal share structures. Following this, we discuss how the optimal share structure is affected by the underlying supply and demand factors. We then extend our analysis to a case with minimum bids. Finally, we summarize our conclusions, offer implications of our results, and suggest possibilities for further research.
Related Literature
Marketing researchers have long recognized the importance of online advertising (Manchanda et al. 2006) and search (Bradlow and Schmittlein 2000). For example, Manchanda and colleagues (2006) empirically study the effect of banner advertising on purchasing patterns on the Internet. Wilbur and Zhu (2009) assess the problem of click fraud in pay-per-click search advertising and discuss how search engines’ revenues are affected by such fraud. In addition, much research has been done on other types of Internet-based auctions, such as eBay auctions (Sinha and Greenleaf 2000), name-your-own-price auctions (Spann and Tellis 2006), and online reverse auctions (Jap 2007). However, keyword auctions differ from these types of auctions because in the latter, bidders often have unit demand for indivisible goods.
This article is most closely related to two literature streams. First, it is related to the stream of research on keyword auction designs. Prior research has examined online advertising auctions from several other perspectives. A few authors (Lahaie 2006; Liu and Chen 2006) have studied the unique weighted ranking rules that advertising providers use—that is, ranking advertisers by the product of their pay-per-click bids and their historical click-through rates (defined as the ratio of the number of clicks to the number of impressions). They find that such weighted ranking rules achieve efficiency in a unit price auction setting. Edelman, Ostrovsky, and Schwarz (2007) refer to keyword auctions as generalized second-price (GSP) auctions because an advertiser does not pay its own pay-per-click bid but rather the next highest one. Both Edelman, Ostrovsky, and Schwarz (2007) and Varian (2007) show that in GSP auctions, truthful bidding is not an equilibrium. Edelman, Ostrovsky, and Schwarz show that a GSP auction admits a set of “locally envy-free” equilibria that generate as least as much revenue as the Vickery-Clarke-Grove mechanism. Borgers and colleagues (2007) study GSP auctions under a more general specification and show that GSP auctions have multiple equilibria and that the efficient equilibrium that both Edelman, Ostrovsky, and Schwarz and Varian study may not be justified using simple equilibrium refinement. Both Varian (2007) and Borgers and colleagues (2007) also empirically investigate equilibrium bidding using early keyword auction data, but they reach different conclusions on the efficiency of these auctions. All these studies treat share structures as exogenously given. The current research complements these studies by examining advertising providers’ share structure decisions.
Second, our research problem is related to the second stream of literature on the prize-allocation problem in contests. Kalra and Shi (2001) study prize allocation among salespeople and find that more prizes should be given as salespeople become more risk averse. Glazer and Hassin (1988) model contests as “all-pay” auctions or auctions in which bidders forfeit their bids whether they win or not. They find that winner-take-all is optimal when contestants’ disutility is linear in their effort and skill is uniformly distributed. Moldovanu and Sela (2001, 2006) also show that winner-take-all is optimal as long as the disutility function is linear. Liu, Geng, and Whinston (2007) study prize allocation in promotional contests when the contest designer maximizes contestants’ efforts rather than their outputs. Although prizes are allocated in a manner similar to the way shares are allocated, contests with convex disutility are structurally different from share auctions with concave valuation. In contests, the convexity of the disutility function affects contestants’ preference for different prize structures indirectly through varying the costs of securing different-ranked prizes, whereas in share auctions, the concavity of the valuation function directly affects advertisers’ preference for different share structures. Such a fundamental distinction enables us to characterize the optimal share structure for a more general n-share setting and to uncover the relationship between plateaus in the optimal share structures and the underlying valuation distribution. Moreover, we offer several new insights, including how advertisers’ valuation distribution and total resources available affect optimal share structures.
Finally, this research also contributes to the literature on pricing capacity-constrained services (Rust and Chung 2006). Because of the perishable and capacity-constrained nature of advertising resources, they are similar to other capacity-constrained services, such as airline seats and hotel rooms (Desiraju and Shugan 1999), broadcast spots (Lodish 1980), and access services (Essegaier, Gupta, and Zhang 2002). However, prior literature on capacity-constrained services has focused exclusively on the posted prices rather than on auctions.
Research Model
Share Structure
A risk-neutral advertising provider has an exogenous amount of advertising resources, with a normalized size 1. There are n risk-neutral advertisers, indexed by i = 1, 2, …, n. The advertising provider prepackages total resources in as many as n shares, ranked from large to small. We use j to index shares. We denote Sj as the size of the jth share. We term the vector of share sizes, s = (s1, s2, …, sn), as a share structure. Share structure s is feasible if it satisfies the following two conditions:

The first condition requires shares to be ordered in a non-increasing way. The second condition requires the sum of shares not to exceed available resources. Figure 1 shows an example of a feasible share structure.
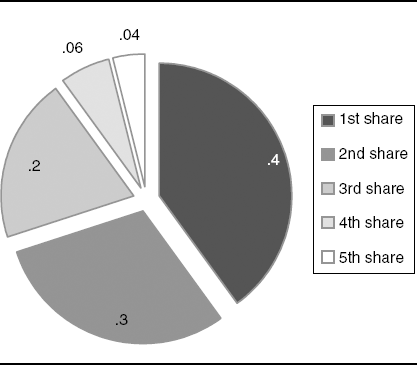
An Example of a Share Structure
As we discussed previously, we consider advertising resources the total exposure generated by all available slots for a keyword phrase. Each share is part of the total available exposure. A slot/position auction (Lahaie 2006; Varian 2007) can be viewed as a special case of our model in which the first share provides the exposure generated by the first slot, the second share provides the exposure generated by the second slot, and so on. Thus, our model allows for a more flexible distribution of the total available exposure among bidders of different ranks.
Advertisers’ Valuation
We assume that advertiser i's valuation of a share is a function of a valuation factor (or the advertiser's type) V; and the size of the share. Specifically, advertiser i's valuation for the jth share takes the following form:

where Q(0) = 0 and Q′(·) > 0 (i.e., the valuation increases in the share size). Type v captures the difference in advertisers’ valuation of resources. The valuation function Q(·) captures how advertisers’ valuation changes in share sizes.
We assume that each advertiser's type is drawn from a common distribution F(v), v ∈ [
Auction Format
The advertising provider uses a unit price auction to allocate all shares simultaneously. In particular, the advertising provider invites advertisers to bid on their willingness to pay per unit of resource, or the unit prices. The advertising provider ranks all bidders according to their unit prices and assigns the first share to the highest bidder, the second share to the second-highest bidder, and so on. We assume that advertisers pay for their assigned shares at the next highest prices. Such an assumption is supported by the prevailing practice among the leading online advertising providers. For example, Google uses a program called AdWords Discounter, which automatically reduces an advertiser's bid to the lowest possible price to keep its rank in the auctions. Yahoo has a similar policy.
The assumption that advertisers are ranked by their willingness to pay per unit of resource is consistent with actual auction formats used in keyword auctions. One popular auction format is pay-per-impression auctions, in which advertisers bid and are ranked by their willingness to pay per impression. For example, Google uses this auction format for contextual advertisements in its advertising network. Our model assumption is consistent with this format. Another popular auction format is weighted pay-per-click auctions (Liu, Chen, and Whinston 2009), in which advertisers bid on their willingness to pay per click but are ranked by the product of their willingness to pay per click and historical click-through rates. Google uses this format for its search-based advertising (sponsored search). Yahoo adopted a similar format in early 2007. If an advertiser's historical click-through rate is an unbiased estimator for the advertiser's future click-through rates, this approach essentially ranks advertisers by their expected willingness to pay per impression. Thus, our model assumption corresponds to this second format as well. 4
Indeed, our model also applies to pay-per-action advertising (i.e., advertisers pay only when an online user undertakes a certain action, such as purchase or registration, after seeing the advertisement), as long as advertising providers rank advertisers by the product of their pay-per-action and action-to-impression rates (corresponds to click-through rates in pay-per-click advertising).
Advertisers’ Payoff
Each advertiser's expected payoff is the expected valuation less the expected payment to the advertising provider. In particular, if we denote Pj(b) as the probability of winning the jth share by placing a bid of unit price b and if

Advertising Provider's Revenue
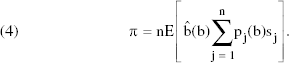
The advertising provider's revenue is the sum of payments from all advertisers. Because the advertising provider does not know advertisers’ types or their bids ex ante, the advertising provider's expected revenue is the expected payment from all advertisers:
Game Timeline
The game proceeds as follows: The advertising provider announces a share structure (s1, s2, …, sn). All advertisers privately learn their respective types and compete for shares by bidding their unit prices. The advertising provider then allocates the shares according to the ranking of the bids. An advertiser's problem is to maximize, for any announced share structure, the expected payoff (Equation 3) by choosing a unit price b. The advertising provider's problem is to maximize the expected revenue (Equation 4) by choosing a feasible share structure. The way to design the share structure from the advertising provider's perspective is the focus of this article.
Given advertisers’ valuation (Equation 2), we can also define advertisers’ price elasticity. The price elasticity of advertisers’ demand is the percentage of change in advertisers’ demand resulting from a 1% change in price per unit of resource. Note that given price e, an advertiser should choose demand d to maximize the total payoff [vQ(d) – (e × d)] in a fixed-price setting. This enables us to calculate the advertiser's price elasticity of demand as follows:

The shape of Q(·) determines advertisers’ price elasticity. Specifically, an advertiser is perfectly price elastic if Q(·) is linear, and the advertiser's price elasticity decreases as Q(·) becomes more concave.
General Results on the Optimal Share Structure
In this section, we study the advertising provider's problem of choosing an optimal share structure. We assume that there is no minimum bid to focus on the impact of underlying supply and demand factors (subsequently, we relax this assumption). In what follows, we first derive some basic concepts and results under a simple linear valuation setting. We then use these concepts and results to examine the optimal share structures under more general valuation functions.
Equilibrium Revenue
Because we focus on the advertising provider's share structure problem, advertisers’ equilibrium bidding function is not of particular concern here. Instead, we focus on the advertising provider's expected revenue. Using methods outlined in the auction literature (e.g., Klemperer 1999), we can derive the advertising provider's expected revenue π as the sum of expected payments from all advertisers (for details of this derivation, see the Web Appendix at http://www.marketingpower.com/jmjuly09):
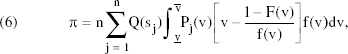
where

is the equilibrium probability for an advertiser of type v to win the jth share.
We further denote J(v) ≡ v – [1 – F(v)]/f(v) as the marginal revenue of type v.
5
The term Q(Sj)J(v) in Equation 6 represents a type-v advertiser's revenue contribution to the advertising provider when the advertiser is assigned to the jth share. The revenue contribution is less than the advertiser's valuation of the share, Q(Sj)v, except when
Both Bulow and Roberts (1989) and Klemperer (1999) use the term “marginal revenue” under a single-object auction setting. Marginal revenue generated by an advertiser is different from the actual revenue generated by the same advertiser because marginal revenue also accounts for the impact of this advertiser's participation on other advertisers.
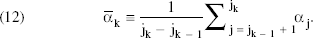
We further denote

and use the term αj to refer to the return factor for the jth share. Note that Pj(v) is the equilibrium probability of winning the jth share, so the return factor is the expected marginal revenue generated by winners of the jth share. Return factors reflect the difference in return rates for the same amount of resources allocated to different shares. Using this definition, we can rewrite the expected revenue (Equation 6) as follows:
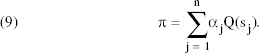
The advertising provider's problem is to maximize Equation 9 subject to feasibility conditions in Equation 1. Intuitively, a share with a high return factor yields higher revenue for the advertising provider than a same-sized share with a low return factor. This implies that when possible, the advertising provider will allocate resources to shares with high return factors.
The relative magnitude of the return factors holds special importance in the optimal share structure problem. In general, the return factor of a share is determined by the distribution of types and the number of advertisers, but it is independent of the share structure s or the valuation function Q(·). Lemma 1 provides some insight into relative sizes of return factors.
A distribution satisfies the monotone-hazard-rate (MHR) condition if its hazard rate, f(v)/[1 – F(v)], monotonically increases within its support. The MHR property is satisfied by most single-peaked distributions, such as uniform, normal, and logistic.
(a) α1 > αj for all j > 1, and α1 > 0. (b) Under the MHR condition, α1 > α2 > … > αn.
(We defer proofs of all propositions to the Appendix and proofs of all lemmas to the Web Appendix [http://www.marketingpower.com/jmjuly09].)
Lemma la shows that the first share is superior to any other share in terms of return factors, regardless of the number of advertisers or the type distribution. The intuition for this result is as follows: The marginal revenue of the high types (close to
The intuition for Lemma lb is as follows: In general, a high-type advertiser is more likely to win a high-ranked share than a low-ranked share, and the reverse is true for a low-type advertiser. The MHR condition, which implies that a high-type advertiser has higher marginal revenue than a low-type advertiser, reinforces the advantage of offering a high-ranked share (in terms of the revenue generated), thus ensuring a decreasing order among return factors.
Lemma 1 has immediate implications for the linear valuation case. With linear valuation Q(s) = s, an advertiser's valuation of a share becomes u(v, s) = vs. Thus, v can be interpreted as advertisers’ marginal valuation. The problem with choosing an optimal share structure (Equation 9) becomes the following constrained linear program:

Because α1 is the largest among all the return factors by Lemma 1, the advertising provider should allocate all the resources to the first share, leading to a winner-take-all share structure. Under the MHR condition, return factors decrease. The winner-take-all result can be strengthened to a greedy allocation—that is, to fill up the jth share before the (j + 1)th share. The strengthened result is useful when, for example, the first share must be less than 1. The following proposition summarizes this intuition:
If advertisers’ valuation is linear in share size, (a) it is optimal to provide one grand share of size 1 (whenever possible), and (b) when the MHR condition holds, the advertising provider should allocate the resources in a greedy way—that is, to fill up the jth share before moving on to the (j + 1)th share.
Recall that linear valuation corresponds to the setting in which advertisers’ demand is perfectly elastic. This setting may hold approximately when the supply of advertising resources is small compared with the demand, given that advertisers’ marginal valuation declines beyond a certain point. P1 suggests that when advertisers’ valuation is perfectly elastic, it is optimal to use a winner-take-all share structure.
Our analysis shows that a high-ranked share promotes higher bids from high-type advertisers than a low-ranked share, provided that the two shares have the same size. The opposite is true for low-type advertisers. Thus, in general, the optimal choice of share structure involves trading off between best motivating the high-type advertisers and best motivating the low-type ones. This might depend on how advertisers’ types are distributed. Surprisingly, P1 shows that it is always optimal to best motivate the high-type ones, regardless of the distribution of advertiser types or the number of advertisers.
It is also worth noting that when the MHR condition is violated, return factors may not follow a descending order; therefore, the greedy allocation that P1b specifies may not be optimal, as the following example proves:
Let F(v) = (v – 1)1/4, v ∈ [1, 2], and n = 3. Assume that share sizes cannot exceed .5. Calculation shows that the return factors are 1.14, .91, and .94, respectively. A greedy allocation, (.5, .5, 0), generates an expected revenue of 1.029, whereas the optimal share structure, (.5, .25, .25), generates an expected revenue of 1.036.
Concave Valuation
P1 suggests that the advertising provider should allocate all the resources to the first share in the case of linear valuation. This would require the top bidder to appear in all available advertising slots for a particular keyword. However, this is seldom the case. One explanation could be that advertisers’ valuation is nonlinear in share sizes. We address the nonlinear valuation case in this section.
When Q(·) is convex, advertisers’ marginal valuation, vQ'(s), increases with the share size. Thus, the advertising provider has a stronger incentive to create a larger share than in the linear valuation case. Consequently, the results in P1 continue to hold. Thus, we focus on the case of concave Q(·).
In keyword advertising, Q(·) might be concave for at lease two reasons. First, consumers’ attention devoted to an advertisement may be less than twice as much if we double the amount of time it is shown (Lilien, Kotler, and Moorthy 1992, p. 267). Second, the unit cost to fulfill consumers’ requests may rise because of limited production/service capacity. Thus, advertisers’ marginal valuation for exposure may decrease as the total exposures increase. For example, smaller e-commerce Web sites begin to lose some customers because of congestion problems as the traffic to the sites becomes very high.
In the case of concave valuation, advertisers’ unit valuation decreases with share size and so does the unit price they are willing to pay. As a result, the advertising provider has additional incentive to offer advertising resources in smaller shares. The following example illustrates an optimal share structure with multiple shares. The optimal share structure consists of several groups of same-sized shares. We call each group a plateau. A plateau is nontrivial if it consists of more than one share.
Let F(v) = (v – 1)1/4, v ∈ [1, 2], n = 3, and Q(s) = ✓s. Under this specification, the optimal share structure is (.4310, .2845, .2845). Thus, the first plateau consists of the first share, and the second plateau consists of the second and third shares.
When do nontrivial plateaus occur in optimal share structures? What determines the boundaries of plateaus (i.e., the first and the last shares of the plateaus)? Lemma 2 shows that plateau boundaries are intimately related to return factors. We denote the rank of the last share of the kth plateau as jk:
Under an arbitrary concave function Q(·), the rank of the last share of the kth plateau in the optimal share structure is recursively defined by (let j0 = 0) 6

In other words, the advertising provider must assign equal resources to (jk + 1)th through (jk + 1)th shares (defined in Equation 11) in the optimal share structure.
If there are multiple maximums, we define jk as the largest one.
Equation 11 states that the last share of the kth plateau is chosen to maximize the average return factor of shares within that plateau. If the return factor of the first share of a plateau is higher than that of any lower-ranked share, the plateau should consist of only that share. Thus, if return factors of shares are strictly decreasing, as in the case of a MHR type distribution (see Lemma lb), each plateau should consist of exactly one share. In other words, a low-ranked share should be assigned strictly fewer resources than a high-ranked share. Conversely, when return factors do not decrease in share ranks, which is likely to happen when the type distribution is not single peaked, plateaus may arise in the optimal share structure. In other words, the advertising provider may find it optimal to assign equal resources to multiple shares of different ranks.
We denote the average return factor of the kth plateau as follows:
Because the last share of a plateau is chosen to maximize the average return factor of that plateau, the average return factors (
The rationale for Lemma 2 is as follows: Suppose that instead of assigning equal resources to all shares within a plateau, the advertising provider assigns more resources to the lth share than to the (l + 1)th share in the plateau. The advertising provider can always shift a small amount of resources from each of the first l shares and spread them equally to the remaining shares in the plateau. This operation is profitable because our definition of jk‘s guarantees that the average return factor of the first l shares in a plateau will be lower than that of the remaining ones in the same plateau. This process can continue until all shares within the plateau have equal sizes.
Lemma 2 also implies that the first plateau always consists of only the first share. This is because the return factor of the first share is higher than that of any other share (Lemma 1a).
Continue with Example 2. Calculation shows that α1 = 1.14, α2 = .91, and α3 = .94. By definition of jk‘s (Equation 11), j1 = 1, and j2 = 3 (because α2 < (α2 + α3)/2). Thus, the first plateau consists of the first share, and the second plateau consists of the second and third shares, confirming Example 2.
On the basis of the result in Lemma 2, we characterize the optimal share structure in the following proposition:
P2: Given an arbitrary concave function Q(·), the optimal share structure is given by
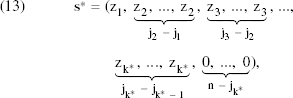
where z1 > z2 > … > zk* > 0, and the number of positive plateaus (k*) and their sizes (z1, …, zk*) are determined by
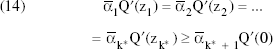
and
P2 builds on Lemma 2 and illustrates how many resources should be assigned to each plateau. Equation 14 shows that the return of marginal resources at each plateau (
As Lemma 2 shows, the boundaries of plateaus are determined only by the return factors (and, thus, by the type distribution and the number of advertisers). In contrast, the number of positive plateaus and the share sizes for plateaus are jointly determined by the return factors and the shape of the valuation function (P2). The characterization of the optimal share structure in P2 holds for general concave valuations and type distributions.
Under the MHR condition, the return factors monotonically decrease, and therefore each plateau consists of a single share (Lemma 2). Thus, we have the following corollary:
If the MHR condition holds, the optimal share structure s*, together with the optimal number of positive shares, k*, is determined by

and
These results suggest the following general procedure for determining the optimal allocation of advertising resources for winners of different ranks: First, the advertising provider should organize adjacent shares into groups, beginning with the first share, according to the principle of maximizing the average return factor within the group (Lemma 2). This process may result in several groups of shares, or plateaus, with strictly decreasing average return factors. Second, the advertising provider allocates each marginal resource to the plateau that yields the highest marginal return at the moment, until all advertising resources are allocated. This may result in total resources being spread across multiple plateaus because when advertisers’ marginal valuation for resources decreases, a plateau with a higher average return factor but more resources can generate lower marginal returns than a plateau with a lower return factor but fewer resources. Finally, the advertising resources allocated to each plateau are split equally among shares in that plateau. If the distribution of advertisers’ valuation is regular (i.e., type distribution satisfies the MHR condition), each plateau consists of exactly one share (Corollary 1). So the advertising provider can skip Step 1 and begin at Step 2.
Optimal Share Structures and Underlying Supply and Demand Factors
In this section, we carry out a series of comparative-static analyses on the optimal share structure. These analyses serve two purposes. First, we generate more managerial guidelines for advertising networks and publishers to choose different share structures for different market settings. Second, by isolating the effects of underlying factors, we can gain more insights into the connection between the optimal share structure and the various underlying supply and demand factors. We examine several factors, including the shape of the advertisers’ valuation function Q(·) the distribution of type v, and the total resources available. To measure the changes in share structures, we propose ordering share structures by their “steepness,” which we define as follows:
Let

We define
Graphically, Equation 16 dictates that the line connecting the less steep share structure (

Steepness Order of Share Structures
In practice, the steepness order can be measured by the widely used Herfindahl index, which is defined as the sum of squares of shares. We can verify that the steeper the share structure, the higher is the Herfindahl index, but the converse is not necessarily true. For example, (.6, .2, .2) has a higher Herfindahl index than (.5, .35, .15), but the former is neither steeper nor flatter.
Concavity of the Valuation Function
We now consider the impact of the concavity of the valuation function on the optimal share structure. As we pointed out, the concavity of the valuation function can also be interpreted as the price elasticity of advertisers’ demand. The literature on capacity-constrained services has shown that consumers’ price elasticity plays an important role in the firm's optimal pricing policy (Desiraju and Shugan 1999). Here, we show that price elasticity also plays an important role in determining the optimal share structure. We begin with an example:
Let v be uniformly distributed on [1, 2], n = 3, and

Optimal Share Structure as a Function of γ, Q(s) = sγ
Example 4 shows that as advertisers’ price elasticity decreases, the optimal share structure moves away from winner-take-all toward a more egalitarian share structure. Specifically, this example shows a gradual shift of resources away from the first share toward the second and third shares. Subsequently, we generalize this example to a broader setting.
We measure concavity by the commonly used concave transformation approach (Mas-Colell, Whinston, and Green 1995). Formally, let Q(·) and
The optimal share structure becomes less steep as the concavity of Q(·) increases. Furthermore, if the optimal share structure under Q(·) is not winner-take-all, it becomes strictly less steep as the concavity of Q(·) increases.
According to P3, as the valuation function becomes more concave, the optimal share structure moves away from winner-take-all toward n equal shares. Intuitively, as the valuation function becomes more concave, the advertising provider prefers many small shares to few large shares because advertisers value the former more. The strength of this proposition lies in the notion that the redistribution of resources occurs according to the steepness order rather than other ways. For example, if the current optimal share structure is (.5, .25, .25), we can rule out (.45, .35, .2) as a new optimal share structure if the valuation function becomes more concave. This proposition predicts that as the concavity increases, the number of shares weakly increases, the first share is usually smaller, and the low-ranked shares will not become smaller. Note that the result in P3 holds regardless of the type distribution.
To our knowledge, this is the first study to establish the relationship between the concavity of advertisers’ valuation (or the price elasticity of their demands) and the steepness of the optimal share structure. Moldovanu and Sela (2001) show that in an all-pay-auction model of contests, it may be optimal to award multiple prizes when contestants’ disutility functions are convex. We establish a stronger bond between concavity of the valuation function and share structure for our setting; namely, not only can multiple shares become optimal under a concave valuation, but share structures can also become less steep as the valuation function becomes more concave.
The implication of P3 is highly actionable. When advertisers’ price elasticity is high or low, advertising providers can decide whether to provide steep share structures or flat ones. To achieve steep share structures, advertising providers can assign the top bidders to the best slots at all times and across all Web sites. They can also use premium displays to enhance the fraction of exposure allocated to those advertisers. To achieve flat share structures, advertising providers can randomize the allocation of advertising slots among winners of different ranks to ensure that they receive relatively equal shares of the total exposure.
Advertising providers can estimate the advertisers’ price elasticity from their bidding history. They can also conduct experiments to observe how advertisers’ willingness to pay changes with the expected volume they receive. An advantage of online advertising is that advertising providers can conduct such experiments at a relatively low cost because perturbations of their systems can be done electronically and take effect instantly.
Type Distribution
The distribution of types varies across different keywords. Some keywords are more expensive than others. For example, advertisers for “mortgage” sometimes bid as high as $40 per thousand impressions, whereas advertisers for “CD” usually bid less than $1 per thousand impressions. The distribution of willingness to pay per impression may also differ from one keyword to another. For example, keywords with broad appeal may attract advertisers from different industries with wildly different willingness to pay, whereas highly specific keywords may attract advertisers of a narrowly defined industry with relatively homogeneous willingness to pay. The question is how the advertising providers should tailor the share structure offerings for different type distributions.
The type distribution affects the optimal share structure through the return factors. To study the effect of the type distribution, we must first understand how the return factors affect steepness of the optimal share structure. Lemma 3 associates the steepness with return factors:
Let Q(·) be an arbitrary concave function and

and
This result can be extended to share structures with different plateau boundaries. To do so, we can “iron out” the peaks in the return factors in each share structure by defining a normalized return factor vector
Lemma 3 shows that if
The type distribution is “scaled” if each advertiser's type parameter is multiplied by a common factor. Advertisers’ type distribution is “shifted” to the right if each advertiser's type parameter increases by a common factor. The following proposition summarizes the impact of scaling, shifting, and a change in the underlying type distribution, termed “marginal-revenue-ratio compression”:
We use αj and
(Scaling) When (Shifting) When (Marginal-revenue-ratio compression) We assume that both type distributions are MHR and have positive marginal revenues. When the ratio of marginal revenues at any two percentiles y and x (y > x) under
For a formal representation of this condition, see the Appendix.
The intuition for P4a is as follows: When all advertisers’ valuation is scaled by factor w, their equilibrium bids are scaled by the same factor, but their probabilities of winning remain the same. As a result, all the return factors are scaled by the same factor. Because what matters to the optimal share structure are the relative sizes of return factors, the optimal share structure should remain the same.
P4b suggests that shifting to the right causes a flatter optimal share structure. Again, shifting does not change advertisers’ winning probabilities, but it does cause all advertisers to increase their bids. The increase in low-type advertisers’ bids is more significant because their type v has increased by a larger proportion. In turn, this reduces the ratios between the return factors of high-ranked shares and those of low-ranked shares because the low-ranked shares are more likely to be assigned to low-type advertisers. As the return factors for low-ranked shares increase relative to those for high-ranked shares, the optimal share structure should be less steep (Lemma 3).
P4c suggests that the optimal share structure should be less steep if marginal revenue ratios between any two percentiles are compressed. This result highlights that what matters is the ratios of marginal revenues at different percentiles rather than the absolute marginal revenues.
Returning to the questions we raised at the beginning of the section, we can now report that the optimal share structure for expensive keywords may or may not be steeper than that for less expensive ones. If the distribution of advertisers’ valuation (corresponds approximately to the type distribution) for more expensive keywords is simply a rescaling of that for less expensive ones, advertising providers should apply the same share structure for these keywords. For example, if advertisers’ valuation factor for an expensive keyword is uniformly distributed on [2, 4] and if their valuation factor for a less expensive one is uniformly distributed on [1, 2], advertising providers should use the same share structure for these two keywords. In contrast, if advertisers’ valuation factor for the more expensive keyword is uniformly distributed on [4, 5], advertising providers should use a flatter share structure for the more expensive keywords. As P4c suggests, if the marginal revenue contribution of advertisers at low percentiles closes in on that of advertisers at high percentiles, advertising providers should use a flatter share structure, and vice versa. In practice, advertising providers may learn advertisers’ marginal revenues by observing the actual revenue generated per exposure.
Total Resources
So far, we have assumed that the total resource is fixed and normalized to 1. In this subsection, we allow the total resources to change and examine the impact on optimal share structures.
The total resources available to advertisers change with the number of searches conducted (in sponsored search) and the number of page views (in contextual advertising). The total resources may change over time for many reasons, including a change in the popularity of the Web sites, increased searches on particular keywords because of special events, and new additions to the advertising networks. For example, when Google signed a contract with AOL to serve online advertisements on AOL.com, Google's keyword advertising resources surged. How should advertising providers adjust their share structures according to the total resources available?
Our characterization of the optimal share structures in P1 and P2 still holds, except that total available resources are no longer 1. Moreover, when total resource is the only changing factor, the return factors are the same, and therefore the boundaries of plateaus should remain the same (Lemma 2). Therefore, we can concentrate on how the total resources are allocated among different plateaus. We observe the following trend in the absolute share sizes, the number of shares, and the relative share sizes in the optimal structure:
Under a concave Q(·), as the total resources increase, (a) the size of each positive share increases and the number of positive shares weakly increases, and (b) a high-ranked share increases by a smaller (bigger or the same) percentage than a low-ranked one, if advertisers’ price elasticity decreases (increases or remains constant) in the amount of resources allocated to them.
The intuition for P5a is as follows: As the amount of total resources available increases, the marginal return of resources should decrease because of the concavity of the advertisers’ valuation. Because the return factor of each share remains the same, the resource allocated to each share must increase. Otherwise, the marginal return from each share will be equal to or higher than previously, contradicting the argument that the marginal return of resources should decrease.
P5b suggests that whether some shares increase more in proportion to others depends on how advertisers’ price elasticity changes with the resources allocated to them. Intuitively, when advertisers have a decreasing price elasticity, their demand becomes less elastic as shares become larger. Thus, when the total resources increase, the advertising provider should increase high-ranked shares by a smaller percentage. Conversely, when advertisers have increasing (constant) price elasticity, the advertising provider should increase high-ranked shares by a larger (equal) percentage. 9
For example, assume that there are two advertisers, α1 > α2 > 0 and α1 < 2α2 (to rule out the winner-take-all case). We can easily verify that
To compare share structures with different amounts of total resources, we can calculate relative share sizes by dividing absolute share sizes by the total resources available. P5 effectively posits that as the total resources increase, the optimal share structure with relative share sizes becomes flatter (becomes steeper or remains constant) if advertisers’ price elasticity decreases (increases or remains constant) in the amount of resources allocated to them. Thus, P5 reveals a connection between the steepness of optimal share structures with relative share sizes and how advertisers’ price elasticity changes with resources allocated to them. Increasing the total resources does not change relative share sizes per se. Rather, it changes relative share sizes only when an increase in the total resources alters advertisers’ price elasticity on the margin.
The Case with Minimum Bids
In this section, we extend our model to the case in which minimum bids are imposed. Online advertising providers often use minimum bids in their advertising auctions. For example, Google currently requires that advertisers bid at least $.25 per thousand impressions in its contextual advertising. Yahoo requires a minimum bid of $.10 for all keywords. Some researchers have studied the role of minimum bids in traditional online auction settings (Kamins, Dreze, and Folkes 2004; Suter and Hardesty 2005). This literature shows that minimum bids can increase sellers’ earnings in online consumer-to-consumer auctions (Suter and Hardesty 2005). Here, we focus on how the introduction of minimum bids affects the optimal share structure.
Imposing a minimum bid prevents some low-type advertisers from participating in the auction because bidding higher than the minimum bid would result in negative payoffs for them. We assume that the effect of a minimum bid is such that any advertiser of a type higher than v0 participates in the auctions and any advertiser of a type lower than v0 does not. We call v0 the marginal type.
Using a similar approach outlined in the Web Appendix (http://www.marketingpower.com/jmjuly09) for deriving expected revenue without minimum bids, we can derive the expected revenue under a given marginal type v0 as follows:

We assume that the advertising provider chooses the optimal marginal type
We also assume that
Under reasonable conditions,
We redefine the return factors as follows:

Different from the no-minimum-bid case, the return factors are now functions of the marginal type. We show in the Web Appendix (in Lemma Wl) that Lemma lb carries over to this case; that is, under the MHR condition, the return factors of different shares decrease (see http://www.marketingpower.com/jmjuly09). This is because excluding low-type advertisers reinforces the advantages of high-ranked shares in generating returns. It follows that Plb carries over as well; that is, when the MHR condition holds and the valuation is linear, the advertising provider should use a greedy allocation among shares.
Given any marginal type, the characterizations of optimal share structures in P2 and Corollary 1 continue to hold. So do the comparative-static results on the concavity of valuation function (P3) and on total resources (P5). In addition, the results on scaling and shifting of type distribution in P4 continue to hold as long as the marginal type is adjusted accordingly.
We now examine the impact of minimum bids on optimal share structures. Properly set minimum bids exclude low-type advertisers with negative marginal revenues and thus improve the return factors of all shares. However, the improvements may differ across shares. Therefore, the optimal share structure may change as a result of imposing minimum bids, as the following proposition suggests:
If the MHR condition holds, the optimal share structure under the optimal minimum bid is flatter than under no minimum bid.
Intuitively, minimum bids exclude low-type advertisers who have negative marginal revenues and thus increase the total expected revenue. If permitted in the auction, these advertisers would more likely win low-ranked shares than high-ranked ones. Therefore, excluding them results in relatively larger improvements on the marginal returns of low-ranked shares than on those of high-ranked ones. This implies that resources should be shifted toward low-ranked shares, and the optimal share structure should be flatter.
Conclusion
Auctions are crucial to the functioning of keyword advertising in which millions of different keywords are sold each day. It is imperative to study how to best auction keywords because keyword advertising also holds great promise for other advertising markets that hope to replicate its success. Existing research on keyword auctions has largely focused on the ranking of advertisers (e.g., Weber and Zheng 2007) and payment rules (e.g., Edelman, Ostrovsky, and Schwarz 2007), taking objects to be auctioned as given. Little research has been conducted on the “resource-package” issue that precedes auctions—that is, how to package and recombine different advertising resources for each keyword phrase before auctioning them to advertisers. We argue that the resource-packaging issue has increasing importance as more resources become available for auctioning. In this article, we take a first step to study a share structure problem—namely, of the total available resources, how large a share should be set aside for the highest bidder, for the second-highest bidder, and so on.
The share structure issue is important for advertising networks and publishers. As we show, the optimal share structures change with multiple underlying demand and supply factors. Advertising providers may find it necessary to actively adjust their share structures for several reasons. First, the supply of advertising resources fluctuates as publishers join and leave advertising networks and as publishers’ draw of online users rises and falls. Second, the demand for advertising on each keyword phrase shifts constantly in response to changes in underlying market trends. The importance of the share structure issue will grow as the demand for and supply of keyword advertising grow stronger and become more dynamic.
We study the optimal share structure problem in a framework in which an advertising provider offers the total advertising resources in as many as n shares to n advertisers. The advertising provider allocates all shares simultaneously using a unit price auction. Advertisers’ valuation for a share is affected both by their private valuation factor (or their “type”) and by the size of the share. Our model allows advertisers’ valuation factor to follow a general distribution and advertisers’ valuation to depend on the size of the share by a general increasing function. Using this framework, we characterize the optimal share structures and investigate how they change with several underlying factors. Although we examine this issue from the advertising providers’ revenue-maximization perspective, we believe that the share structure issue also has important implications for advertisers and the overall efficiency of the keyword advertising market.
Although we use keyword auctions as our study setting, our findings may have implications for other areas. This is because keyword-auction-like mechanisms may be used for other divisible goods with capacity constraints, such as network bandwidth, grid-computing power, television broadcasting rights, and digital billboard advertising. For example, Google filed a proposal on May 21, 2007, with the Federal Communications Commission calling on using keyword-auction-like mechanisms to allocate radio spectrum to increase market efficiency.
Implications for Managers
Our characterization of the optimal share structure and of the impact of the underlying demand and supply factors generates several insights for advertising providers. First, emerging from our analysis is a key determinant of optimal share structures: advertisers’ price elasticity. We define advertisers’ price elasticity as the percentage change in advertisers’ demand for exposure resulting from a 1% change in the price per unit of exposure. When the price elasticity of advertisers’ demand for exposure is high, advertising providers should use a steep share structure. In other words, advertising providers should allocate most of their resources to the top bidders. When the price elasticity is low, advertising providers should use a relatively flat share structure. This means that they should spread the total advertising resources relatively evenly among advertisers of different ranks. Advertising providers can estimate advertisers’ price elasticities by examining the accumulated data on advertisers’ willingness to pay and their purchase volumes or by conducting market research with a sample of advertisers.
Second, another important determinant is the return factors of different shares. Return factors reflect the difference in return for the same amount of resources allocated to different shares. When the return factor of a high-ranked share is strictly higher than that of a lower-ranked share, which holds true under uniform, normal, or exponential distributions, the optimal share structure should strictly decrease; that is, a higher-ranked share should be strictly greater than a lower-ranked share. Otherwise, the optimal share structures may have plateaus; that is, advertising providers may allocate equal amounts for two or more shares. Whether return factors decrease in shares is determined mainly by the distribution of advertisers’ valuation.
Because the distribution of valuation determines return factors, changes in the underlying valuation distribution may lead to different optimal share structures. The rule of thumb is that the ratio of return factors rather than absolute values determines the optimal share structure. For example, when the valuation distribution is scaled by a common factor, all return factors are also scaled by the same factor, and the optimal share structure remains the same. When the valuation distribution shifts (to the right) by a common factor, return factors for low-ranked shares increase by a higher percentage than those for high-ranked shares, and the optimal share structure should be flatter. Therefore, it is not the absolute difference in advertisers’ valuation for keywords but rather the relative difference that affects the optimal share structures. Advertising providers can estimate return factors for different ranks by conducting controlled experiments.
Third, advertising providers should react to changes in total advertising resources according to advertisers’ price elasticity. Specifically, advertising providers should allocate proportionally fewer resources to high-ranked shares when advertisers’ price elasticity decreases with the total exposure they receive, and advertising providers should allocate proportionally more to high-ranked shares when advertisers’ price elasticity increases. Whether advertisers have increasing (constant or decreasing) price elasticity may depend on whether their underlying businesses have an economy of scale (constant return or diseconomy of scale). For example, businesses that do not scale well because of their capacity constraints (i.e., suffer a diseconomy of scale) tend to display decreasing price elasticity.
Finally, advertising providers should coordinate between the minimum bids and the optimal share structures. In general, advertising providers should use flatter share structures when they use minimum bids. If advertising providers decide to raise minimum bids, in general they should offer flatter structures at the same time.
Implications for Further Research
This research highlights the issue of optimal share structure as an important strategic dimension in keyword auctions. Our research serves as a starting point for marketers to understand novel keyword auctions. Further research is needed in several directions. First, it would be worthwhile to test our theoretical predictions empirically on the optimal share structures for different settings. One way to test our results directly would be to conduct laboratory or field experiments. Another way would be to estimate the underlying supply and demand factors of existing keyword auctions and use estimated parameters to project the gain in auction revenues if optimal share structures were used.
Second, the problem of how resources should be packaged for auctioning should be examined in broader and more complex settings. As a first study of share structures, we have kept our research model simple, focusing on factors that are most relevant to the share structure problem. For example, we assumed that advertisers’ valuation for exposures can be captured by a single valuation factor. Thus, in our model, advertisers are “vertically” differentiated. Cases may also exist in which advertisers are “horizontally differentiated” (i.e., some advertisers may prefer one resource, while others prefer another). It would be worthwhile to examine how advertising providers should package their resources in such a horizontally differentiated setting.
Finally, why the current keyword auction format has become the mechanism of choice is also a question for further research. In traditional divisible goods auctions, such as for electricity, pollution permits, and treasury notes (Wang and Zender 2002; Wilson 1979), auctioneers ask each buyer to report both a price and a desired share size (quantity). Auctioneers subsequently solve the market-clearance problem by using buyers’ price/share quotes, whereas in keyword auctions, auctioneers “prepackage” resources into shares, and advertisers simply bid on prices only. Several reasons may be in favor of such a simple mechanism. Keeping the auction mechanism easy to understand and easy to participate in is essential to facilitate participation of tens of thousands of advertisers, many of which are small advertisers on the “long tail” and may otherwise be excluded from online advertising. Reaching the long tail of the advertising market is a key advantage of online advertising providers. Moreover, winner determination in share auctions is straightforward, making it suitable for real-time environments. However, it remains interesting to compare the current auction format with potential alternatives, such as the conventional discriminatory-price and uniform-price auctions used for treasury bonds (Wang and Zender 2002; Wilson 1979).
Footnotes
Proof of Propositions
References
Supplementary Material
Please find the following supplemental material available below.
For Open Access articles published under a Creative Commons License, all supplemental material carries the same license as the article it is associated with.
For non-Open Access articles published, all supplemental material carries a non-exclusive license, and permission requests for re-use of supplemental material or any part of supplemental material shall be sent directly to the copyright owner as specified in the copyright notice associated with the article.