
Abstract
Network effects and standards competition introduce significant market uncertainty, creating a substantial challenge to the success of innovating firms. Although the literature has highlighted the importance of establishing a large installed-user base (the number of users adopting the same product) in such markets, the authors draw attention to a different, but potentially important, market force: the supporting-firm base, which they define as the number of firms supporting the same technological standard. They test their proposed hypotheses using data from two markets: the floppy disk drive and personal digital assistant markets. Their results show that (1) consumer product valuation is positively affected not only by the installed-user base but also by the supporting-firm base, (2) the two positive effects interact with each other and the nature of the interaction changes over the evolution of the market (i.e., they strengthen each other's impact in the early stage but weaken each other's impact in the late stage of the product life cycle), and (3) not all supporting firms are equally valuable to the innovator—specifically, consumers are affected more by firms exclusively supporting a single standard than by firms supporting multiple standards and by incumbents than by new entrants.
Keywords
Facing such a high level of adoption uncertainty, consumers tend to delay their purchase and “wait and see” (Farrell and Saloner 1986), a tendency that imposes high start-up risks for innovators. To enhance the innovation success in such markets, scholars and marketers have devoted increasing attention to the “installed-user-base effect” (i.e., the impact of the number of current adopters on consumers’ product valuation). For example, researchers have launched numerous empirical studies to investigate the installed-user-base effect in different industries, such as HDTVs (Gupta, Jain, and Sawhney 1999), VCRs (Ohashi 2003), video games (Shankar and Bayus 2003), CD players (Basu, Mazumdar, and Raj 2003), and personal digital assistants (PDAs; Nair, Chintagunta, and Dube 2004). Collectively, these studies provide strong evidence for a positive effect of the demand-side support: Consumers are willing to pay more for products with a larger installed-user base. The existence of installed-user-base effects has motivated marketing scholars and practitioners to investigate and apply various marketing strategies that facilitate the development of installed-user base in the presence of network effects, such as product preannouncement (Bayus, Jain, and Rao 2001), dynamic pricing (Xie and Sirbu 1995), free licensing and product line extension (Sun, Xie, and Cao 2004), and comparative advertising (Chakravarti and Xie 2006).
Different from the existing empirical studies of network effects, which have largely focused on demand-side support (i.e., the installed-user-base effect), this study brings attention to a less explored force that may also significantly affect consumers’ product valuation: the supply-side support. Specifically, we define the “supporting-firm base” as the number of manufacturers supporting the same underlying technology (i.e., they produce hardware products based on an innovator's technology). For example, in the VCR market, the supporting-firm base for the Betamax standard includes all manufacturers that produced VCRs based on Sony's Betamax standard. 1
Note that our research focuses on supply-side support from manufacturers in the same industry. Our definition of the supporting-firm base does not include the number of makers of compatible complementary products (e.g., software producers for personal computers). It differs from the value net discussed in Srinivasan, Lilien, and Rangaswamy (2006), in which the value net refers to the suppliers and producers of complementary products that deliver utility either directly or indirectly to the customer.
We focus our attention on the impact of the supporting-firm base on consumers’ product valuation, and our empirical study is designed to answer the following questions. First, will consumers be willing to pay more for a product with a larger supporting-firm base? A large number of supporting firms implies that more firms will manufacture and sell the underlying product. Intuitively, we would expect that increasing the number of supporting firms could increase the sales of products that are based on the innovator's technology: The greater the number of firms that produce the product, the higher is the product availability and the lower is the price. However, it is not clear whether consumers would actually be willing to pay a higher price as more firms join in the innovator's camp. The ability to increase the value of a product to consumers and to stimulate demand for innovation is important to the success of any innovating firm and is particularly crucial to firms facing network effects and standards competition. Thus, answers to our first question are of significance to both research and practitioners.
Second, if, as we argue here, consumers are positively affected by both the installed-user base and the supporting-firm base, how do the two driving forces interact (e.g., strengthen or weaken each other's effect)? Does the nature of this interaction change across the product life cycle? Understanding the interaction between the installed-user-base effect and the supporting-firm-base effect as well as the dynamic pattern of this interaction will allow the innovator to allocate resources between the forces (i.e., gaining support from demand side and supply side) optimally and dynamically.
Third, are all supporting firms equally influential to consumers? If not, what types of firms have the strongest positive impact on consumers? Understanding which types of supporting firms (e.g., incumbents vs. newcomers) have the strongest impact on consumers will enable the innovator to target the most influential supporters and develop a high-impact supporting-firm base.
We answer the proposed questions by first developing a set of hypotheses regarding the impact of supporting-firm base on consumers’ product valuation and factors moderating this effect. Following previous literature (Zeithaml 1988), we refer to consumer product valuation as the perceived value of a product to consumers, which is “the consumer's overall assessment of the utility of a product based on perceptions of what is received (e.g., quality, volume, convenience) and what is given (e.g., price, time, efforts)” (Zeithaml 1988, p. 14). We test our theory by empirically investigating two markets: the 3.5-inch floppy disk drive (FDD) and PDA markets. The literature has classified both as markets with network effects (Gupta, Jain, and Sawhney 1999; Nair, Chintagunta, and Dube 2004; Srinivasan, Lilien, and Rangaswamy 2004; Wang, Chen, and Xie 2010), and both experienced intense standards competition.
Our results support the proposed hypotheses and provide several important findings. First, our empirical analysis of both markets demonstrates a direct positive influence of the supporting-firm base on consumers’ product valuation, suggesting that consumers would actually be willing to pay a higher price as more firms join in the innovator's camp. 2 To our knowledge, this is the first empirical evidence of a direct positive impact of supply-side support on consumers. This finding calls for more attention from scholars and marketers to supply-side issues to stimulate demand and overcome the start-up problems in markets with network effects.
Recent marketing literature has illustrated how consumer willingness to pay can be derived using the estimates of consumer utility function (product valuation) based on a choice model (e.g., Jedidi and Jagpal 2009; Jedidi and Zhang 2002). Following this literature, we first propose and test the impacts of supporting-firm base on consumer product valuation and then address the impact of the supporting-firm base on consumers’ willingness to pay (for a detailed discussion, see the “Discussion and Conclusion” section).
Second, we find that the two driving forces in markets with network effects, the installed-user-base effect and the supporting-firm-base effect, strengthen each other's effects (i.e., they have a complementary relationship) when a new technology is first introduced but weaken each other's effects (i.e., they have a substitutive relationship) as the market evolves. The existence of such a contingent interaction effect can be expected to motivate innovating firms to design their demand-side and supply-side strategies jointly and dynamically over the product life cycle.
Finally, our results from the two markets reveal that consumers are affected not only by the size of the supporting-firm base but also by who the supporting firms are. Specifically, firms that exclusively support a new technology influence consumers more than those supporting multiple standards, and incumbents exert more influence than newcomers on consumer product valuation. These findings offer managerial guidance to innovating firms on how to effectively build the most impactful supply-side support.
This study contributes to both the literature on network effects and the literature on strategic alliance. To our knowledge, this is the first study in the literature of network effects to formally define the concept of the supporting-firm base and provide theoretical and empirical evidence supporting (1) a positive impact of the supporting-firm base on consumers’ product valuation and (2) the contingent interaction between the installed-user base and the supporting-firm base. Such new evidence has the potential to stimulate more theoretical and empirical questions regarding the supporting-firm-base effect, an important but less-understood market force in markets with network effects. This study also contributes to the literature on strategic alliance, which, in contrast, has shown various benefits of strategic alliance, such as increasing firms’ financial values and facilitating market expansions, to partnering firms (e.g., Oxley, Sampson, and Silverman 2009; Swaminathan and Moorman 2009). Our research proposes and illustrates a new function of manufacturers’ coalition in markets with network effects: directly increasing the value of an innovation to consumers.
This study offers some useful guidance to marketers. First, our findings underscore the idea that to successfully establish demand for an innovation, marketers need to pay close attention to supply-side issues. This insight is especially important given that, traditionally, marketing activities are more centered on demand-side issues. Second, our results illustrate the benefit of designing the demand-side and supply-side strategies jointly and dynamically. We also offer some specific suggestions for innovating firms in markets with standards competition (e.g., aggressively pursuing support from both demand and supply side at the early stage but focusing on only one, not both, in the late stages of the product life cycle). Finally, our findings identify three specific dimensions that are critical for the innovator wanting to build an impactful supporting-firm base: (1) size—pursuing support from a large number of manufacturers; (2) loyalty degree—building a supporting-firm base with a high percentage of single-standard supporters; and (3) incumbency level—securing strong support from industry incumbents, even if this would be more costly than simply targeting the newcomers.
We organize the rest of this article as follows: We first discuss the theoretical background and then develop our hypotheses. We then introduce our model and present our empirical analyses. Finally, we discuss contributions, managerial implications, and opportunities for further research.
Theoretical Background and Hypotheses Development
Effects of the Supporting-Firm Base on Consumers
We propose that firms adopting an innovator's technology contribute more than simply selling products compatible with its technology (i.e., helping achieve the current market share of its platform). A large number of supporting firms can directly enhance potential consumers’ willingness to pay for the technology because a large number of supporting firms to a new technology can create three aspects of value to consumers: (1) information value, (2) commitment value, and (3) competition value, each of which reduces consumers’ uncertainty about the future success of the underlying technology and thus enhances their perceived product value.
First, the supporting-firm base for a new technology creates information value, which signals industry confidence in that technology and in turn increases consumers’ product valuation. Because of information asymmetry, firms may know more about the (dis)advantages of the underlying technology and its relative market position in winning the standards competition than consumers, whereas the latter may know more about their own preferences than the former. If consumers believe that, in general, firms have more information about the relative advantages of competing technologies than they do, then strong support for a specific technology from manufacturers could signal supply-side confidence in the technology. For example, in the technology strategy literature, Swann (1987, p. 245) suggests that the existence of a good number of firms supporting a technology can serve as an informational externality regarding the status of this technology as a future industry standard. Such a signal can be credible because it is not in firms’ best interest to invest in the technology if there is little chance of surviving a standards war.
Second, a large number of supporting firms for a new technology can create commitment value, which can increase the chance of the technology's survival and success in the standards competition. As we mentioned previously, markets with network effects and standards competition impose significantly high uncertainty to consumers, which reduces their willingness to pay for a new technology (Chakravarti and Xie 2006). As a result, consumers tend to postpone purchases until such market uncertainty is resolved. Furthermore, unlike traditional markets, in markets with network effects, consumers often are required to choose not only a brand but also a technological standard (e.g., Betamax vs. VHS for VCRs, DVD vs. Divx for DVD players, Word vs. WordPerfect for word processing software, Blu-ray vs. HD-DVD for high-definition DVD players). 3 It can be costly to consumers, however, if they select the losing standard. The standards battle that occurred in the early 1980s in the VCR market is an illustrative example (Cusumano, Mylonadis, and Rosenbloom 1992). When Sony, the first mover, finally stopped manufacturing its Betamax machine as a result of the competition between it and the incompatible VHS player made by the later entrant, JVC, videotape manufacturers stopped making tapes for the Betamax machine, and Betamax VCR owners lost the value of their investment. A recent example is the standards battle between DVD and Divx, two technologies that use spinning disks for storing and playing music, videos, and software. The DVD was introduced in May 1997. Within a year, the incompatible Divx also entered the market, and 90,000 machines were sold in the first three months of national availability (Crothers 1999). A strongly contested standards battle ensued between the makers of DVD and Divx for market dominance. In less than two years, DVD prevailed and Divx ceased production. All Divx discs that were unsold at the end of the summer of 1999 were destroyed, and owners of Divx machines lost the value of their investment.
Consistent with Srinivasan, Lilien and Rangaswamy (2006), we refer to the technological standard as the technical specifications for compatibility, adaptability, and connectivity that are required for the proper functioning of products.
Over the past several decades, we have observed many unsuccessful technological standards, including CBS's Color Television, Sony's Betamax, Philip's digital compact cassette, Sony's Minidisk, and IBM's Token Ring for LAN standard. While the cost to consumers who purchase a product that later loses a standards battle can be high, it is extremely difficult to predict the survival chances of the technology when making an adoption decision. Such uncertainty can significantly reduce consumers’ confidence and lower their product valuation. However, consumers’ confidence/product valuation can be boosted if they observe strong support for the technological standard from a large number of firms (Wade 1995) because winning a standards battle is more likely when more firms collectively make efforts to promote and develop the technological standard.
Third, a large number of supporting firms also creates a price-competition effect, which increases the future installed-user base. As we argued previously, one of the most important features in markets with network effects and standards competition is the future installed-user base. In such markets, consumers are concerned not only with how many adopt a certain technology but also with how many will adopt it in the future, so that they can avoid being stranded in a lost technology. Even if surviving a standards war is not a major concern (e.g., in markets without competing standards or with the coexistence of multiple standards targeting different market segments), consumers still face a significantly high level of uncertainty because their adoption value depends on the size of the future user base of the product, which is difficult to predict. For example, the value of a fax machine to early adopters depends on its future market acceptance level; the more fax machines that are sold, the more direct communication partners a fax machine owner can have. Although the standards battle between the Blu-ray and HD-DVD formats in the high-definition DVD player market was recently settled by the exit of the HD-DVD format from the market, there is still significant uncertainty about future market acceptance of Blu-ray technology in face of incoming challengers (e.g., Video on Demand, IPTV, and Internet downloading, which might leapfrog the high-definition standard; Greenstein 2008). Given the interdependence between product value to current buyers and the potential future market penetration level, consumers should incorporate their expectations of the future installed-user base of the new technology into their adoption decisions (Shapiro and Varian 1998). Clearly, it is difficult for individual consumers to predict the future market success of a specific new technology based on their own knowledge and information. However, a large supporting-firm base may indicate greater future market potential because intense price competition will lead to a lower price and thus a higher potential total market adoption.
Several theoretical studies in the economics and marketing literature have shown that, in the presence of network effects, the value of a product to consumers may be affected by the number of firms supporting the same technological standard because of their high expectation of its future network size. For example, Katz and Shapiro (1985) prove that consumers are willing to pay a higher adoption price for a product in a competitive market than in a monopoly market because they expect that the future network will be larger (and thus they will gain a higher total adoption benefit) in a market with competing vendors than in one with a sole vendor. Sun, Xie, and Cao (2004) extend such an analysis to product-line decisions. Their analysis shows that the innovator may achieve a larger future network by free-licensing its technology to “clone” product makers than by extending its own line because the former leads to a competitive market whereas the latter leads to a monopoly market. As a result, consumers form a higher product valuation for the innovator's product under a free-licensing strategy than under a product-line strategy. Economides (1996) analyzes an oligopoly market and proves that a positive relationship exists between the number of imitators and the realized future network size.
In summary, a large supporting-firm base implies both a higher level of industry support for the technology (i.e., the supporting firms are allies) and a high level of price competition within the standard (i.e., the supporting firms are rivals). From the perspective of allies, a larger supporting-firm base enhances the chance for the technology to win a standards battle. From the perspective of rivals, a larger supporting-firm base intensifies price competition and leads to a larger future-user base. Both suggest that, in the presence of network effects, consumers may value a product more when more firms support its technology. Formally,
H1: In the presence of network effects, consumer product valuation is positively related to the size of the supporting-firm base.
Interaction of Supporting-Firm Base and Installed-User Base
The literature on network effects has empirically demonstrated that consumers’ valuation of a new technology is positively affected by the size of the current installed-user base (e.g., Basu, Mazumdar, and Raj 2003; Gupta, Jain, and Sawhney 1999; Nair, Chintagunta, and Dube 2004; Ohashi 2003). If the positive supporting-firm-base effect predicted in H1 exists, consumers in markets with network effects are thus affected by two driving forces: the installed-user base and the supporting-firm base. To successfully introduce new products in such markets, firms must strategically manage these two forces and understand if and how they interact.
Given the unique characteristics of markets with network effects and standards competition, we expect that the installed-user-base effect and the supporting-firms-base effect interact with each other and that the nature of this interaction is not fixed but rather changes as the market evolves. Specifically, we propose a contingent view: The interaction relationship is complementary when the product is first introduced but then becomes substitutive as the market evolves.
A complementary relationship between the supporting-firm base and the installed-user base implies that they will strengthen each other's impact on consumers. Notice that the installed-user base and the supporting-firm base reveal information from different perspectives (i.e., the demand vs. the supply side). Because of information asymmetry, consumers may know more about their own preferences, whereas firms may know more about the (dis)advantages of the underlying technology and its relative market position in winning the standards competition than consumers do. In markets with network effects, success is not possible unless the technology gains support from both the demand and supply sides, because neither alone can create a large future network. The failure of the HD-DVD is an example in which the technology failed to gain support from consumers even though it had strong support from industry (approximately 133 firms supported its standards, including Toshiba, Microsoft, Intel, HP, NEC, Studio Canal, and Universal, among others). The failure of Sony's Betamax is an example in which the technology failed to gain support from industry, though it had generated a dominant market share after four years on the market. These examples suggest that the supporting-firm-base effect and the installed-user-base effect may be dependent on each other and may strengthen each other's impact.
Such a complementary relationship between the installed-user base and the supporting-firm base is likely to occur at the early stage of new product introduction. According to the accessibility–diagnosticity model (e.g., Feldman and Lynch 1988), whether consumers will use a piece of accessible information for their decision making depends on the diagnosticity of the information. When a new product is introduced, little information exists about the market reaction to the innovation from either the demand or the supply side. The size of the initial installed-user base is more likely to reflect consumers’ preferences independent of firms’ preferences, and the size of the initial supporting-firm base is more likely to reflect the preferences of the supply side independent of consumers’ preferences. This suggests that both pieces of information have a high level of diagnosticity in the introductory stage of the product life cycle. Moreover, support from one side is likely to have a stronger impact on consumers’ confidence when there is also strong support from the other side (i.e., they can enhance each other's diagnosticity), especially in the introductory stages, when consumers face overwhelming uncertainty and little other information is available. This suggests a complementary relationship between the installed-user base and the supporting-firm base in the stage of product introduction.
As the market evolves, the complementary relationship between the two market forces may become weaker as consumers become more confident about the signals they receive from either side (demand-side or supply-side support). Thus, they will value the product more when observing either a larger user base or a larger firm base, not necessarily both. This implies that as the market grows, the installed-user-base effect and the supporting-firm-base effect become less complementary.
Finally, as the market further develops, this relationship may become substitutive. A substitutive relationship is possible because both the installed-user base and the supporting-firm base serve the same function: reducing consumers’ uncertainty about the future success of the technology. A large current installed-user base increases potential buyers’ expectation of a large future installed-base because it reduces their uncertainty about market acceptance of the technology. In contrast, a large supporting-firm base also increases potential buyers’ expectation for a large future installed-user base because it signals manufacturers’ confidence in the technology and indicates a high likelihood of success for the technology in a standards war. Because both the installed-user base and the supporting-firm base increase consumers’ confidence about future success, they can have a substitutive relationship such that each will be more (less) influential when the other is small (large). Such a substitutability between the installed-user base and the supporting-firm base is more likely to arise in the later stage of the product life cycle because the firm-base may affect consumers’ product adoption decision and the user base may affect firms’ technology adoption decision. Over time, the information revealed from one source will also reflect the information from the other source. As a result, the two types of information become increasingly more substitutable. Based on the preceding discussion, we formally hypothesize the following:
H2: In the presence of network effects, there exists an interaction effect between the supporting-firm base and the installed-user base, and the nature of such interaction changes as the market evolves: Specifically, (a) the two driving forces are complementary in the product introductory stage, such that each has a stronger impact on consumers’ product valuation when the other is larger; (b) such a complementary relationship becomes weaker as the market evolves; and (c) the two driving forces are substitutive in the later stages of the product life cycle, such that each has a weaker impact on consumers’ product valuation when the other is larger.
Incumbents versus New Entrants
Previously, we argued that a supporting-firm base can create both information value and commitment value, which increase consumers’ valuation of a new technology. Compared with new entrants in the supporting-firm base, we expect that incumbents create higher information and commitment values.
First, when adopting a new technology, it is often more difficult for incumbents to make the adoption decision than for new entrants. This is because incumbents often face higher risks in cannibalizing existing products and their employees often face more challenges in transferring technological know-how from the existing product to the new one (Mitchell 1989). Compared with firms new to the industry, incumbents need to be more confident about the potential of the technology (e.g., there is a sufficient chance to offset lost sales from the existing product and attract new growth opportunity) before deciding to support the new standard. This implies that support for the new technology from incumbents is a stronger and more credible indication of supply-side confidence than that from new entrants. As a result, the former should have a greater impact on consumers’ product valuation than the latter.
Second, the literature on organizational behavior has shown that incumbents tend to outperform new entrants in their long-term market share, and the former have survival advantages due to the specialized assets that they possess relative to the latter (e.g., Mitchell 1991). For example, when a new technology is introduced, specialized assets will be required in areas such as manufacturing, distribution, after-sales service, and complementary product development (Mitchell 1991). Consequently, incumbents can take advantage of their specialized assets to increase their potential for success when commercializing the new technology. Incumbents’ advantages in survival and performance imply that their support creates a higher commitment value than that of new entrants. Formally,
H3: In the presence of network effects, consumer valuation of a product is positively related to the percentage of incumbents among the total number of its supporting firms.
Single-Standard Supporters versus Multiple-Standard Supporters
In markets with network effects, a new technology often faces intense competition from rival standards (e.g., at the time of introduction, the Blu-ray DVD technology was facing competition from traditional DVD and HD-DVD technologies). The high uncertainty involved in standards competition may motivate an imitating firm to support multiple competing standards simultaneously to minimize its own risk. Whereas investing in multiple standards provides supporting firms an opportunity to switch when the standards competition has been decided, investing in multiple standards conveys confusing signals to consumers about which technology may have a better chance to win a standards battle. The imitating firms will support a single technology only if the firm is sufficiently confident about its potential success. Thus, supporting multiple standards creates a lower information value to consumers than supporting a single standard.
Furthermore, because single-standard supporters bear much higher risks than multiple-standard supporters, it is more credible that the former will fully devote their marketing efforts to promote the technology they support. According to the signaling literature, the credibility of a signal depends on the commitment firms make and whether the commitment incurs irreversible costs (Heil and Robertson 1991). The irreversible and genuine investment made by single-standard supporting firms signals a more credible commitment to consumers, which in turn increases the commitment value to the consumer. Therefore, the “loyalty level” of the supporting-firm base (i.e., the percentage of firms exclusively supporting a new technology among all supporting firms) can serve as an indicator of overall confidence from the supply side regarding the new technology. Accordingly, consumers may increase their product valuation when an increasing number of firms exclusively support the underlying technology. Formally,
H4: In the presence of network effects and standards competition, consumer valuation for a product is positively related to the percentage of single-standard supporters among the total number of supporting firms.
Model
The literature on network effects has tested the impact of an installed-user base on demand (consumer utility) using a choice model (e.g., Nair, Chintagunta, and Dube 2004; Ohashi 2003). Discrete-choice models are a common, tractable, and parsimonious method for obtaining the desired structure on demand in econometrics (Berry 1994). Compared with the traditional regression model, a choice model for product demand allows the researcher to directly model consumer utility (i.e., consumer product valuation) and can apply to both aggregate and individual demand data. In this study, we adopt the same modeling approach but extend the demand model by incorporating other variables related to our core concept, the supporting-firm-base effect.
Specifically, we test and compare two models:
Model 1 (the benchmark model) follows the literature to model consumer utility for a product as a function of the product attributes, price, and installed-user base:
Model 2 (the proposed model) extends Model 1 by adding additional variables, including the supporting-firm base, the interaction terms between the installed-user base and the supporting-firm base, and the percentages of incumbents and single-standard supporters:

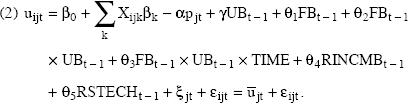
In both models, uijt is the utility of consumer i for product j at time t, Xijt is the kth attribute for product j at time t, pjt is price for product j at time t, and UBt-1 is the cumulative sales at time t - 1 (i.e., a measurement of the consumer installed base). The term ξjt captures the unobserved characteristic for product j at time t, and εijt captures the unobserved characteristic across product j and consumer i at time t, where εijt is assumed to follow a double exponential distribution independent and identical across products and consumers (McFadden 1986). Model 2 has five additional variables: FBt-1 denotes the number of firms supporting the innovator's technology at time t - 1 (i.e., a measurement of the supporting-firm base), FBt-1 × UBt-1 and FBt-1 × UBt-1 × TIME denote the interaction between the installed-user base and the supporting-firm base and the interaction over time, RINCMBt-1 denotes the percentage of incumbent firms in the supporting-firm base, and RSTECHt-1 denotes the percentage of firms supporting only the innovator's technology standard in the supporting-firm base.
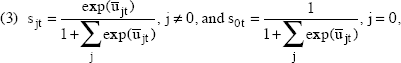
We allow consumers to have the option of purchasing an outside product j = 0 (e.g., an option of no purchase) and normalize the utility of the outside products to 0 across time. Following McFadden (1974), the market share for product j at time t is given by

In the following section, we first estimate Equation 4 using data from the 3.5-inch FDD market. With the estimated Equation 4, we can write the estimated utility function (Equation 2) and test hypothesis H1–H4. Then, we validate our key findings using data from the PDA market.
Empirical Analysis
The 3.5-Inch FDD Market
“A floppy disk is a data storage device that comprises a circular piece of thin, flexible magnetic medium encased in a square or rectangular plastic wallet” (Wikipedia 2011). In the 1980s and 1990s, floppy disks were ubiquitously used to distribute software, transfer data between computers, and create small backups. With the increasing popularity of personal computers in the 1980s, small size and ease of carrying and displaying were becoming the major concerns of computer manufacturers and, thus, of disk drive manufacturers. Before Sony's introduction of the 3.5-inch FDD in 1981, there were two main FDDs: (1) 8-inch disk drives, which were introduced in 1967 by IBM and were mainly used in mainframe computers and minicomputers, and (2) the 5.25-inch disk drives, which were introduced by Shugart in 1976 and were mainly used in mini- and microcomputers.
Sony used a single-crystal ferrite head in its 3.5-inch FDD instead of the polycrystal ferrite head used in the 8-inch and 5.25-inch disk drives. The single-crystal ferrite head is lighter, more stable, and more reliable than the polycrystal ferrite head. With this stable and reliable read/write head, Sony was able to put the same number of tracks a 5.25-inch disk (80) could contain on a much smaller 3.5-inch disk and still maintain equal or even greater reliability than with the 5.25-inch and 8-inch disk drives (see Valigra 1981). As a result, disk density increased from 48 to 135 tracks per inch, while disk size greatly decreased.
Along with the introduction of Sony's 3.5-inch disk drive, many other micro–floppy disks contended for the micro-FDD market standard, two of which—the 3-inch and 3.25-inch drives—were major competitors to the 3.5-inch FDD. In addition, IBM, as a FDD industry incumbent, was also expected to introduce a 4-inch disk drive on an unknown schedule. These FDDs with different sizes were incompatible because disks could only be loaded into the appropriately sized drive. With these different sizes of FDDs competing in the market, there was considerable confusion as to which size the FDD industry would eventually adopt.
To build its technology as the industry standard, as reported in Mini Micro System (Valigra 1981) and Disk Trend Report (Porter 1983), Sony was willing to license its technology to U.S. manufacturers. On January 11, 1983, the New York Times also reported that “the Sony Corporation announced in Tokyo that it and 12 other manufacturers of the FDD in Japan and the United States had agreement to support a mutually compatible format for 3.5 inch floppy disks they market or will market in the near future.” As a result, as many as 27 other manufacturers adopted Sony's technology and produced 3.5-inch FDDs in the same market. Five years later, Sony's 3.5-inch disk drive eventually became the industry standard (for annual sales of 3.5-inch, 5.25-inch, and other competing micro-FDDs [2-inch,2.5-inch,3-inch, and 3.25-inch], see Figure 1).

Annual Sales of 3.5-Inch and Other Competing FDD
Data
We collected data from the 3.5-inch FDD markets to examine the proposed supporting-firm-base effects. The FDD industry was subject to strong network effects because different types of drives in this market were not interchangeable (i.e., files could not be shared), and the value of a given type of disk drive depended on the number of people who adopted this drive. Data were collected from Disk Trend Report, 4 a leading annual market research publication in the disk drive industry. Disk Trend Report is considered a highly reliable and complete source for the disk drive industry data (Christensen, Suarez, and Utterback 1998; Lerner 1997).
We thank James Porter for his generous offer of the series of Disk Trend Report.
We collected a total of 170 observations of 3.5-inch FDD firms from 1983 to 1998. Variables used in the benchmark model (Model 1) are price; installed-user base; and product attributes, such as disk density (Den), track-to-track time (TT), and a dummy variable, DSony. Additional variables that are relevant to our hypotheses and incorporated in the proposed model (Model 2) are supporting-firm base, the interaction between the installed-user base and the supporting-firm base, and the percentages of incumbents and single-standard supporters. We describe the variable measurements in the following subsections.
Installed-user base and supporting-firm base
Following the literature on network effects (e.g., Brynjolfsson and Kemerer 1996), we measured the installed-user base for the 3.5-inch FDD technology as the cumulative sales of 3.5-inch FDDs in the previous time period. We measure the supporting-firm base for the 3.5-inch FDD technology using the total number of 3.5-inch FDD firms in the previous period. The number of firms that produced 3.5-inch FDDs varies over time from a minimum of 5 firms to a maximum of 29 firms.
Percentage of incumbents
Following the literature, we defined a firm as incumbent if it also produced a product that belonged to the previous generation (e.g., Mitchell 1991; Mitchell and Singh 1993; Srinivasan, Lilien, and Rangaswamy 2004). In our data set, the supporting firms of 3.5-inch FDD manufacturers are the incumbents if they also produced 5.25-inch FDDs. We then measured the percentage of incumbents by the ratio of the number of incumbents to the total number of firms that supported 3.5-inch FDDs.
Percentage of single standard supporting firms
During the time period when the 3.5-inch FDD technology was introduced, there were competing standards from the previous generation, such as the 5.25-inch FDD, invented by Shugart Associates in 1976 (Srinivasan, Lilien, and Rangaswamy 2004), and from the same microfloppy generation such as 2-inch, 2.5-inch, 3-inch, and 3.25-inch FDDs (Disk Trend Report 1985). Thus, we measured the percentage of single-standard supporting firms (RSTECH) by the ratio of the number of firms supporting only the 3.5-inch FDD to the total number of supporting firms (that might support either only the 3.5-inch FDD or both the 3.5-inch FDD and other standards).
Other variables
We used the measurements provided in Disk Trend Report for product attribute variables. For example, disk density is measured as number of disk tracks per inch, and the track-to-track time is measured as milli-seconds spent from one track to another. We used the average price of each FDD manufacturer's product in our estimation. The average price is derived as the revenue (in dollars) divided by sales volume. To capture the dynamics of the interaction effect between the demand- and the supply-side support, we used a variable TIME to measure the time interval since the 3.5-inch FDD was first introduced. We also incorporated a dummy variable, DSony, to capture the brand name effects associated with the 3.5-inch FDD innovator, Sony. The dependent variable in the estimation is ln(sjt) - ln(sot)—that is, the natural logarithm of market share for each manufacturer in the 3.5-inch FDD market, subtracting the logarithm of market share for outside options. We measured the market share of each product, including outside options, as the annual sales of each product divided by the FDD market size, where the FDD market size is measured as the total market sales of the whole FDD market, including 8-, 5.25-, 4-, 3.5-, 3.25-, 3-, and 2-inch, as well as high-density, FDDs, in each year from 1976 to 1998, subtracting the realized sales from the previous years.
To increase the interpretability of the parameter estimates, we mean-centered the continuous variables such as the installed-user base and the supporting-firm base (Srinivasan, Lilien, and Rangaswamy 2008). Table 1, Panel A, summarizes the descriptive statistics of these variables.
Variable Definition and Descriptive Statistics

Notes: The installed-user base (measured as cumulative sales) increases with time, but the supporting-firm base (measured as the existing number of supporting firms) follows an inverted U-shaped dynamic, first increasing and then decreasing as a result of market saturation and competition from the next-generation technology (e.g., the high-definition disk drives). This difference suggests that their correlation is likely to be time varying—specifically, positive in the early stage when both increase with time but negative in the late stage when the user base still increases but the firm base decreases. Our FDD data illustrate such a time-varying correlation pattern: .378 (from the 1st to the 5th year), −.83 (from the 6th to the 11th year), and −.939 (from the 12th to the 16th year). Because our PDA data cover only a relatively short later stage of the product life cycle, the correlation between the installed-user base and the supporting-firm base is negative (−.941).
Result
We present our estimation results of the benchmark model and the proposed model (Model 1 vs. Model 2) in Table 2. To ease comparison, we first estimate the two models using the same (least-square) estimation method (see Columns 1 and 2 in Table 2). As we show in Table 2, Model 2 significantly improves the goodness of fit compared with Model 1 (log-likelihood ratio = 34.360, d.f. = 5, p < .01), suggesting that incorporating the impacts of the supporting-firm base significantly improves the goodness of model fit.
Estimation Results Using the 3.5-Inch FDD Data

p < .1.
p < .05.
p < .01.
Notes: Numbers in parentheses are the estimated standard error. Sample size = 170. N.A. = not applicable. The TIME variable is omitted from the Model 2 estimation because of the high multicollinearity between the installed-user base and TIME as both variables naturally increase over time.
Although using the same estimation method allows us to explicitly compare the two models, we need to be aware of a potential endogeneity issue related to the estimation of Model 2. To address this potential issue and examine the robustness of our results, we further reestimate Model 2 using a two-stage estimation procedure, a widely used methodology in econometrics, to count for potential endogeneity (Heckman 1976; Singh and Zhu 2008). Specifically, in the first stage of estimation, we first estimate the supporting-firm-base equation (i.e., the number of supporting firms) as a function of exogenous demand and cost variables and then derive the correction term to correct the potential correlation between the error terms in Equation 2 and in the supporting-firm-base equation. In the second stage of estimation, we then incorporate the correction term in Equation 2. Appendix A reports the technical details for correcting endogeneity in the estimation of Model 2, and the third column of Table 2 presents the estimation results for Model 2 using the two-stage estimation procedure.
Comparing the third and the second column in Table 2 (i.e., estimation of Model 2 with vs. without correcting endogeneity), we find that they have the same qualitative pattern of the parameter estimations, but the significance of the estimation is improved when endogeneity is corrected. Therefore, our subsequent discussion of the results of Model 2 refers to the estimation results reported in the third column.
Now we discuss our key findings. First, as we show in the third column in Table 2, for both Models 1 and 2, the coefficients of price are negative (
Second, H1 proposes a positive impact of supporting-firm base on consumer product valuation. The estimation results of Model 2 (the third column of Table 2) show that the coefficient of firm base is significantly positive (B1 = .238, p < .01), suggesting that consumer valuation increases with the number of firms supporting the 3.5-inch FDD standard. Therefore, H1 is empirically supported.
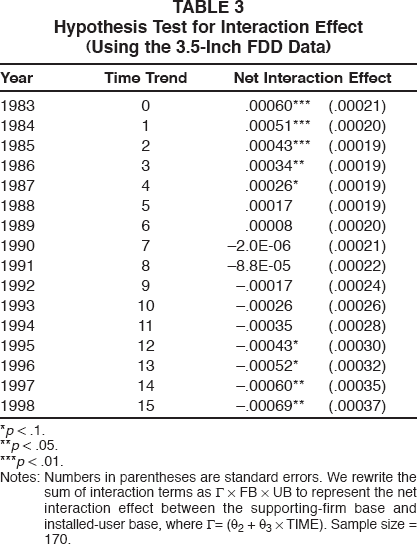
Third, we propose a contingent interaction effect between the supporting-firm base and the installed-user base: They are complementary when the product is first introduced (H2a), such a complementary relationship becomes weaker with time (H2b), and they are substitutive in the later stages of the product life cycle (H2c). First, as we show in Table 2, the coefficient of interaction term, FB × UB, is significantly positive (θ2 = .0006, p < .01), which supports H2a (i.e., a complementary interaction when TIME = 0, the product is first introduced). Second, the coefficient of interaction term, FB × UB × TIME, is significantly negative (θ3 = −8.55E-05, p < .01; see the third column in Table 2), which supports H2b. Finally, we rewrite the sum of interaction terms as Γ × FB × UB, where Γ = (θ2 + θ3 × TIME) and represents the net interaction effect between the supporting-firm base and the installed-user base. We calculate and test the significance of coefficient Γ (see Table 3). As Table 3 shows, the interaction effect between the supporting-firm base and the installed-user base is complementary in the early stages when the 3.5-inch FDD technology was introduced (supporting H2a), then becomes less complementary (supporting H2b), and eventually, turns into a substitutive relationship in the later stages (supporting H2c). Thus, we find that empirical evidence supports all three predictions in H2.
Hypothesis Test for Interaction Effect (Using the 3.5-Inch FDD Data)
p < .1.
p < .05.
p < .01.
Notes: Numbers in parentheses are standard errors. We rewrite the sum of interaction terms as Γ × FB × UB to represent the net interaction effect between the supporting-firm base and installed-user base, where γ = (θ2 + θ3 × TIME). Sample size = 170.
Fourth, H3 proposes a positive impact of the percentage of incumbents in the supporting-firm base. As Table 2 shows, the coefficient of RINCMB is significantly positive (θ4 = 2.383, p < .1), which supports H3. Finally, H4 proposes a positive impact of the percentage of single-standard supporting firms in the supporting-firm base. As Table 2 shows, the coefficient of RSTECH is significantly positive (θ5 = 3.088, p < .01), which supports H4. These two results taken together suggest that (1) consumers are concerned not only about the size of the supporting-firm base but also about the nature and identity of the supporting firms and (2) supporting firms that are loyal to the innovator's technology and are incumbents contribute more to the supporting-firm-base effect than those that are stakeholders in multiple standards and those who are newcomers.
Robustness and validity of results
To examine the robustness and validity of our results, we performed three additional analyses. First, we tested for autocorrelation and heteroskedasticity issues in the second stage estimation of Model 2 to ensure that our estimation is unbiased and efficient. Our results suggest that (1) there is no significant autocorrelation in our data set (the Durbin-Watson statistic = 2.177) and (2) the null hypothesis of homoskedasticity cannot be rejected (Breusch-Pagan Lagrange multiplier statistic = 8.86, d.f. = 11, p > .634); in other words, there is no significant heteroskedasticity in our data set.
Second, we also estimated Model 2 by correcting endogeneity and allowing consumer heterogeneous valuation in the installed-user base, supporting-firm base, and the interaction of the two driving forces. Our results demonstrate that (1) the same conclusions based on parameter estimation still hold when consumer heterogeneity is controlled for and endogeneity is corrected and (2) there is no significant consumer heterogeneity in the installed-user base and supporting-firm base (see the results in Appendix B).
Third, to enhance the generality of our findings, we further extended the analysis to another market, the PDA. Such an extension is especially important because this is a more recent market with strong network effects and ongoing standards competition (Nair, Chintagunta, and Dube 2004). The network effects arise in this industry as the value of a PDA increases with both the number of consumers who have adopted compatible PDAs and the variety of compatible software for those PDAs. The PDA industry also exhibits extensive standards war among several incompatible operating systems since the first PDA was introduced in 1992. For example, during the earliest stage of PDA market development, at least six incompatible PDAs contended for the market standard from 1992 to 1995, such as Apple's Newton, Armstrad's PenPad, Tandy and Casio's Zoomer, Bell South's Simon, Sony's Magic Link, and Motorola's Envoy (Bayus, Jain, and Rao 1997). Since 1996, when the first Palm PDA was launched, until the present, the PDA industry has gradually become dominated by two incompatible operating systems (OSs): Palm OS and Microsoft Windows OS.
We were able to collect monthly data from the PDA market from January 2003 to April 2007, a data set with 6187 observations covering a relatively late stage of the PDA industry (compared with the whole product life time from 1992 to present). Key variables such as installed-user base, supporting-firm base, percentage of incumbents, and single-standard supporters in the supporting-firm base incorporated in Model 2 are defined as those in the 3.5 FDD market. In addition, the availability of software titles is incorporated to directly capture the indirect network effect in the PDA market (for variable definition and descriptive statistics, see Table 1, Panel B). We use a nested logit model to estimate the Model 2 by using PDA data and control possible correlations among products within each standard (for the nested-logit model in detail, see Berry 1994. Because our PDA data cover only a relative short later stage of the product life cycle, we expect that the nature of the interaction between the installed-user base and the supporting-firm base may not change significantly during our data coverage (i.e., the coefficient of the term, FB × UB × TIME, may be insignificant). Thus, we report the estimation results with and without including the moderating effect of time—that is, FB × UB × TIME, in Table 4 (the latter enables us to directly test a possible substitutive interaction effect in the later stage).
Estimation Results Using the PDA Data

p < .05.
p < .01.
Notes: Numbers in parentheses are standard errors. Sample size = 6187.
As we expected, the term of FB × UB × TIME is insignificant when it is included in the model (θ3 = 1.13E-05, p > .01, see Estimation 2 in Table 4), which confirms that the interaction effect remains the same in the period covered by our data. Therefore, in the next section, we mainly discuss the results in Estimation 1 in Table 4. First, we found a significantly positive coefficient for the supporting-firm base (θ1 = .035, p < .01), which supports H1. Furthermore, we found the interaction between the installed-user base and the supporting-firm base is significantly negative (θ2 = −.019, p < .01), suggesting a substitutive interaction effect in the later stage of the PDA market, which partially confirms H2. Finally, we found that the coefficients of the percentages of incumbent firms and those that support a single standard are significantly positive (θ4 = .497, p < .01, and θ5 = 2.068, p < .01). Overall, these results are consistent with our findings based on the 3.5-inch FDD data and provide additional support for our proposed theory.
Discussion and Conclusion
This study investigates how the number of firms supporting the same technology may directly affect consumers in markets with network effects and standards competition. Specifically, it conceptualizes and tests (1) the relationship between consumers’ product valuation and the supporting-firm base, (2) the potential interactions between the installed-user base and the supporting-firm base, and (3) the types of firms that most influence consumers. Our empirical results provide evidence to support our proposed theory.
Research Contributions
First, whereas a long stream of literature on network effects has focused on the impact of an installed-user base, this study draws attention to an important but underexplored factor: the supporting-firm base. Our investigation takes a first step toward providing empirical evidence to show that, when facing network effects, the value of a product to consumers is not only affected by the number of current users, as suggested by the literature, but is also influenced by the number of the firms supporting the technology. This finding elucidates the full value that a large supporting-firm base provides in such markets; that is, it not only helps to enlarge the market share of the technology by producing/selling compatible products but also directly affects consumers’ product valuation.
Second, our conceptual development and empirical investigation reveal that the impact of the supporting-firm base is multidimensional, such that consumer valuation is affected by three dimensions: (1) its size, (2) its loyalty level (i.e., the percentage of firms that support only one standard), and (3) its incumbency level (i.e., the percentage of firms that were operating in the industry before the introduction of the new technology). These findings further advance theoretical understanding of the supporting-firm-base effect (i.e., not only the size but also the composition of the supporting-firm base are important to consumers). Specifically, consumers value the support of loyal firms and incumbent firms more than nonloyal firms and newcomers. These insights can help firms allocate their resources to build the most effective supporting-firm base.
Third, we find empirical evidence to show that the interaction effect between the installed-user base and the supporting-firm base varies across the product life cycle: The two driving forces strengthen each other's impact in the early stages when a new technology is introduced, but such a complementary relationship becomes weaker with time and eventually turns into a substitutive relationship in the later stage of the product life cycle. This finding integrates the impact of market forces from both the demand and supply sides and provides a more complete understanding as to how the two important driving forces interactively affect consumers who face high market uncertainty.
Finally, our study also contributes to the strategic alliance literature. Whereas extant studies focus on how partner firms benefit from strategic alliances, we show that an innovating firm's ability to establish strategic alliances also benefits consumers in markets with network effects. Furthermore, the interaction effects between the installed-user base and the supporting-firm base identified in this research adds to the literature on strategic alliance by demonstrating that the effectiveness of a strategic alliance can be influenced by factors on the demand side. Specifically, we show that, in markets with network effects and standards competition, a large installed-user base can strengthen or weaken the impact of a strategic alliance (i.e., the supporting-firm base) on future consumers depending on the stage of the product life cycle. Our empirical findings also advance the literature by revealing the desirable “identity” of strategic alliances in networked markets: firms supporting a single standard and those with incumbent status are more valuable partners.
Managerial Implications
The new insights into the supporting-firm-base effect derived from this research offer useful guidance for managers. To illustrate some specific managerial insights, using the estimated parameters (i.e.,
Overall Effect of Installed-User Base and Supporting-Firm Base (Using 3.5-Inch FDD Data)

p < .05.
p < .01.
Notes: Numbers in parentheses are the estimated standard errors. We estimated the coefficient of the overall installed-user-base effect as
Understanding the full value of supporting firms
An innovating firm should recognize that firms adopting its technology contribute more than simply selling products compatible with its technology (i.e., enlarging the market share of its platform). Recent marketing literature suggests that consumer willingness to pay can be defined as “the price at which the value to a consumer is indifferent between buying and not buying a product” (Jedidi and Jagpal 2009, p. 38) and that consumer willingness to pay can be derived using the estimates of consumer utility function based on a choice model (Jedidi and Jagpal 2009; Jedidi and Zhang 2002). This implies that consumers are willing to pay more for a product with a larger number of supporting firms. 5 Thus, it is crucial for innovating firms to develop effective strategies to take advantage of this benefit in markets with extremely high survival risk and uncertainty.
Using the estimated parameters based on the 3.5-inch FDD data in Table 2 and the definition of consumer willingness to pay (Jedidi and Jagpal 2009; Jedidi and Zhang 2002), we are able to derive the consumer willingness to pay function, which is the price level that is equal to or less than

Designing the two strategic dimensions jointly and dynamically
While both a large installed-user base and a large supporting-firm base are critical success factors, they are not independent market forces. Rather, they strengthen each other's impact in the early stage of product introduction but weaken each other's impact later (as we show in Table 3, the interaction effect changes from positive to negative). To optimally allocate its resources, the innovator should design and implement the two strategies jointly and strategically rather than treating them as two separate strategic decisions. Specifically, it is more efficient for the innovating firm to invest simultaneously in both the demand and supply sides in the product introductory stage (e.g., directly stimulate demand by offering a low price and directly facilitate industry support by offering technological support to its “clones” or charging low licensing fees), even though doing both at this stage (i.e., before receiving any revenue from the innovation) can be costly. In this very early stage, ignoring either side not only overlooks an important success factor but also reduces the impact of the other. However, it is more efficient to focus on only one market force, but not both, in the late stages of the product life cycle. This is because, as the market evolves, the supports from both the demand and supply sides become substitutive (i.e., they weaken each other's effect).
Increasing investment in the early stage
The overall impact of the installed-user base and that of the supporting-firm base are neither constant across time nor always decreasing with time. Rather, both follow an inverse U-shaped dynamic pattern (see Table 5), first increasing and then decreasing with time. 6 The increasing impact of the supporting-firm base effect in the early stage of product introduction (due to a complementary relationship between the installed-user-base effect and the supporting-firm-base effect) is particularly intriguing. It suggests that although building a growing supporting-firm base can be costly; it is not always optimal for the innovator to gradually reduce its investment in recruiting more firms to adopt its technology. Rather, in the early stage of product introduction, the innovator can benefit by increasing its investment in building its supporting-firm base over time even if it has successfully persuaded an increasing number of firms to joint its camp.
Table 5, based on the parameter estimation results of FDD market (see Table 2), presents the overall impact of the installed-user-base effect,
Targeting the most influential supporters
Not all supporting firms are equally valuable to the innovator. Thus, it is important for the innovator to strategically target the most influential supporters, such as those in operation before introduction of the new technology. Although it may be more costly to persuade incumbent firms than newcomers to support a new incompatible technology, consumers put more weight on the standard choices made by the former than those made by the latter. It is also important for the innovating firm to carefully evaluate the additional value single-standard supporters offer compared with that multiple-standards supporters offer from the consumer's perspective (as shown in our study) when deciding its strategic alliance policy.
Be aware of potential conflict
Firms need to be aware that the two success factors, building a large installed-user base and a large supporting-firm base, can lead to conflicting marketing implications. For example, price competition can have opposite effects on building the former and the latter: Aggressively competing on price attracts more consumers to new products but discourages firms from producing compatible products. Furthermore, although the innovator can strengthen the competitive advantage of its product relative to a clone product by limiting the quality/functionality of the clones through its technology and legal advantage/power, such a great quality differentiation can discourage imitators from entering the market and thus reduce the size of its supporting-firm base. The supporting-firm-base effect discussed here suggests that it may not always be in the innovator's best interest to use its technology or marketing power to maximize quality differentiation (e.g., by limiting the extent to which the imitating firms can use its more advanced technology), even if such differentiation can be achieved cost-free. Firms competing in markets with network effects and standards competition should take these potential conflicts into consideration when designing their marketing strategies.
Limitations and Further Research
Although our study is subject to several limitations, it raises some important and interesting issues that call for further academic and managerial attention. As a first step toward examining the impact of a supporting-firm base in markets with network effects, this study focuses only on the supporting-firm-base effect from the consumer's perspective. It is also important to examine the ways supporting-firm-base effect may affect firms’ marketing strategies. For example, as we discussed previously, intense price competition may help the installed-user base but hurt the supporting-firm base in markets with network effects. It would be interesting to examine how firms should optimally design their pricing strategies when facing such conflicts. It is also important to investigate strategies that effectively facilitate the development of a large supporting-firm base, such as licensing fee structures (e.g., lump-sum vs. loyalty fee, dynamic fee structure) and effective ways to attract loyal alliances. Furthermore, this study illustrates the existence of supporting-firm-base effect using data from two different markets. It would be valuable to examine how the magnitude of the supporting-firm-base effect may be affected by (1) the network effect strength and (2) the direct/indirect network effects through analyzing data from more markets with network effects. Finally, because of a lack of individual-level consumer data, in this study, we examine the supporting-firm-base effects using aggregate data. A fruitful topic for further research is to design behavioral experiments to examine directly how consumers perceive the three possible underlying values (information, commitment and competition).
Footnotes
Two-Stage Estimation Procedure
We used a two-stage estimation procedure to account for the potential endogeneity of the supporting-firm base when we examine its effect on consumer product valuation. Specifically, we first estimate a supporting-firm-base equation and then derive the correction term that will be incorporated in the second-stage estimation of the supporting-firm-base effect. In the following, we first present the model for the supporting-firm-base equation and then the estimation results. Finally, we derive the correction term to incorporate in the second-stage estimation of Model 2.
Robustness of Results
p < .05. p < .01.
Variable
Estimation with Correcting Endogeneity and Controlling Heterogeneity
Price (α)
−.016
*
7.7E-17
Installed-user base (mean:
)
.014
**
2.0E-16
Installed-user base (SD: δγ)
1.0E-18
8.2E-18
Supporting-firm base (mean:
)
.087
**
1.3E-15
Supporting-firm base (SD: δθ1)
1.0E-17
1.9E-16
Firm base × user base (mean:
)
.0003
**
4.9E-18
Firm base × user base (SD: δθ2)
1.0E-19
1.3E-18
Firm base × user base × TIME (mean:
)
−3.8E-05
**
9.3E-19
Firm base × user base × TIME (SD: δθ3)
1.0E-19
5.2E-19
RINCMB (θ4)
2.195
**
3.0E-14
RSTECH (θ5)
2.444
**
3.3E-14
Density (β1)
4.376
**
1.9E-14
Track to track (β2)
.093
**
3.7E-15
DSony (β3)
.651
**
2.3E-15
Error correction
−.209
**
7.6E-15
Log-likelihood value
-1036.163