
Abstract
Despite the claim that satisfaction ratings are linked to repurchase behavior, few attempts can be found that relate satisfaction ratings to actual repurchase behavior. This article fills this void by presenting a conceptual model for relating satisfaction ratings and repurchase behavior. The model is based on the premise that ratings observed in a typical customer satisfaction survey are error-prone measures of the customer's true satisfaction, and they may vary systematically on the basis of consumer characteristics. The authors apply the model to a large-scale study of 100,040 automotive customers. Results show that consumers with different characteristics have different thresholds such that, at the same level of rated satisfaction, repurchase rates are systematically different among different customer groups. The authors also find that the nature and extent of response bias in satisfaction ratings varies by customer characteristics. In one group, the response bias is so high that rated satisfaction is completely uncorrelated to repurchase behavior (r = 0). Furthermore, the authors find that, though nonlinear, the functional form relating rated satisfaction to repurchase intent is different from the one relating it to repurchase behavior. Although the functional form exhibits decreasing returns in the case of repurchase intent, it exhibits monotonically increasing returns in the case of repurchase behavior.
During the past two decades, customer satisfaction management has emerged as a strategic imperative for most firms (Honomichl 1993). In the 1980s, achieving higher satisfaction ratings became a goal in itself (Wall Street Journal 1998). Only during the 1990s was there a widespread realization that satisfaction ratings are a means to strategic ends, such as customer retention, that directly affect profits (Jones and Sasser 1995; Reichheld 1996). As such, many firms allocated resources to examine how satisfaction ratings affect customer retention (Bolton 1998). Such a focus is needed because not only is the cost of retaining an existing customer less than the cost of acquiring a new customer but also existing customers cost less to maintain than newly acquired customers (Reichheld 1996). However, establishing a link between satisfaction ratings and repurchase behavior has not been easy for most firms. Some have even labeled satisfaction measurement a “trap” and argued for curtailing satisfaction measurement efforts (Reichheld 1996). Doing so may be a mistake. Theoretically, satisfaction ratings should be linked to repurchase behavior. Yet this link may be difficult to observe in a commercial satisfaction survey if satisfaction ratings vary because of differences in customer characteristics. As such, managers may erroneously conclude that the relationship between satisfaction and repurchase behavior is nonexistent and direct resources away from managing customer satisfaction. This may leave them competitively disadvantaged as other firms attract and retain customers, leaving an even smaller pool of customers for them.
Customers having different characteristics can introduce variability in the satisfaction–retention relationship in three specific ways:
Satisfaction thresholds: Consumers may have different thresholds or tolerance levels toward repurchase that may not be fully captured in their satisfaction ratings. Because of these differences, customers with the same satisfaction rating but with different characteristics may have different levels of repurchase behavior.
Response bias: Ratings obtained in a survey may not accurately reflect the true (latent) satisfaction level if the nature/extent of response bias differs for people with different characteristics.
Nonlinearity: The functional form linking satisfaction ratings and repurchase behavior, though monotonic, may be nonlinear, and the nonlinearity may vary on the basis of consumer characteristics.
Despite its strategic importance, empirical research linking satisfaction to repurchase behavior has been lacking, especially for durable goods. Several years may elapse between the time customers provide a satisfaction rating and the time of their next purchase. As such, obtaining behavioral repurchase data can be extremely expensive. We report results based on 100,040 automotive customers from whom satisfaction ratings were obtained and whose subsequent purchase behavior was recorded.
We develop and test a model that investigates how differences in customer characteristics affect (1) satisfaction thresholds, (2) response bias, and (3) nonlinearity in the satisfaction–retention relationship. Results show that customers with different characteristics have systematically different thresholds and response biases. As such, the extent to which their satisfaction ratings translate into repurchase behavior varies systematically. We also find that the link between satisfaction and repurchase behavior is highly nonlinear, though the nonlinearity does not vary on the basis of consumer characteristics. Finally, the functional form underlying the satisfaction–behavior link is markedly different from the satisfaction–intention link. This is important for managers and researchers alike, who need to make a choice between repurchase intent and behavior for the dependent variable.
Background and Research Issues
It is well documented that in commercial satisfaction surveys, satisfaction ratings vary on the basis of customer characteristics (see Bryant and Cha 1996; Peterson and Wilson 1992), though the variance explained is typically small (in the range of 10%–15%). For example, Bryant and Cha (1996) analyzed data from the American Customer Satisfaction Index (University of Michigan). In this index, many sources of variability are controlled by the use of consistent scales and interview methodology. Even so, Bryant and Cha found many systematic differences based on customer demographics. However, they could not ascertain the extent to which such differences in ratings translate into repurchase behavior. For example, if satisfaction ratings are 10% higher among women than among men, are women 10% or 30% more likely to repurchase the brand? If a lower satisfaction rating for a group implies a correspondingly lower repurchase behavior, managers may want to target that group to increase satisfaction ratings. If, however, the lower rating is an artifact of response bias or other such factors, managers need not worry.
Note that, though important for commercial studies, issues regarding customer-specific variability in satisfaction ratings might not apply to studies with an academic orientation. Academic studies use relatively homogeneous samples designed to minimize error variance (see Oliver and DeSarbo 1988). Also, academic studies typically use multi-item scales to measure customer satisfaction, 1 thus controlling for response bias (e.g., by combining items with negative and positive connotations) and providing an assessment of measurement error. Finally, the interest in academic studies is to establish relationships between constructs with a high degree of internal validity. By using intention data (which are easier to collect), they strive to maintain high internal validity. Because of different goals, typical commercial satisfaction studies limit themselves to a single-item measure of overall satisfaction. Moreover, they are more interested in repurchase behavior than intent alone.
Note that many firms take attribute-level ratings of satisfaction and performance. These, however, are not used to construct multi-item scales of a global construct but to determine attribute weights (for a discussion, see Mittal, Ross, and Baldasare 1998).
Nonetheless, academic studies have examined variability in satisfaction ratings, though the scope has been limited to the interindustry (see Fornell et al. 1996) and intercategory (Anderson 1994) levels. This work is different because it examines sources of variability for a single category. This is a key distinction, because in most commercial studies, data are collected and analyzed for a single category. Moreover, our work examines measurement issues that, despite their acknowledged importance (Oliver 1997), have not been addressed in previous customer satisfaction research. Next, three such issues are discussed.
Satisfaction Ratings and Differential Thresholds
The translation of average satisfaction ratings into repurchase behavior may vary if consumers have different thresholds or tolerance levels with respect to repurchase. Given the same rating, consumers with lower thresholds may be more likely to repurchase the brand than those with higher thresholds. To some extent, differences in thresholds may be captured in consumer characteristics that are measured in the survey. For example, older consumers may be more loyal to a brand because of their accumulated investments in brand-specific knowledge. Younger consumers, in contrast, are at a stage in their life cycle that requires investments in consumer knowledge. They may be more likely than older customers to search for information and switch brands (Ratchford 1999). Less educated consumers might also be less likely to switch brands because of their low returns to scale in the search for information about new brands (Ratchford 1999). The lower threshold for such customers may be captured in demographics such as age or education.
Thus, systematic differences in thresholds based on consumer characteristics may exist in a satisfaction survey. Two customers could give the same rating, but the customer with a lower threshold is more likely to repurchase the brand. As such, a difference in satisfaction ratings may have a disproportionate impact on repurchase behavior if the ratings do not fully capture differential thresholds.
Satisfaction Ratings and Response Bias
Observed satisfaction ratings are error-prone measures of true (latent) satisfaction. In addition to differences in thresholds, satisfaction ratings are also likely to be afflicted by response bias. Kalwani and Silk (1982) report that 15.5% of the variation in ratings is attributed to response bias. Typically, respondents may give ratings that are either too easy or too harsh compared with their true psychological state (Arndt and Crane 1975; Dwyer 1980). For this type of bias, the observed ratings and true underlying satisfaction will be related as illustrated by the dotted lines in Figure 1 (for details, see Arnold, Feldman, and Purbhoo 1985). In addition, the bias may operate at the edges of the scale but not in the middle part of the scale (Skowronski and Carlston 1989). This is especially true of ceiling or floor effects, when the scale points are insufficient to capture the extremes in the true underlying state of the consumer (Cox 1980).
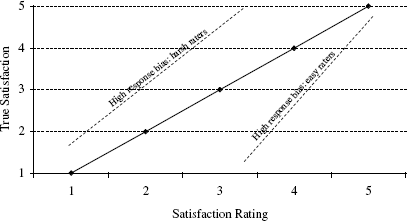
RESPONSE BIAS IN SATISFACTION RATINGS FOR HARSH AND EASY RATERS
In a satisfaction survey, the existence of response bias per se does not pose a problem. Response bias is problematic only if the nature and extent of response bias vary systematically on the basis of consumer characteristics. If ratings provided by different groups are afflicted with exactly the same response bias, then researchers can directly compare or aggregate the ratings to draw conclusions about repurchase behavior. Only when response bias is systematically different is there a need for adjustment.
Theoretical reasons exist to propose variation in the nature and extent of response bias across different consumer groups. Differences in the nature of the response bias can be traced to systematic variability in consumer socialization (see Moschis and Churchill 1978; Zuckerman 1981). Socialization differences may predispose some consumers to engage in yea-saying more than others. Role theory (see Hoffman and Hurst 1990; Lips 1989) also predicts such differences. Lips (1989) demonstrates that systematic differences in roles imposed on children affect the children's evaluations of stimuli and life situations over their entire lives. In several life domains, Lips finds this to be true for male more than female subjects, whites more than minorities, and rich more than poor subjects when they are cast in the role of the aggressor. In the context of satisfaction surveys, such differences are likely to translate into systematic response bias. 2 The extent of response bias is inversely related to the cognitive resources devoted (see Kalwani and Silk, 1982). If consumers with different characteristics vary in the level of involvement with a category, systematic differences in the amount of resources allocated to the survey process and therefore the extent of response bias should be obtained.
It could also affect satisfaction thresholds so that the more aggressive consumers have higher thresholds.
Observed Satisfaction and True Satisfaction: Functional Form
Finally, issues regarding the functional form relating satisfaction ratings to repurchase behavior remain unresolved. In psychology, this issue has received attention in the attitude measurement literature (Fishbein and Ajzen 1975; Zedeck, Kafry, and Jacobs 1976). Fishbein and Ajzen (1975, pp. 365–68) caution that when using single-item, Likert-type scales to measure attitudes, the researcher must first establish the linearity of the traceline underlying the measure used and the attitude in question. Only if the linearity index is high should standard procedures (e.g., linear correlation) be used, or else the analysis may suffer high loss in predictive ability. Fishbein and Ajzen reanalyze empirical evidence that questions the attitude–behavior link (see Wicker 1969) and show that the linearity assumption in many of the analyses is a significant cause of loss in the reported inability of attitudes to predict behavior. Similar issues need to be addressed in the context of satisfaction, where recent evidence shows that the satisfaction function is best conceptualized as nonlinear (Anderson and Sullivan 1993; Mittal, Ross, and Baldasare 1998).
The use of single-item and ordinal scales also introduces the possibility of a nonlinear functional form. Commercial studies typically use rating scales in which each category is anchored numerically (1 through 5), verbally (“completely dissatisfied” through “completely satisfied”), or both (1 = “completely dissatisfied” through 5 = “completely satisfied”). At best, these scales possess ordinal properties, though data collected using such scales typically are treated as interval data for the sake of analysis. Additional factors related to survey design, such as the number of scale points (Cox 1980), could also affect the nature and extent of the nonlinearity. However, a priori we know of no theoretical basis to specify that the nature or extent of nonlinearity should differ on the basis of customer characteristics. Nevertheless, we explore the possibility that such differences exist in the empirical analysis.
Model Development
In this section, we develop a model that captures the relationship among rated satisfaction, true/latent satisfaction, repurchase behavior, and consumer characteristics. Two courses of action are available for developing the model. An ambitious endeavor would be the development of a general theory that would specify a priori how each customer characteristic would affect the threshold or bias in satisfaction ratings. However, the effect of consumer characteristics is most likely industry- and/or category-specific, which makes a priori specification of each effect an almost impossible task. More modest and useful, our research goal is to develop a model to account for these influences in the analysis of a given firm's database. This course is appropriate, as it is at this level that managers must make decisions.
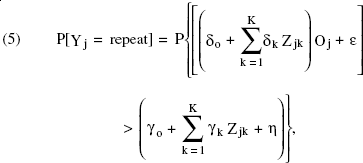
The proposed model uses a latent-variable formulation, assuming that the observed satisfaction ratings are error-prone measures of the consumer's true underlying satisfaction. The probability that a customer j with a latent (true) satisfaction level Sj remains loyal is equal to the probability that his or her true satisfaction is greater than a given threshold:

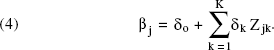
We interpret this threshold as a reservation value—that is, the value associated with the consumer's next best alternative other than repurchasing the brand. This valuation would be based on not only the satisfaction from the brand but also the expected satisfaction from competing brands. In addition, the consumer's ability and willingness to search for competing alternatives may affect these thresholds. It is likely that these factors affecting the threshold will vary with customer characteristics. Therefore, this threshold is regressed on the customer's characteristics (Zjk):

where η is a normally distributed random error with mean zero and standard deviation ση. This threshold defines the true satisfaction level necessary for the consumer to be indifferent between switching or repeating the brand, given that he or she is making a purchase in the product category. The random error η acknowledges that, for a given firm, many factors other than consumer characteristics affect a consumer's valuation of the brand.
The observed satisfaction rating (Oj) is only an indicator of the true underlying satisfaction. Therefore, we regress the latent, unobserved satisfaction on this indicator:

where ε is a normally distributed random error with mean zero and standard deviation σε. This regression takes into account the possibility of both measurement error (ε) and biases due to response styles (βj). Moreover, we assume that the translation of observed satisfaction ratings into true satisfaction (i.e., response style) depends on the respondent's characteristics:
Combining the threshold formulation in Equation 2 with the satisfaction definition in Equations 3 and 4, we have
or

The random error ε represents the errors in measuring satisfaction through a rating scale, and the η accounts for potential misspecification of consumers' brand evaluations. Thus, these two errors are not necessarily correlated. Because we assume that they are normally distributed and independent, Equation 6 shows a binary probit model in which the predictors of repeat purchase (versus switches) are the main effects of the satisfaction rating and demographic variables and the first-order interactions between satisfaction and demographics.
The two parameters of interest from the model are the γ and δ parameters. Substantively, these can be interpreted as follows:
γ captures the overall differences in thresholds for various customer groups. Accordingly, for a given level of rated satisfaction, customers with lower threshold are more likely to repurchase the product, and vice versa.
δ reflects the response bias specific to a customer group, or how the satisfaction rating for that group must be corrected to reflect the respondent's true satisfaction level. In addition to differences in the average satisfaction, consumers may differ in the extent to which such ratings translate into true satisfaction. In the model formulation, this implies that the translation of satisfaction ratings into repurchase behavior varies systematically for different consumer groups because of response bias. The case is illustrated in Figure 2 (Arnold, Feldman, and Purbhoo 1985), where lines X and Y represent differences in thresholds but not response bias (parallel slopes, different intercepts). In comparison, lines X and Z show not only systematically different thresholds (different intercepts) but also different response bias (different slopes).

RESPONSE BIAS AND DIFFERENTIAL THRESHOLDS FOR DIFFERENT CONSUMER GROUPS
Data Description
The data are part of a satisfaction-tracking initiative at a domestic automotive firm that surveys its customers. Customers who have owned a vehicle manufactured by this company are mailed a survey during the 33rd month of ownership. Among other variables, the survey measures (1) overall satisfaction with the vehicle manufacturer, (2) repurchase intentions, and (3) some demographic information. The survey is designed to measure satisfaction well into the ownership cycle, thus providing managers with the opportunity to identify and maintain a dialogue with customers who are likely to be in the market for a new vehicle soon.
Satisfaction was measured on a five-point scale (5 = “very satisfied,” 4 = “somewhat satisfied,” 3 = “neither satisfied nor dissatisfied,” 2 = “somewhat dissatisfied,” and 1 = “very dissatisfied”) to answer the question, “Based on your ownership experience, how would you rate your satisfaction with this vehicle's manufacturer?” Repurchase intent was measured on a five-point scale (5 = “very likely,” 4 = “somewhat likely,” 3 = “neither likely nor unlikely,” 2 = “somewhat unlikely,” and 1 = “very unlikely”) to answer the question, “Based on your ownership experience, how likely are you to purchase a vehicle made by Company X at your next purchase occasion?”
We measured repurchase behavior by obtaining the brand of the new vehicle the consumers bought. Note that all respondents included in the survey had owned their car for 33 months, so the ownership period before they filled out the satisfaction survey is constant for all respondents. After respondents filled out the survey, the company obtained behavioral data from a syndicated data source, in this case R.L. Polk and Associates. Furthermore, all respondents in the survey initially owned the same brand. That is, all the customers in the database owned a car made by the same firm (e.g., Honda). Only at the subsequent purchase did they repurchase the same brand (i.e., bought Honda) or switch to a different brand (i.e., bought General Motors [GM], Chrysler, Toyota, and so forth).
The key consumer characteristics measured in the survey are shown in Table 1. Comparison with other studies (cf. Mittal, Ross, and Baldasare 1998) and conversations with managers from the automotive firm indicate that the sample is representative of the consumer base.
SAMPLE CHARACTERISTICS

For each cell, this indicates the percentage of customers that repurchased the previous brand.
Customer Retention: Repurchase Intent or Behavior?
For the empirical investigation, repurchase behavior rather than intent data was used for the following reasons:
In commercial studies, satisfaction and intentions data typically are collected within the same survey with little or no temporal distance. Thus, there is high common-methods variance, which inflates the relationship (Fishbein and Ajzen 1975). Mazursky and Geva (1989) find that satisfaction and intentions are highly correlated when measured in the same survey at time t1. However, for the same subjects, satisfaction at t1 has no correlation with intentions after a two-week interval (t2).
Ratings of satisfaction and intentions may also suffer from the same response bias, which leads to spurious correlation between the ratings. For example, ratings of job satisfaction and intention to stay with the employer were found to suffer from the same type of response bias (Arnold, Feldman, and Purbhoo 1985; Zedeck, Kafry, and Jacobs 1976). Only when actual behavioral data (i.e., turnover) were used did the response bias surface.
The translation of satisfaction ratings into intentions versus behavior is likely to differ. First, the satisfaction threshold that is needed for subjects to express a favorable intent may be quite different from the level of satisfaction that is needed for subjects to engage in the corresponding behavior. Second, the functional form linking satisfaction to intentions may be very different from the one linking it to behavior (Fishbein and Ajzen 1975). Third, the relationship between intentions and behavior itself is highly labile. It can be nonlinear (Jamieson and Bass 1989), be sensitive to the scale being used to measure intentions (Kalwani and Silk 1982), and vary on the basis of the time horizon used to measure intentions (Morwitz and Schmittlein 1992). Thus, biases that apply to intentions might not apply to behavior, and vice versa. Finally, firms ultimately are interested in behavior and not just intentions.
However, the use of a behavioral criterion variable poses some practical issues. First, some factors may moderate the relationship between rated satisfaction and repurchase behavior. To the extent that these factors are unrelated to customer characteristics, they are captured in the intercept γo. However, if they are systematically related to customer characteristics, they will be captured by the thresholds γk. In other words, these thresholds still represent the levels of tolerance to dissatisfaction by a demographic group defined by the demographic variable Zk, but these levels are specific to the market conditions prevalent at the time of data collection.
Second, the temporal distance between the time a customer gives a satisfaction rating and the purchase of the next vehicle varies across customers. Recall that all satisfaction ratings were obtained during the 33rd month of ownership, whereas repurchases were observed at varying intervals of time after satisfaction was measured. There is no reason to believe that the time intervals between satisfaction measurement and repurchase that are observed in our sample would not be representative of the population. There is likely an attenuation of the relationship between satisfaction rating and repurchase behavior as the time lag increases. However, marketers have neither control over this lag nor the luxury of perfect hindsight to obtain satisfaction measurements from a consumer right before the repurchasing event.
It is also possible that the time lag varies systematically on the basis of customer characteristics (e.g., older consumers may keep their cars longer) or satisfaction ratings (e.g., more satisfied consumers may keep their cars longer). This could induce a correlation between ε and η. However, as demonstrated subsequently, this correlation does not affect the relative magnitude of the effects being tested.
Suppose the correlation between ε and η is ρ. Then, it follows from our model that the probability of repurchasing the original brand is the binary probit probability:
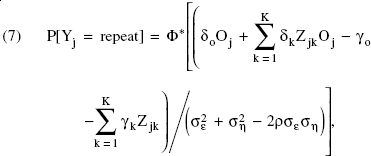
where Φ* is the standardized normal c.d.f.
If ρ ≠ 0, the likelihood function remains unchanged, as long as the response parameters are all multiplied by the same constant [(σ2ε + σ2η − 2ρσεση)/(σε2 + ση2)]. Therefore, the effect of this correlation is the same for all response parameters, and the relative magnitude of the effects remains unchanged.
Results
Do Satisfaction Ratings Vary on the Basis of Consumer Characteristics?
An analysis of variance with satisfaction ratings as the dependent variable and consumer characteristics as the independent variables was run (Table 2). Consistent with previous studies, satisfaction ratings differ on the basis of consumer characteristics (p < .0001), though the explained variance is low (η2 of 10%).
ANALYSIS OF VARIANCE FOR OBSERVED SATISFACTION RATINGS
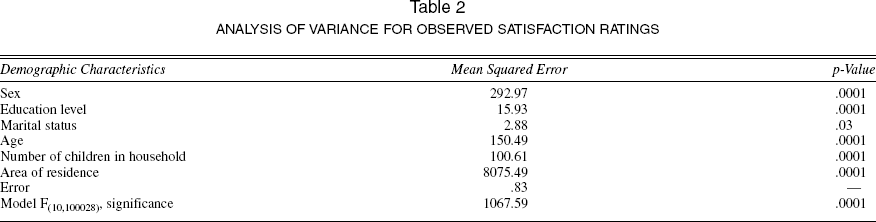
The average satisfaction rating for each cell is shown in the third column of Table 1. With the exception of marital status, all the cell comparisons are significant at the .01 level. Given the large sample size, the statistical significance is not surprising. Satisfaction ratings are higher for women than men (4.28 versus 4.18, p < .0001), and they tend to increase with age (p < .0001). The only unexpected finding is the higher rating for consumers having a postgraduate degree than for those with only some college education. As expected, however, consumers with some college or more education give lower satisfaction ratings than those with only a high school education or less.
Model Estimation
To investigate the extent to which differences in observed satisfaction ratings translate into actual behavior, we estimated several versions of the model developed in the previous section, though only estimates of the final model are shown in Table 3. We compared models for two key aspects: First, we tested whether the response bias differs for different customer groups by comparing rival models that exclude/include the interaction coefficients, 8. Second, we tested whether the functional form describing the link between observed satisfaction and repurchase behavior is linear or nonlinear by specifying the γ parameter with alternative forms. We compared four models using the consistent Akaike information criterion (CAIC). The CAIC for each model is given in parentheses:
MODEL ESTIMATES FOR REPURCHASE BEHAVIOR

Model Fit Statistics: −2log-likelihoodd.f. = 24 = 109,680.48; ρ2 = 11.25%.
p < .01.
Linear satisfaction with only main effects of satisfaction and demographics (110,747),
Linear satisfaction with interactions between satisfaction and demographics (110,598),
Discrete (nonlinear) satisfaction with only main effects of satisfaction and demographics (110,701), and
Discrete (nonlinear) satisfaction with interactions between satisfaction and demographics (109,957).
We chose the CAIC because the sample is very large and some of the models are not nested. The CAIC penalizes non-parsimonious models by taking into account the sample size and the differences in degrees of freedom across models. From the comparison of models, it is clear that inclusion of the interactions improves model fit. Furthermore, the models in which the main effect of satisfaction is coded as a discrete variable perform better than the ones in which it is treated as linear (i.e., interval scale). Note also that all of these models perform better than a naive model containing only the discrete/nonlinear effects of satisfaction (CAIC = 115,967). Thus, including the effect of customer characteristics improves the model fit to the data. More important, we achieved successive improvements by adding the main effects and then the interaction effects of customer characteristics. Unless otherwise indicated, the results described next are based on the model shown in Table 3. This model uses the nonlinear functional form for satisfaction and includes the interactions with demographics.
To investigate nonlinearity, the five-point satisfaction scale was coded as a dummy variable with the category “completely dissatisfied” set as the base. The rest of the categories were coded relative to that base such that coefficients for the other categories reflect changes in repurchase behavior relative to the base category. Four dummy variables were created to code the satisfaction rating. The base was set at a score of 1, or “very dissatisfied” (coded as 0 0 0 0). A score of 2 was coded as 1 0 0 0, a score of 3 was coded as 0 1 0 0, a score of 4 was coded as 0 0 1 0, and a score of 5 was coded as 0 0 0 1. In this coding scheme, the coefficients represent relative change in repurchase probability relative to the base category. Thus, relative differences between successive pairs of coefficients can be compared in order to ascertain whether the impact of successive changes in satisfaction rating on repurchase behavior is nonlinear.
Does Repurchase Behavior Vary Because of Different Thresholds?
In Equation 6, γ captures differences in thresholds for customers with different characteristics. In terms of the model estimates, these are coefficients of the main effects for each customer characteristic (i.e., γ). Recall that for each of the main effects of consumer characteristics (γ), a lower threshold implies a higher level of tolerance and a consequently higher probability of retention (and vice versa). Several coefficients are statistically significant. To aid interpretation, the relationships are visually depicted in Figure 3. In Figure 3, Panel A, we show the overall results, and in Figure 3, Panels B–H, we show comparisons among various subgroups.

SATISFACTION AND REPURCHASE BEHAVIOR
The significant coefficient for sex (γ = −1.4014, p < .0001) indicates that women are more tolerant or have lower thresholds than men (Figure 3, Panel B). For the same level of rated satisfaction, the probability of repurchase among women is uniformly higher than among men: Differences in satisfaction ratings underestimate the extent to which women, compared with men, are likely to repurchase the brand. Similar differences in threshold are seen for education level (Figure 3, Panel C). Compared with subjects with a high school education or less, those with a college degree (γ = .4525, p < .0001) or postgraduate education (γ = .7160, p < .0001) have higher thresholds (i.e., are less tolerant). For the same level of rated satisfaction, subjects with more education tend to have lower levels of retention than those with a high school education or less do. Perhaps consumers with higher education have greater ability to search and are cognizant of superior alternatives in the market. With respect to age (Figure 3, Panel F), older customers (60 years or older) have lower thresholds than younger ones (γ = −.6687). They may have more stable preferences than younger consumers, and that is why given the same average satisfaction, their repurchase probability is higher. Finally, consumers with one or more child in the household have higher thresholds (lower tolerance) than those without any children in the household (γ = .8188, p < .0001; Figure 3, Panel G). Finally, although satisfaction ratings are significantly different, no difference in thresholds based on area of residence (Figure 3, Panel E) is observed. The higher repurchase rate for suburbanites may reflect the higher proportion that gave a rating of 4/5.
Does the Satisfaction–Retention Link Reflect Differences in Response Bias?
The response bias is captured by the interactions between satisfaction ratings and demographics (δ parameter), which implies that, even after accounting for differences in average rating, the translation of reported satisfaction ratings into repurchase behavior varies on the basis of consumer characteristics. Several interactions are statistically significant (p < .0001).
The response bias is higher among women than among men (δ = −.1200, p < .001). Repurchase behavior is relatively invariant to changes in satisfaction ratings among women compared with men. This is especially the case in the dissatisfaction part of the ratings. A change in rating from 1 to 2 is virtually unrelated to changes in repurchase behavior among women. Among men, however, a change in rating from 1 to 2 results in a corresponding increase in repurchase behavior. Response bias based on the number of children in a household is also evident (δ = .0487, p < .005). As seen in Figure 3, Panel G, this is especially true at the edges of the scale. A change in rating from 1 to 2 or from 4 to 5 is less likely to translate into repurchase behavior for consumers with no children in the household than for those with children in the household. Other such patterns of differences in response bias based on education and age can be discerned (Figure 3, Panels C and F); changes in satisfaction are less likely to affect customer retention when the customer is older (δ = −.0946, p < .005) and less educated. No differences based on marital status or area of residence (Figure 3, Panels D and E) were found.
To understand further the implications of response bias, we divided the data into two groups on the basis of a visual inspection of Figure 3, Panels B–G. The first group, Group A, comprised respondents who are women, reside in suburbs, are single, and have no children in the household. Repurchase behavior for each level of satisfaction rating is plotted in Figure 3, Panel H. Among these customers, repurchase behavior is completely invariant to rated satisfaction; at every level of satisfaction rating, the retention rate is 100%. The response bias is so high that the satisfaction ratings are completely uncorrelated to repurchase probability. Even more interesting is that this response bias would not have been discernible if we used repurchase intention ratings. The correlation between satisfaction and repurchase intent ratings is .61 (p < .0001) for this group and .64 (p < .0001) for the rest of the respondents. When repurchase behavior is plotted against intent ratings (see Figure 3, Panel H), the patterns are almost identical to those found for satisfaction rating. This confirms findings from job satisfaction research (Arnold, Feldman, and Purbhoo 1985): Ratings of job satisfaction and behavioral intentions suffer from the same response bias when examined in comparison with turnover behavior.
It is also instructive to examine the strategic impact of this response bias. Group A comprises 3815 customers. At an average automobile price of $15,000, these respondents represent approximately $60 million in automotive sales. If these figures are projected to the entire customer base of the firm, the dollar amounts are even more staggering. 3
Exact estimates are not given for confidentiality reasons.
Satisfaction and Repurchase Behavior: Functional Form
What functional form best describes the link between rated satisfaction and repurchase behavior? Does it vary on the basis of consumer characteristics? To answer these questions, we estimated two rival models. In one, we treated the satisfaction rating as an interval scale, and in the other we coded the satisfaction ratings as a dummy variable with “very dissatisfied” set as the base. As explained previously, this enables us to ascertain whether the change in magnitude of the coefficient capturing the movement between successive scale points is the same or different. For example, for a movement from a rating of 1 to 2, is the relative increase in repurchase probability any different from a corresponding movement from 2 to 3? The estimates in Table 3 include coefficients based on this coding. We tested the relative change in slopes for each successive movement in the rating using the asymptotic t-test (Ben-Akiva and Lerman 1985). As summarized in Table 4, the comparisons show that the functional form is highly nonlinear. In particular, moving from a rating of 4 (“somewhat satisfied,” B4) to a rating of 5 (“very satisfied,” B5) has a disproportionately larger impact on repurchase behavior than a corresponding move from a score of 3 to 4 (“neither satisfied nor dissatisfied” to “somewhat satisfied,” B3 to B4).
TESTS FOR NONLINEARITY

Comparisons are tested using the asymptotic t-test (Ben-Akiva and Lerman 1985).
The business impact of this nonlinearity is staggering. The coefficient for the linear functional form is .5295 (p < .001). Using a linear functional form would underestimate the impact of a change in score from 4 to 5 by 64%, causing managers to pull back resources incorrectly from “completely” satisfying customers. Managers who aim at merely satisfying rather than “completely” satisfying customers run the risk of undermining customer retention (see Jones and Sasser 1995). In the area of dissatisfaction, a similar misestimation may occur if managers use a linear form. Note that though statistically significant, the difference between “somewhat” and “very dissatisfied” (B2 versus B1 = .1888) is not as large as the linear form would suggest (.5295). Those who are somewhat dissatisfied may be more likely to switch to alternative brands than the firm would conclude on the basis of the linear form. Again, the firm may underestimate the seriousness of having customers who are only somewhat dissatisfied. Their repurchase behavior is not so different from those who are very dissatisfied, though the linear formulation may lead managers to conclude otherwise.
Next, we examined whether the nonlinearity in the functional form differs for customers with different characteristics. We estimated a new model in which each of the Satisfaction × Demographic interactions was coded using the nonlinear functional form for satisfaction. For example, we used four (instead of one) dummy variables to code the Sex × Satisfaction interaction. This model, in which the main effect of satisfaction and all its interactions were coded as nonlinear, was compared with the model shown in Table 3, in which the interactions use a linear functional form. The CAIC for this new model was 110,446, which indicates that it fit the data worse than the model in Table 3. We conclude that though the functional form is nonlinear, the nature or extent of nonlinearity does not vary on the basis of consumer characteristics.
Retention Metrics: Intention or Behavior?
Next, we examined issues related to using repurchase intention versus behavior in satisfaction studies. Virtually all published studies on satisfaction, even those relying on commercial surveys (see Anderson and Sullivan 1993; Mittal, Kumar, and Tsiros 1999), have used repurchase–intent as the criterion variable (for a recent exception, see Bolton 1998). This strategy is efficient because intention data are easier to collect. Firms, however, want to predict repurchase behavior accurately. For such purposes, it may not be enough to know if the relationship is positive; rather, researchers must uncover the proper functional form to make predictions and conduct sensitivity analysis of resources allocated to satisfaction management, satisfaction ratings, and consequent retention.
To investigate differences in the functional form linking satisfaction to intention versus behavior, we estimated the model shown in Table 3 with repurchase intent as the dependent variable. The coefficients for the main effect of satisfaction scale were as follows: .77, 1.50, 2.09, and 2.35 (all significant at p < .0001). An examination of differences in the magnitude of successive coefficients shows that the satisfaction–intent link exhibits decreasing returns, whereas the satisfaction–behavior link exhibits increasing returns. Thus, if the manager's interest is to predict how repurchase behavior will change in response to successive changes in satisfaction ratings, the use of intention ratings alone could be misleading.
Summary of Results
Consumers with different characteristics have different thresholds and consequently different repurchase probabilities. For example, consumers who are women, are 60+ years of age, and have no children have lower thresholds (i.e., are more loyal). At the same level of rated satisfaction, their repurchase rate is higher than that of other subjects.
The nature and extent of response bias in satisfaction ratings varies by customer characteristics. Repurchase behavior is less sensitive to changes in satisfaction ratings for some customer groups than others. In one group, the response bias is so high that rated satisfaction is completely uncorrelated to repurchase behavior.
The functional form relating rated satisfaction to repurchase behavior is highly nonlinear, though the nature or extent of the nonlinearity does not vary on the basis of consumer characteristics.
The functional form relating satisfaction to repurchase intention differs from the functional form relating satisfaction to repurchase behavior. Whereas the satisfaction–intention link shows decreasing returns, the satisfaction–behavior link shows increasing returns.
Issues for Commercial Satisfaction Surveys
Customer Acquisition Management
For a firm interested in managing its acquisition strategy, it is important to identify characteristics of customers with higher levels of intrinsic retainability (Blattberg and Deighton 1996) or loyalty coefficient (Reichheld 1996). Such customers represent a constant and consistent source of revenue for the company, may be ideal for testing new ideas and product features, and may buffer the company if performance on key attributes falters temporarily. The γ parameter in our model enables firms to identify characteristics of such customers from an existing customer satisfaction study. Firms can use it as a measure of intrinsic retainability or as a loyalty coefficient.
Attribute–Performance Management
To optimize overall satisfaction, firms maximize performance on attributes that have the largest weight in determining overall satisfaction. The weight is ascertained by regressing attribute–performance ratings on the satisfaction rating (see Mittal, Ross, and Baldasare 1998). Rust, Zahorik, and Keiningham (1995, p. 66) advise managers to “consider each segment individually, perhaps addressing first the segment currently most important to the business's strategic plan.” Firms may need to focus on different attributes for customers with different levels of intrinsic retainability. To illustrate this, we computed attribute weights for two sets of respondents with different characteristics.
As shown in Table 5, these differences have substantive strategic implications. For example, women, a group with high intrinsic retainability, place 33% more importance on service quality at the dealership than men do. In contrast, women place much less value on engine performance. Similar differences are observed in the second part of Table 5 for Group A. If the firm wants to continue retaining this segment of customers, it should allocate more resources to service-related attributes than the product itself.
DIFFERENCES IN ATTRIBUTE WEIGHTS BASED ON CONSUMER CHARACTERISTICS

Coefficients between the two groups are different at p < .05.
Coefficients between the two groups (e.g., men versus women) are different at p < .01.
Group A consists of women who are single, have no children, and live in suburbs. All others constitute Group B.
Notes: Attribute performance was rated on a five-point scale, where “excellent” = 5 and “poor” = 1.
Research Issues and Limitations
A key limitation of this study is that only brand-level (e.g., Honda, Ford) data were available for analysis and model-level (e.g., Civic, Escort) data were not. For example, a consumer may have stayed with the same brand but migrated to a different model (e.g., a GM buyer “graduating” from a Saturn to a Cadillac). Moreover, we could not ascertain the extent to which customers' perceptions of family brands (e.g., GM owns Saturn and Cadillac) affect repurchase behavior. Modeling such brand-level competition is a key direction for further research. In addition, models could be developed that would enable researchers to construct switching matrices and examine patterns of interbrand switching (Rust, Zeithaml, and Lemon 2000). Thus, for customers who do not repurchase the current brand, it would be useful to investigate which brands they did purchase and why.
Research is also needed to explicate the intention–behavior discrepancy in the context of satisfaction surveys such that theory, and not expedience alone, drives the choice of the criterion variable in a satisfaction study. Related to this, research is also needed to examine the context dependence of the functional form for the satisfaction–behavior link. Prior research has been limited to examining variation in the magnitude of the satisfaction–intention link at the intercategory (Anderson 1994) or interindustry (Fornell et al. 1996) level. Our results suggest the need to go one step further and examine variation in the shape of the functional form using behavior—and not just intention—as the criterion variable. Jones and Sasser (1995) provide grounds for exploring various functional forms for the satisfaction–behavior link depending on industry structure. These research goals could be achieved by conducting more studies that replicate and extend these results, albeit in different industries and categories.