
Abstract
Although the methodological literature is replete with advice regarding the development and validation of multi-item scales based on reflective measures, the issue of index construction using formative measures has received little attention. The authors seek to address this gap by (1) examining the nature of formative indicators, (2) discussing ways in which the quality of formative measures can be assessed, and (3) illustrating the proposed procedures with empirical data. The aim is to enhance researchers' understanding of formative measures and assist them in their index construction efforts.
Following the publication of the JMR “Special Section on Measurement and Marketing Research” in February 1979—which included Churchill's (1979) and Peter's (1979) seminal articles—a great deal of attention has been devoted to developing marketing measures with sound psychometric properties (e.g., Churchill and Peter 1984; Peter 1981). The advent of structural equation modeling techniques further facilitated the assessment of multi-item measures in terms of dimensionality, reliability, and validity (e.g., Anderson and Gerbing 1982; Danes and Mann 1984; Steenkamp and van Trijp 1991). As a result of these developments, the usage of multi-item measures has increased substantially in the past 20 years (Bruner and Hensel 1993).
Although the methodological soundness of marketing studies has undoubtedly been improved as a result of these advances, existing measure development guidelines (e.g., DeVellis 1991; Spector 1992) focus almost exclusively on scale development, whereby items (i.e., observed variables) composing a scale are perceived as reflective (effect) indicators of an underlying construct (i.e., latent variable). This perspective reflects the conventional wisdom on measurement (see Bollen and Lennox 1991), which is largely based on classical test theory and, in particular, the domain-sampling model (Nunnally and Bernstein 1994).
An alternative measurement perspective is based on the use of formative (cause, causal) indicators and involves the creation of an index rather than a scale (Bollen and Lennox 1991). 1 In this context, formative indicators “are observed variables that are assumed to cause a latent variable. For effect indicators the latent variable causes the observed variables. Most researchers in the social sciences assume that indicators are effect indicators. Cause indicators are neglected despite their appropriateness in many instances” (Bollen 1989, p. 65). Such neglect is certainly the case in marketing, because practically all measures available are based—implicitly or explicitly—on reflective indicators (see, e.g., the compilations by Bearden, Netemeyer, and Mobley [1993] and Bruner and Hensel [1992, 1996]).
Note that the terminology can often be confusing in the literature; for example, Babbie (1973) uses the term “index” to describe what is really a scale, and several scales in Bruner and Hensel's (1996) compilation have “index” in their titles.
The purpose of this article is to provide some insights into the nature of formative indicators so that researchers can reach an informed choice as to the appropriate measurement model for their needs. In particular, we seek to complement existing guidelines on scale development with some suggestions regarding index construction. We first provide a brief background on formative indicators, drawing from the limited (and fragmented) literature on the topic. Next, we give an example of constructing an index based on actual survey data and highlight the procedures used to assess its quality. We conclude the article with some thoughts about the use of indexes in marketing studies.
Formative Indicators: Theoretical Background
A measurement perspective based on formative indicators reflects the notion that “in many cases, indicators could be viewed as causing rather than being caused by the latent variable measured by the indicators” (MacCallum and Browne 1993, p. 533). A typical example is socioeconomic status (SES), which is formed as a combination of education, income, occupation, and residence (see Hauser 1971, 1973). If any one of these measures increases, SES would increase (even if the other indicators did not change); conversely, if a person's SES increases, this would not necessarily be accompanied by an increase in all four measures. The choice of a formative versus a reflective specification thus depends on the causal priority between the indicator and the latent variable (Bollen 1989). 2 More specifically,
As Nunnally and Bernstein (1994, p. 449) observe, “people have high socio-economic status because they are wealthy and/or well-educated; they do not become wealthy or educated because they are of high socio-economic status.”
constructs such as “personality” or “attitude” are typically viewed as underlying factors that give rise to something that is observed. Their indicators tend to be realized, then as reflective. On the other hand, when constructs are conceived as explanatory combinations of indicators (such as “population change” or “marketing mix”) that are determined by a combination of variables, their indicators should be formative. (Fornell and Bookstein 1982, p. 292, emphasis in the original) 3
Formative measurement, though potentially applicable to the measurement of individual characteristics (such as SES), is particularly relevant for dealing with organizational and social constructs—that is, when the unit of analysis is the firm or group (Bagozzi 1994).
A formative perspective (though not explicitly acknowledged as such) characterizes several composite measures used in the economics literature. Examples include the index of sustainable economic welfare (Daly and Cobb 1989), the human development index (United Nations Development Program 1990), the quality-of-life index (Johnston 1988), various country risk and market potential indexes (e.g., Dichtl and Köglmayr 1986; Economist Intelligence Unit 1996), and quality-adjusted (i.e., hedonic) price indexes (e.g., Griliches 1971). 4 In contrast, use of formative measures is rather rare in marketing studies; only a handful of authors intentionally choose a formative specification for some of their measures (e.g., see the index of customer expectations by Ennew, Reed, and Binks [1993] or the market complexity measure by Homburg, Workman, and Krohmer [1999]). 5
For further examples, we refer the reader to Horn (1993) and the references given therein.
However, as is discussed subsequently (see Table 1), several marketing measures supposedly operationalized by means of reflective indicators are probably better viewed as combinations of formative indicators.
The origins of the formative perspective can be traced back to the “operational definition” model. Under strict operationalism, “a concept becomes its measure and has no meaning beyond that measure…. [T]he entire meaning of a theoretical concept is assigned to its measurement and any theoretical concept has one and only one measurement” (Bagozzi 1982, p. 15). Thus, if η represents the concept (i.e., latent variable) in question and x is an empirical measure (i.e., observed or manifest variable), then

A more contemporary view, which allows the possibility of multiple measures, xi, (i = 1, 2, …, n), suggests that “a concept is assumed to be defined by, or to be a function of, its measurements” (Bagozzi and Fornell 1982, p. 34). According to this latter definition, a formative specification implies the following relationship:

where γi is a parameter reflecting the contribution of xi to the latent variable η.
Another formative specification (shown in Figure 1 for n = 3) is provided by Bollen and Lennox (1991, p. 306):


A FORMATIVE MEASUREMENT MODEL
Equation 1 characterizes much of the research in marketing during the 1960s and 1970s in which the use of single-item measures was common (Jacoby 1978). However, its utility as a measurement model is limited because it “rejects the possibility that multiple measurements may be taken for a theoretical concept” (Bagozzi 1982, p. 15); therefore, it makes the statistical assessment of measurement error problematic.
Regarding Equations 2 and 3, a key difference between them is that the former is consistent with a principal components model (Bagozzi and Fornell 1982; Nunnally and Bernstein 1994), whereas the latter is not (because of the presence of the disturbance term, ζ. Note also that unless all γs are equal to 1 and, in the case of Equation 3, ζ is also equal to 0, a linear composite based on the sum of equally weighted indicators will not be equivalent to the latent variable, η (Bollen and Lennox 1991). This is an important point not least because discussions of formative indicators in the literature sometimes refer to both formulations and thus can lead to confusion. For example, according to Bagozzi (1994, p. 332, emphasis added), “when a latent variable is defined as a linear sum of a set of measurements or when a set of measures of a dependent variable is determined by a linear combination of measures of independent variables, the measures are termed formative indicators: the measures produce the constructs so to speak.”
Formative indicators have several properties that sharply distinguish them from reflective indicators. 6 First and fore-most, whereas reflective indicators are essentially interchangeable (and therefore the removal of an item does not change the essential nature of the underlying construct), 7 with formative indicators, “omitting an indicator is omitting a part of the construct” (Bollen and Lennox 1991, p. 308). Second, as can be seen in Figure 1, the correlations among formative indicators are not explained by the measurement model; the indicators being exogenously determined, it becomes more problematic to assess their validity (Bollen 1989). Third, and related to the previous point, there is no reason that a specific pattern of signs (i.e., positive versus negative) or magnitude (i.e., high versus moderate versus low) should characterize the correlations among formative indicators (Bollen 1984); indeed, “internal consistency is of minimal importance because two variables that might even be negatively related can both serve as meaningful indicators of a construct” (Nunnally and Bernstein 1994, p. 489). Fourth, unlike their reflective counterparts, formative indicators do not have error terms; error variance is represented only in the disturbance term, ζ, which is uncorrelated with the xs (i.e., cov[xi,ζ] = 0). It is worth noting in this context that with formative indicators, the variance in true scores is higher than the variance in observed scores; in the reflective specification, the opposite is true (see Fornell, Rhee, and Yi 1991). 8 Fifth, taken in isolation, the formative indicator measurement model in Figure 1 is statistically underidentified (see Bollen and Lennox 1991); the model can be estimated only if it is placed within a larger model that incorporates consequences (i.e., effects) of the latent variable in question (Bollen 1989). In contrast, a model with three effect indicators is identified, and confirmatory factor analysis can be used to estimate its parameters (see Long 1983). Sixth, even if the model is embedded within a larger model, identification of all parameters may still prove problematic when a formative specification is involved. For example, MacCallum and Browne (1993) indicate that a necessary—but not sufficient—condition for identifying the residual variance (i.e., the disturbance term) is that the latent variable emits at least two paths to other latent variables measured with effect indicators.
Formative indicators “are not indicators in the conventional sense as defined in factor analysis or covariance structure modelling. Rather they are exogenous measured variables that influence the composite defined as a causally indicated variable” (MacCallum and Browne 1993, p. 533). For a formal comparison between formative and reflective indicators, see Fornell, Rhee, and Yi (1991) or Fornell and Cha (1994).
It may, however, adversely affect construct reliability and/or lead to identification problems if the number of remaining indicators becomes too low (i.e., less than three).
Following Fornell, Rhee, and Yi (1991), in the formative specification, T = O + ε, where T = true score, O = observed score, and ε = disturbance term. However, ε captures all the remaining causes of T other than O, and therefore Cov(T, ε) ≠ 0 and Cov(O, ε) = 0. Thus Var(T) > Var(O). For further details, see Fornell, Rhee, and Yi (1991) and Namboodiri, Carter, and Blalock (1975).
As a result of these characteristics, conventional procedures used to assess the validity and reliability of scales composed of reflective indicators (e.g., factor analysis and assessment of internal consistency) are not appropriate for composite variables (i.e., indexes) with formative indicators. As Bollen (1989, p. 222) points out, “unfortunately, traditional validity assessments and classical test theory do not cover cause indicators.” Similarly, Bagozzi (1994, p. 333) warns that “reliability in the internal consistency sense and construct validity in terms of convergent and discriminant validity are not meaningful when indexes are formed as a linear sum of measurements.” These comments imply that alternative approaches must be followed to evaluate the quality of measures that are based on formative indicators. This is the subject of the next section, in which several guidelines for index construction are presented and illustrated by means of an example.
Index Construction
Unlike scale development, for which detailed step-by-step guides exist for construct specification, item selection and purification, and scale validation (e.g., Churchill 1979; DeVellis 1991; Spector 1992), guidelines for constructing indexes based on formative indicators are much harder to find. However, inspection of the dispersed literature on formative indicators reveals that four issues are critical to successful index construction: content specification, indicator specification, indicator collinearity, and external validity. We illustrate each of these issues with reference to empirical data drawn from a survey on export sales forecasting practices. The focal construct for which we seek to generate an index is the resource commitment of a firm to the export sales forecasting task; the statistical analysis is based on 173 mail questionnaires completed by senior managers in exporting firms (for data collection details, see Appendix A).
Content Specification
The first issue in index construction is the specification of the scope of the latent variable, that is, the domain of content the index is intended to capture. This is particularly important because “an index is more abstract and ambiguous than a latent variable measured with reflective indicators” (Bagozzi 1994, p. 333). Because under formative measurement the latent variable is determined by its indicators rather than vice versa, content specification is inextricably linked with indicator specification (discussed subsequently). Consequently, “breadth of definition is extremely important to causal indicators” (Nunnally and Bernstein 1994, p. 484), not least because failure to consider all facets of the construct will lead to an exclusion of relevant indicators (and thus exclude part of the construct itself; see the previous section).
In our example, we specify the domain of content of the focal construct (resource commitment) as the monetary, informational, managerial, and time-related resources specifically devoted to the activity of forecasting sales in export markets. We thus seek to capture the range of resources that bear on the export sales forecasting task in fairly broad terms.
Indicator Specification
Whereas for reflective indicators, according to the domain sampling model, a set of items “is chosen randomly from the universe of items relating to the construct of interest” (DeVellis 1991, p. 55), a census of indicators is required for a formative specification (Bollen and Lennox 1991). More specifically, the items used as indicators must cover the entire scope of the latent variable as described under the content specification. In our example, this implies that the indicators selected must capture monetary, informational, managerial, and time aspects; failing to include at least one indicator for, say, informational resources would change the composition of the latent variable. This does not mean that no index purification is possible by the exclusion of indicators (see the next section). It simply stresses the need at the indicator specification stage to be sufficiently inclusive in order to capture fully the construct's domain of content.
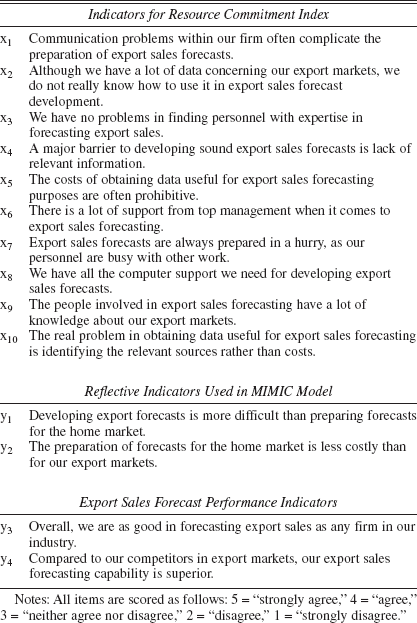
Appendix B lists the items generated to be used as formative indicators for the resource commitment index; these were based on an extensive review of the forecasting literature as well as exploratory interviews with export managers. In writing up the items, conventional guidelines regarding clarity, length, directionality, lack of ambiguity, and avoidance of jargon were followed (e.g., DeVellis 1991; Spector 1992), and a five-point Likert format was used for scoring.
Indicator Collinearity
An issue particular to formative indicators is that of multi-collinearity. This is because the formative measurement model is based on a multiple regression (see Equation 3), and therefore the stability of the indicator coefficients (γs) is affected by the sample size and strength of the indicator intercorrelations. Excessive collinearity among indicators thus makes it difficult to separate the distinct influence of the individual xs on the latent variable, η. Two issues are relevant in this context. First, given that each indicator coefficient, γi, shows the direct structural relation between xi and η, the magnitudes of the γs can be interpreted as validity coefficients (Bollen 1989); thus, high multicollinearity would render the assessment of indicator validity problematic. Second, if a particular xi turns out to be almost a perfect linear combination of the other xs, it is likely to contain redundant information and can therefore become a candidate for exclusion from the index (Bollen and Lennox 1991). Note that under reflective measurement, multi-collinearity is not an issue because only simple regressions are involved (in which the indicator serves as the criterion and the latent variable as the predictor).
In our example, multicollinearity among the ten indicators listed in Appendix A did not seem to pose a problem; the maximum variance inflation factor came to 1.588, which is far below the common cut-off threshold of 10 (e.g., Kleinbaum, Kupper, and Muller 1988). Therefore, all ten items were retained for initial inclusion in the index.
External Validity
As already mentioned, the very nature of formative measurement renders an internal consistency perspective inappropriate for assessing the suitability of indicators; indeed, “the best we can do … is to examine how well the index relates to measures of other variables” (Bagozzi 1994, p. 333). However, the literature is unclear as to exactly how this should be done and practically silent on the circumstances, if any, calling for the removal of invalid indicators from the index. From a theoretical perspective, elimination of indicators carries the risk of changing the construct itself (see the previous discussion) and should always be approached with caution. In contrast, from a practical perspective, an excessive number of indicators is undesirable because of both the data collection demands it imposes and the increase in the number of parameters when the construct is embedded within a broader structural model (e.g., in a LISREL context). How to balance these considerations is a question that has not yet been fully resolved; what follows, therefore, should be viewed as suggestive rather than conclusive and as subject to further conceptual and methodological development.
At a basic level, to obtain an initial idea of the quality of individual indicators, each indicator could be correlated to another variable (external to the index), and only those indicators that are significantly correlated with the variable of interest would be retained (see Spector 1992). There must be solid theoretical reasons why the indicators in the proposed index should relate to this variable. One possibility is to use as an external criterion a global item that summarizes the essence of the construct that the index purports to measure. For example, in our study, we developed an additional statement reading “our firm devotes few resources (people, money, time) to export sales forecasting” and used this as an initial screen for the indicators in Appendix B. All but one of the indicators (x10) turned out to be significantly correlated with this statement (at p < .05 or better); subsequently, x10 was excluded, and further index validation was based on the remaining nine items (x1–x9).
A more satisfactory approach to validation, allowing the assessment of the proposed indicators as a set (i.e., taking account of their interrelationships), is to include some reflective indicators and estimate a multiple indicators and multiple causes (MIMIC) model (Hauser and Goldberger 1971; Jöreskog and Goldberger 1975). In this model, the index indicators, xi, act as direct causes of the latent variable, η, which is indicated by one or more reflective measures, yj (j = 1, 2, …, m); the inclusion of reflective measures is necessary for identification purposes (Bollen 1989). Figure 2 illustrates a MIMIC model for n = 3 and m = 2. If the overall model fit proves acceptable, this can be taken as supporting evidence for the set of indicators forming the index. In addition, by focusing on the γ parameters, researchers can assess the contribution and significance of the individual indicators.

MIMIC MODEL
In our example, we estimated a MIMIC model with x1–x9 as direct causes of resource commitment and two further items (y1 and y2) as reflective indicators of the construct (the latter are also shown in Appendix A). 9 The two reflective items were chosen to represent effects of resource commitment; specifically, they captured the difficulty and costs associated with developing export sales forecasts, both of which are directly influenced by the various resource input to the export sales forecasting task.
Following the suggestions of an anonymous reviewer, we repeated the MIMIC analysis by also including x10 (i.e., the item excluded at the previous stage); the results were practically identical to those reported in the text and confirmed the decision to eliminate x10. We thank the reviewer for suggesting this analysis.
Estimation of the model produced a good fit (χ2 = 8.34, d.f. = 8, p = .401; root mean square error of approximation [RMSEA] = .016, root mean square residual [RMSR] = .026, goodness-of-fit index [GFI] = .991, nonnormed fit index [NNFI] = .987, comparative fit index [CFI] = .998). However, several of the γs turned out to be nonsignificant, which suggested that perhaps not all nine indicators should be included in the index. Recall that the γs can be interpreted as validity coefficients (Bollen 1989); if the values of these are zero in the population, then arguably the indicators involved cannot be considered valid measures of the construct (and a nonsignificant t-statistic for γ fails to reject the zero value hypothesis). Bearing this in mind, we reestimated the model after eliminating nonsignificant indicators; the latter were excluded one at a time in an iterative process, starting with one displaying the lowest t-value. The revised model, comprising only four indicators (x1, x3, x5, and x7), also produced an acceptable fit (χ2 = 3.45, d.f. = 3, p = .328; RMSEA = .029, RMSR = .024, GFI = .993, NNFI = .976, CFI = .995). A comparison of the nine-indicator model with the four-indicator model showed no significant deterioration in fit (A%2 = 4.89, d.f. = 5, p > .10), which is also reflected in the minimal reduction in variance explained (R2) in the latent variable (the latter dropped from .453 to .414). Last, but by no means least, inspection of the four indicators still revealed sufficient breadth of coverage for capturing the content of the construct. This property is of major conceptual importance: Had indicator elimination resulted in an index comprising items that captured, say, only managerial resources, the nature of the construct would have been altered (Bollen and Lennox 1991; Nunnally and Bernstein 1994). Indicator elimination—by whatever means—should not be divorced from conceptual considerations when a formative measurement model is involved.
A final approach to validation, focusing on nomological aspects, involves linking the index to other constructs with which it would be expected to be linked (i.e., antecedents and/or consequences). 10 Such validation is particularly relevant when indicators have been eliminated from the original index; under these circumstances, it becomes essential to establish that the new version functions in predictable ways. Validation along these lines requires (1) that information is gathered for at least one more construct than the one captured by the index, (2) that this other construct is measured by means of reflective indicators, and (3) that a theoretical relationship can be postulated to exist between the constructs. Figure 3 shows this approach with the latent variable captured by the index (η|1) acting as predictor of another latent variable (η2); of particular interest is the sign and magnitude of the β21 parameter, as this represents the theoretical relationship between η1 and η2.
After all, the substantive reason behind index construction is likely to be “how the index functions as a predictor or predicted variable” (Bagozzi 1994, p. 332).

TWO-CONSTRUCT MODEL WITH FORMATIVE AND REFLECTIVE INDICATORS
In our example, we estimated a model similar to the one in Figure 3 in which η1 represented resource commitment (comprising the four indicators selected by the MIMIC analysis) and η2 represented managers' assessment of overall export forecast performance; the latter was measured by two reflective indicators (y3 and y4) (see Appendix A). Because greater resource commitment should improve forecast performance (e.g., see Dalrymple 1987), we expected that β21 > 0. Following MacCallum and Browne (1993), we scaled η1 and η2 by fixing one of their respective indicator paths to 1.0 and set the error variance of η1 to 0. 11 Estimation of the model resulted in a good overall fit (χ2 = 4.591, d.f. = 3, p = .204; RMSEA = .056, RMSR = .023, GFI = .991, NNFI = .917, CFI = .983); the path between η1 and η2 was also found to be significant and consistent with expectations (β21 = .108, p < .05). Thus, evidence in support of the validity of the resource commitment index was obtained. 12
The latter constraint is necessary when a latent variable measured by formative indicators emits only a single path (as is the case here).
Although the proportion of variance explained in η2 by the resource index (η1) is somewhat low (R2 = .101), it should be appreciated that forecast performance is affected by several other factors, such as the turbulence of the environment (Mahmoud 1987) and the specific forecasting methods used (Small 1980).
It goes without saying that when an index has been constructed and subjected to the validity tests discussed previously, it should be cross-validated on a fresh set of data (see Cudeck and Browne 1983). That formative rather than reflective indicators are involved does not in any way reduce the need to replicate the results on different samples; capitalization on chance constitutes a clear and present danger regardless of the type of indicator used.
Conclusion
Almost 30 years ago, in his influential article on unobserved variables, Blalock (1971, p. 346) stated that “the causal connections between unmeasured variables and their indicators … should be made explicit so that implications for tests and estimating procedures can be noted.” Much more recently, Bollen and Lennox (1991, p. 312) warned that “researchers should not automatically confine themselves to the unidimensional classical test model.” In this article, we focus on the formative indicator model and attempt to provide some guidelines for constructing formative multi-item measures (indexes). The procedures presented here should prevent the use of indexes as “a handy excuse for low internal consistency” (Bollen and Lennox 1991, p. 312); although conventional scale development guidelines may be inappropriate, there are systematic steps that can be followed to help construct a valid measure from formative indicators.
The choice between a formative and a reflective specification should primarily be based on theoretical considerations regarding the causal priority between the indicators and the latent variable involved (Cohen et al. 1990; Fornell, Rhee, and Yi 1991; Namboodiri, Carter, and Blalock 1975). Additional considerations include the objectives of the study and empirical issues (see Fornell and Bookstein 1982). With regard to the former, “should the study intend to account for observed variances, reflective indicators … are most suitable. If the objective is explanation of abstract or ‘unobserved’ variance, formative indicators … would give greater explanatory power” (Fornell and Bookstein 1982, p. 292). 13 With regard to empirical considerations, as already noted, indicator collinearity and sample size effects will affect the stability of the indicator coefficients in the formative model. If multicollinearity is a serious problem and the study's main concern is the explanation of structural model variance, a formative speculation may still be used, but interpretation should be based on loadings (as in canonical correlation analysis) rather than regression weights (γs); procedures for doing this are described by Bagozzi, Fornell, and Larcker (1981). 14
Note that using a combination of formative and reflective indicators is also an option. For example, “if one intends to explain variance in the observed criterion variables by way of the unobservables, the indicators of the endogeneous construct should be reflective, and those of the exogeneous formative” (Fornell and Bookstein 1982, p. 292).
The authors thank an anonymous reviewer for alerting them to the potential use of loadings in the presence of multicollinearity among formative indicators.
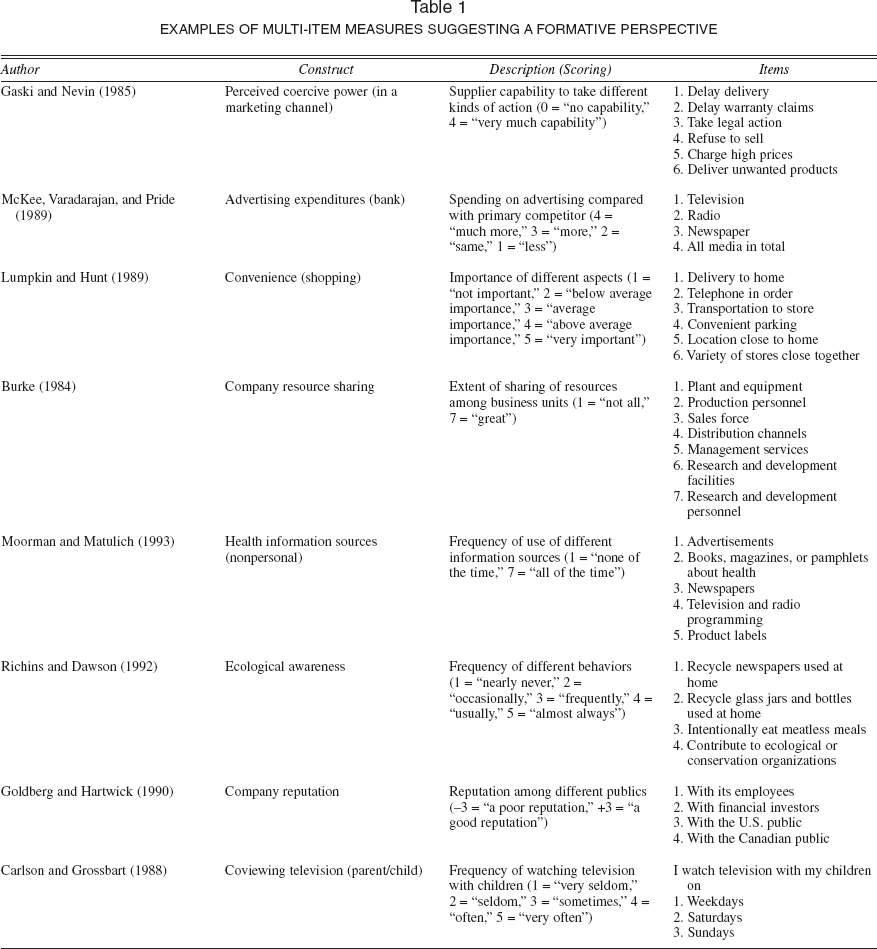
In conclusion, we offer three thoughts to stimulate further debate and research: First, we believe that several marketing constructs currently operationalized by means of reflective indicators would be better captured if approached from a formative perspective. Table 1 shows a selection of multi-item measures that have been based on conventional scale development procedures (thus assuming reflective measurement) but that appear to be much more consistent with a formative perspective; inspection of the items constituting these scales reveals that the causal priority runs from the indicators to the construct, not the other way around. For example, Gaski and Nevin's (1985) coercive power measure is formed as a combination of diverse punitive actions that a supplier could take (e.g., delay delivery, refuse to sell); an increase (decrease) in the supplier's capability to take any one of these actions would result in an increase (decrease) in coercive power. Similarly, in Moorman and Matulich's (1993) health information utilization measure, there is no compelling rationale to expect that an increase (decrease) in information utilization would be reflected in the use of all five information sources involved. Thus, in both cases, the assumption of a reflective measurement model is questionable (the same applies to the rest of the measures in Table 1).
EXAMPLES OF MULTI-ITEM MEASURES SUGGESTING A FORMATIVE PERSPECTIVE
Second, we suspect that the poor fit experienced in covariance structure models may sometimes indicate that the wrong type of measurement model has been applied (as opposed to simply misspecifying the relations between the indicators and their underlying factors and/or relations between constructs). In this context, respecification of indicators from reflective to formative can often result in an improved model fit (for an illustration, see MacCallum and Browne 1993).
Third, we wonder whether the sheer availability of software for covariance structure analysis (e.g., LISREL, EQS, AMOS) has resulted in an almost automatic acceptance of reflective indicators in the minds of researchers. Although formative indicators can be accommodated within a conventional covariance structure framework (as we show in this article), it should not be forgotten that partial least squares (PLS) offers an alternative for incorporating formative (as well as reflective) measurement models. Given that PLS methodology has several attractive features (see Fornell and Bookstein 1982; Fornell and Cha 1994), the use of PLS for index construction purposes seems to be a particularly interesting area for further research.
Footnotes
Data Collection
Survey data were collected by a mail questionnaire that was developed on the basis of a comprehensive review of the exporting and forecasting literature as well as exploratory interviews with exporting companies. The instrument was subsequently pretested by protocol interviews and two separate mail pilots with 100 exporters each. For the main survey, a size-stratified sample of 1330 exporters in the manufacturing field was targeted, which was derived from the Dun & Bradstreet database of exporters. A personalized mailing was undertaken to the employees responsible for export operations, a postage-paid return envelope was included, and the respondents were promised a copy of the results. Two weeks after the initial mailing, a follow-up letter was sent to a stratified sample of 300 identified nonrespondents (using the same strata proportions as in the original sample).
Altogether, 256 responses were obtained, of which 180 were usable (note that 173 cases are used in the analysis following listwise deletion of missing data); the distribution of the responses across size categories was practically identical to that of the original sample. To gather firsthand information with regard to reasons for nonresponse, a telephone follow-up of nonrespondents was undertaken. This showed that ineligibility (i.e., the firm was no longer exporting or the firm no longer existed) was the main reason for nonresponse. Among eligible nonrespondents, the most common reasons were lack of time or company policy that prohibited the completion of any questionnaire. After adjustment for ineligibles (Wiseman and Billington 1984), the effective response rate came to 18.5%. This rate is comparable to other surveys conducted in an industrial setting (Jobber and Bleasdale 1987) and surveys on forecasting practices (e.g., White 1986). Although the telephone follow-ups gave no reason to suspect that nonresponse error was an issue of concern, further analysis involved a comparison of early and late responses, as recommended by Armstrong and Overton (1977). A series of t-tests for independent samples failed to identify significant differences between early and late respondents, providing additional evidence that nonresponse bias was unlikely to be a major problem in this study.
Measurement Items used in Illustrative Models
| Indicators for Resource Commitment Index | |
| x1 | Communication problems within our firm often complicate the preparation of export sales forecasts. |
| x2 | Although we have a lot of data concerning our export markets, we do not really know how to use it in export sales forecast development. |
| x3 | We have no problems in finding personnel with expertise in forecasting export sales. |
| x4 | A major barrier to developing sound export sales forecasts is lack of relevant information. |
| x5 | The costs of obtaining data useful for export sales forecasting purposes are often prohibitive. |
| x6 | There is a lot of support from top management when it comes to export sales forecasting. |
| x7 | Export sales forecasts are always prepared in a hurry, as our personnel are busy with other work. |
| x8 | We have all the computer support we need for developing export sales forecasts. |
| x9 | The people involved in export sales forecasting have a lot of knowledge about our export markets. |
| x10 | The real problem in obtaining data useful for export sales forecasting is identifying the relevant sources rather than costs. |
| Reflective Indicators Used in MIMIC Model | |
| y1 | Developing export forecasts is more difficult than preparing forecasts for the home market. |
| y2 | The preparation of forecasts for the home market is less costly than for our export markets. |
| Export Sales Forecast Performance Indicators | |
| y3 | Overall, we are as good in forecasting export sales as any firm in our industry. |
| y4 | Compared to our competitors in export markets, our export sales forecasting capability is superior. |
Notes: All items are scored as follows: 5 = “strongly agree,” 4 = “agree,” 3 = “neither agree nor disagree,” 2 = “disagree,” 1 = “strongly disagree.”