
Abstract
Although brand ratings capture the favorability of brand associations, they often do not enable marketing managers to disentangle brand-specific associations from other effects. In this article, the authors present a decompositional model for analyzing brand ratings that addresses this nagging problem and provide insights for understanding the sources of brand equity. Starting with consumers' perceived level of a brand on an attribute, the authors decompose the rating into two components: brand-specific associations and general brand impressions. Brand-specific associations refer to features, attributes, or benefits that consumers link to a brand and that differentiate it from the competition. General brand impressions refer to general impressions about the brand that are based on a more holistic view of the brand. In this article, the authors focus on two principal issues: (1) How can the sources of bias that may be present in brand ratings be disentangled? and (2) Do these putatively biasing effects, if present, have any managerial implications for brand equity? The authors demonstrate the properties and advantages of the model in the context of three empirical applications.
It's great for our brand to have the highest ratings on all of the attributes that we track; however, though the brand is indeed the market leader, the brand group realizes that it does not have a superior positioning on all dimensions. Moreover, this coupled with the fact that the attribute correlations, although high, are flat makes it very difficult to read competitive brand strength. It appears that these ratings reflect more than just the extent to which a brand delivers on an attribute.
—Mario Inostroza M., Geremte De Planificacion E., Investigacion De Mercado, Coca-Cola, Chile
It appears that this brand manager believes that there may be something in a brand rating other than the brand's specific performance on an attribute that produces favorable biases. 1 And though perceptual brand ratings have provided valuable competitive diagnostics, sentiments like those expressed by this brand manager reflect a frequent source of consternation in analyses of such data.
We use the term “brand rating” to refer to the judgment of the level of a brand on one or more attribute or benefit statements; that is, a consumer's perceived performance of a brand on an attribute.
Table 1 illustrates the typical problem, showing perceptual brand ratings collected in three commercial marketing research studies. Rows designate attributes, and columns designate brands, which have been arranged in descending order of their market penetration. The first part of Table 1 presents perceptual brand ratings for five branded paper towels collected in the United States, the second part of the table presents perceptual ratings for five brands of juice drinks collected in the United Kingdom, and the third part of the table presents perceptual ratings for five washing machine brands collected in Argentina. Although the data come from markedly different product categories, populations, and cultures, there are two points of consistency: (1) The percentage of consumers that associates a particular attribute with a particular brand varies across brands, and (2) the percentages tend to decrease steadily from the most to least popular brands. As we discuss subsequently, brand ratings exhibiting these characteristics provide essentially the same information as a global brand evaluation; consequently, if a brand manager wanted to implement programs to change brand perceptions, there is little information contained in the brand ratings to indicate which particular end-benefits should be emphasized—in short, the brand ratings lack denotative diagnosticity.
BRAND RATINGS

Notes: Numbers give top two-box percentages. PL = private label. JD = juice drink.
The empirical finding of a monotonic relationship between market penetration and favorable brand ratings has been reported by others (see Barwise and Ehrenberg 1985) and presents two principal dilemmas, which are illustrated in Figure 1. Figure 1 shows principal component linear biplots (see Gower and Hand 1996) for the rating data in Table 1. As depicted in Figure 1, each set of brand ratings can be adequately represented by a single dimension. In each product category, the first dimension accounts for more than 90% of the variation, and all attributes have the same orientation with directional cosines of less than 5°. 2 Thus, brand ratings can indicate which brands are most liked but provide little information on the reasons why, since the first dimension is exclusively evaluative, providing only connotative meaning (see Dillon, Mulani, and Frederick 1984; Holbrook and Huber 1979). Moreover, the pattern of responses depicted in Table 1 generally yields interattribute correlations that are consistently high for all brands, and therefore the unique effects of an attribute on purchase intentions or choice cannot be determined. With highly collinear ratings, interpretation is again extremely difficult.
In light of the high correlation of each attribute with the first dimension, no attribute vectors are shown in Figure 1.

PERCEPTUAL SPACE: BRAND POSITIONS AND EXPLAINED VARIANCE (%)
Research Objectives and Contribution
Because brand ratings are intended to capture brand associations, they provide important fodder for developing strategic and tactical initiatives, especially for tracking own and competitive brand strengths and weaknesses and more specifically for measuring the equity that may have accrued to a brand. Most behavioral models of brand equity emphasize the importance of brand knowledge and brand associations; for example, Aaker (1991) considers brand associations to be one of five components of brand equity, along with brand loyalty, awareness, perceived quality, and proprietary brand assets. And brand knowledge and associations play the key role in Keller's (1998) brand equity framework. However, the belief that a brand rating contains something other than the brand's specific performance on an attribute points directly to the presence of some sort of perceptual distortion mechanism. In other words, responses to, say, “How well does Crest prevent cavities?” are biased or, at best, contain other sources of variation. As such, although brand ratings capture the favorability of brand associations, they often do not enable marketing managers to disentangle brand-specific associations (BSAs) from other effects, such as biases.
In this article, we present a decompositional model for analyzing brand ratings that addresses this nagging problem and provides insights for brand equity. Starting with a consumer's subjectively perceived performance of a brand on an attribute, we decompose the rating into two components: BSAs and general brand impressions (GBIs). The term “BSAs” refers to features, attributes, or benefits that consumers link to a brand and that differentiate it from competition. The term “GBIs” refers to general impressions about the brand that are based on a more holistic view. This model offers several benefits. First, it can accommodate brand ratings that are typically collected in customer tracking surveys. Second, the model provides information about the extent to which a brand has achieved superiority or “ownership” of specific benefit dimensions. A larger BSA component on an attribute would indicate stronger BSAs, and a larger GBI component would indicate that holistic impressions are playing a primary role in shaping brand ratings. Third, the BSA and GBI component scores can be used to investigate the relative role of each component in shaping global brand attitudes, purchase intentions, or choice. 3 Finally, the model can provide insights into which attributes are strongly held by consumers even when the within-brand ratings are highly correlated.
By “global brand attitude” we mean a consumer's overall like or dislike for a brand, which is a function of both BSAs and GBIs.
Our focus is on two principal issues: (1) How can the sources of bias that may be present in brand ratings be disentangled? and (2) Do these putatively biasing effects, if present, have any managerial implications for brand equity? In the next section, we present the backdrop and conceptual framework for our model. We present the model and its pros and cons and then demonstrate the benefits of the proposed model in the context of three empirical application settings. We conclude with a discussion that focuses on managerial implications of separating sources of variation that influence brand ratings.
Background and Conceptual Framework
Let xnji denote the rating of a representative consumer, denoted by the subscript n, to an evaluative question that pairs the ith attribute with the jth brand. Ideally, responses captured in xnji should reflect only the true association between brand j and attribute i for consumer n and any variation due to random measurement errors or idiosyncratic systematic biases; in other words,

where τnji denotes the “unbiased” perception of brand j on attribute i, and εnji represents a component that includes random errors of measurement and any idiosyncratic systematic biases. If we further assume that E[εnji] = 0, it follows that

However, if the brand rating xnji contains systematic biases, then E[εnji] ≠ 0, and Equation 1 can be rewritten as

Now, because E[ε′nji] = 0,

and the effect of any bias, if present, is to change the observed measurement from xnji, the unbiased perceptual rating of brand j on attribute i, to some other quantity, or scale value, say, x′nji.
Accepting that a brand rating may contain something other than the brand's perceived performance on an attribute raises two questions: (1) What are the origins of such effects? and (2) What processes might be operating when consumers are asked to rate brand attributes? These questions are addressed next.
Common Sources of Brand Rating Biases
There are several possible explanations for the discrepancy between x′nji and xnji. Two of the more commonly discussed sources of bias involve response style and halo error. 4 Response style biases refer to the tendency for people to systematically favor response categories in some particular part of the scale. Some people, for example, may be reluctant to express their true negative feelings and therefore avoid using scale categories associated with inferior or unsatisfactory evaluations. Response style biases result in a simple displacement of the response in a particular dimension. 5
Brand-specific effects (see Srinivasan 1979) and nonattribute- and attribute-based sources of brand equity (see Park and Srinivasan 1994; Russell and Kamakura 1993) have also been discussed in the context of possible sources of variation in brand ratings.
Historically, row centering has been used to purge response style biases. Ipsatizing a data matrix is not without its problems (see Clemans 1956), however. In particular, ipsatizing will remove all elevation in the data, regardless of its source. Therefore, the role such biases play in shaping consumer attitudes, choice, or brand equity cannot be assessed with this procedure. More recently, Rossi, Gilula, and Allenby (2000) have described an interesting Bayesian modeling alternative to ipsatization.
Halo error refers to the classic case in which an overall like or dislike (i.e., affect/attitude) toward an object or person colors evaluations of that object or person in terms of specific characteristics. Three characteristics of halo-laden data are consistently noted: (1) a person's tendency to rely on general impressions when giving a rating (Borman 1975), (2) a person's inability or unwillingness to distinguish among key dimensions when giving a rating (DeCotiis 1977), and (3) a person's tendency to give the same rating on possibly many dimensions (Bernardin 1977). In this scenario, for a given consumer, the systematic bias component appearing in x′nji is not simply a function of the rating scale being used but varies in magnitude with the brand being evaluated.
Behavioral Processes Underlying Ratings
The notion that a brand attribute rating may contain bias is consistent with the behavioral processes underlying how consumers form brand ratings. The prevailing view of how consumers make attribute judgments relies on what is stored in memory (Lichtenstein and Srull 1985; Lynch and Srull 1982). According to associative network models (Anderson 1983), memory for a concept consists of a network of nodes and linkages among these nodes. The nodes represent concepts (e.g., brands or attributes), and linkages represent the relationships among the concepts. In the context of brands, consumers may have a brand node with a variety of associations linked to that node (Keller 1998), including attributes, usage occasions, benefits, and attitudes. When asked to rate a brand on a specific attribute, consumers may retrieve the brand and attribute information in memory as the brand node is activated, leading to activation of attribute nodes. If information on a particular attribute is unavailable, consumers will need to compute it from other attributes of the brand or from the overall brand impression.
Thus, consumers can retrieve brand-related information from memory, compute a brand rating on the basis of external information available at the time of judgment, or do some kind of mixed retrieval–computational process in which some information is retrieved and some computed. The specific process adopted is likely to depend on factors such as brand-related experience (Alba and Hutchinson 1987; Lynch and Srull 1982). Both retrieval and computational processes are subject to biases, such as context effects (for details, see Schwarz and Bohner [in press]). 6 For example, certain information may be more salient in the judgment context, or earlier attribute ratings may influence later ones. These biases may account for sources of variation in a brand rating that are not due to attribute-specific information.
We thank a reviewer for pointing us to this research.
Our Conceptual Framework
All the processes we have discussed provide support for the two sources of effects in a brand rating: One component may be due to specific attribute information, whereas the other component may be due to nonattribute information and more closely related to overall global brand impressions. The component of a brand rating that is driven by global impressions of the brand will be identified as GBIs, and the part of a brand rating that reflects a truer impression of the actual performance of the brand on an attribute will be identified as BSAs. In terms of an associative network memory model, because BSAs represent knowledge of brand features, attributes, or benefits, BSAs are likely to reside in the attribute node. In contrast, GBIs, which represent overall impressions, are likely to reside in nonattribute nodes.
Following this line of reasoning, the decomposition of x′nji takes the following form:

where τnji represents BSA effects and Bnj represents GBI effects. Both τnji and Bnj are directly unobservable, latent constructs. If τnji is assumed to represent a single component measuring unbiased perceptual rating variation alone, it can be written as

where ξni denotes consumer n's score on the BSA component for the ith attribute, and αji gives the weight (i.e., partial regression coefficient) of x′nji regressed onto attribute i's latent BSA component. Similarly, for a single brand, we can express Bnj as follows:

where ξnj denotes consumer n's score on the GBI component for the jth brand, and αj gives the weight (i.e., partial regression coefficient) of x′nji regressed on brand j's latent GBI component. Thus, the ξs give component scores that reflect the extent to which a consumer uses BSAs or GBIs in making a brand rating (i.e., the consumer's position on each latent component), whereas the as give the impact of each BSA and GBI component on a brand rating.
Introduction of the latent components (ξni, ξnj) and corresponding weight coefficients (αji, αj) provides a general mapping framework for decomposing the observed measures x′nji such that the BSA components depend only on the attribute and the GBI component depends only on the brand. Combining Equations 5, 6, and 7, we can write

Decomposing Brand Ratings
Let
Model Structure
To understand how the decomposition is undertaken, consider a simple illustration in which consumers rate two brands on two attributes; that is, each consumer is asked to perform four brand ratings. Let

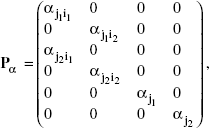
define a design matrix having q = ab + b columns and p = ab rows, in which the first four columns reference attributes and the last two columns reference brands; most important, notice that any row of A contains at most two nonzero elements. If we collect the partial regression coefficients αji and αj in Pα having q rows and m = a + b columns such that
then the decompositional model can be expressed as
where Ξ denotes the (n × m) vector of latent component scores (ξi1, ξi2, ξj1, ξj2). Writing Ξ = (Ξi|Ξj) to distinguish the components associated with BSA (i.e., attributes) from those associated with GBI (i.e., brands), under the basic form of our model, we impose the constraints that all component scores are mutually uncorrelated; that is, Ξ′iΞj = 0, Ξ′iΞi = 0, and Ξ′jΞj = 0, which means that Ξ′ Ξ = 0.
Estimation
The estimation method we propose relies on an alternating least squares algorithm (see, e.g., de Leeuw, Young, and Takane 1976), which permits constraints on specific parameters. Technically, the model falls under the umbrella of constrained components analysis (CCA). The estimation procedure updates Π and Ξ alternately until convergence of the loss function. The updates are chosen such that they minimize the loss function for a given set of parameters, while the other set is considered fixed. Essentially the same algorithm has been used elsewhere by Takane, Young, and de Leeuw (1980). A similar algorithm was also used by Kiers, Takane, and ten Berge (1996). The solution involves minimizing ||X - ΞΠ′||2 subject to the constraints that (1) certain elements of Π are zero and (2) the brand-induced effects are uniform (i.e., equality constraints on the within-brand loadings appearing in the last b columns of Π). The procedures used for updating Π if Ξ is considered fixed can be framed as a constrained linear regression problem. The general procedure for updating Ξ if Π is considered fixed involves a singular value decomposition and an orthogonal rotation to congruence with the constraints imposed (Cliff 1966).
Model Forms, Interpretation, and Fit Assessment
The basic CCA model, consistent with the development given previously, imposes three different sets of constraints: First, it imposes constraints on the parameter matrix of loadings to ensure the structure of free and fixed parameters as reflected by the ones and zeros shown in the design matrix A. These constraints result in Π having only two nonzero elements per row, corresponding to the BSA and GBI loadings. Second, it imposes constraints to ensure that the numerical values of αj vary only by brand and not by attribute, which means that the brand-induced effects are uniform and consistent with the operation of a GBI. To accomplish this, within-brand equality constraints are placed on the freely estimated parameters appearing in the last b columns of Π. Third, orthogonality constraints are imposed on the BSA and GBI components to ensure that all component correlations are mutually uncorrelated. With these constraints in place, the variance–covariance matrix of brand ratings, Σx, takes the form

and xnji has a simple and straightforward variance decomposition:

From Equation 11 we find that the total variation in a possibly biased perceptual brand rating is apparently decomposable into three components: (1) variation due to differences in attribute component scores among consumers, (2) variation due to differences in the systematic effect induced by the jth brand, and (3) variation due to idiosyncratic biases and random error. Three important aspects of this decomposition warrant discussion: First, only the latent attribute and brand component scores are uniquely decomposable; that is, ξi is a vector of scores whose variation across consumers is attributable solely to the ith attribute, and ξj is a vector of individual-specific brand-induced effects. Second, the weight coefficients (i.e., loadings) αji will, in general, assume different values depending on which brand rating is being considered. Numerical values for these coefficients vary as the levels of the subscripts j and i change, which should be the case because these coefficients reflect the relative position of the brand on an attribute component. Third, numerical values of αj vary only by brand and not by attribute, which means that the brand-induced effects are uniform and consistent with the operation of a GBI.
The proposed CCA model provides several interesting features. First, by comparing αj (across brands), we can assess whether holistic global impressions affect brands differentially, and by comparing αji and αj, we can determine whether brand j's rating on attribute i is driven more by BSA or GBI. Second, loadings have a variance interpretation. Therefore, we can examine how much variance is accounted for in each brand rating separately, because

Stated somewhat differently, [αji]2 and [αj]2 give the percentage of variance in xnji that is due to BSA and GBI components, respectively. 7 Third, as mentioned previously, using the CCA model ensures that component scores are related intrinsically to the model estimated. Thus, we can “compute,” as opposed to estimate, component scores so that they reflect the specific structure of the model and the imposed constraints, if any. For this reason, we can use component scores without ambiguity when assessing the influence of BSA and GBI in driving purchase likelihood or reaction to new concepts or products. Moreover, as demonstrated in the empirical applications that follow, when we have computed component scores, we can use them to construct BSA-derived perceptual spaces as well as to investigate the sources of brand equity. We say more about this issue in the following sections. Finally, we can assess model fit by examining the total variance explained by the model. The ability to assess model fit through the amount of variance explained provides a convenient way to assess alternative model forms qualitatively and quantitatively. For example, in the empirical applications, we use Fisher's Z-transformation test of the null hypothesis that two models yield identical multiple correlation coefficients to assess the issue of alternative model fit.
Therefore, [∈nji]2 can be viewed as the “unfitted” variance and in this sense is similar to the concept of measurement error, which is useful in identifying faulty items.
The discussion so far has focused exclusively on the basic CCA model for which all components are mutually uncorrelated; that is, Ξ′Ξ = 0. Because of differences in product category knowledge or ecological attribute correlations, BSA component scores may be correlated. 8 Thus, in the empirical applications and simulation experiments reported subsequently, we also allow BSA component scores to correlate; that is, Ξi′Ξi ≠ 0. We refer to this model form as the extended CCA model. 9
We thank a reviewer for raising this issue.
In principle, we can also permit the GBI component scores to correlate. However, we do not report results for this specification, because in the context of this problem setting, freeing up correlations among the GBI components would have limited diagnostic or managerial relevance; that is, such correlations would tell us nothing more than the subsets of brands whose general brand impressions covary.
Why Not Confirmatory Factor Analysis?
According to Equation 9, we can write xnji = αjξnj + εnji, and thus the underlying response of any consumer to a series of brand rating questions can be represented as an additive function of two sets of latent factors. As such, the structure of the model and corresponding parameters could be estimated with a confirmatory factor analysis (CFA) model (see Walker et al. 1994). To show this, we need simply to write the variance–covariance matrix of brand ratings as Σx = ΛϕΛ′ + Ψ. In this parameterization, the factor loading matrix has the pattern structure

where λj is an (a × 1) vector of brand factor loadings for the jth brand factor,
In terms of our CCA model, the λ elements correspond to αj, and the elements contained in each Ai correspond to αji.
We believe that for this class of models there are some significant advantages to using CCA rather than CFA techniques. First, there is strong and pervasive evidence that fitting CFA models with this particular structure is frequently plagued by inadmissible parameter estimates and identification problems. For example, Brannick and Spector (1990), Marsh and Bailey (1991), and Wothke (1987) find inadmissible or unidentified models occurring at very high frequencies in reanalysis of published data sets and in simulation studies. Because unique variances do not enter into the CCA model specification and identification is strictly a function of the rank of Π and is due to the availability of simple sufficient conditions for the uniqueness of II, it is easier to establish identification. 11 Second, CCA models always converge, albeit to a possible local maxima. In contrast, applying CFA models with this structure is often difficult because the iterative estimation process will usually approach an intermediate solution at which the matrix of second derivatives of the fit function is rank-deficient and estimation cannot continue. Model estimates, therefore, are extremely sensitive to the choice of start values. In our experience, good starting values will be needed for convergence in any reasonably large-scale problem. Third, because CCA models are obtained by fitting the full data matrix rather than the correlation matrix, the models do not suffer from offending estimates, such as negative variances (Heywood cases) and/or factor correlations outside of the range (-1, +1). Finally, component scores can be calculated in a straightforward manner and correspond exactly to the structure imposed on loadings and factor correlations. In contrast, it is well known that factor scores suffer from an inherent indeterminacy; and because factor scores, in a strict sense, cannot be calculated, estimation methods, of which there are several, must be used (see Lastovicka and Thamodaran 1991). Potentially more serious, not all of these methods will preserve the structure imposed on the theoretic factors, and if factor scores are to be related to some external variable, as is the case here, additional complexities arise.
Because of the structure imposed, it can be shown from Corollaries 2.3–2.5 of Millsap (1992) that both the basic and extended CCA models fulfill the rank conditions sufficient for identification.
This is not to say that CFA models of this genre are always unidentified in the population; for example, the work of Anderson and Rubin (1956) and Shapiro (1985) suggests that model parameters with four or more brands and four or more attributes will “almost always” be unique. And with large sample sizes, random errors of measurement, and a correctly specified model, a CFA model will, for all intents and purposes, provide a perfect fit. In addition, it should be noted that components analysis has been shown to produce loadings that are biased upward and intercomponent correlations that are biased downward (Widaman 1990, 1993). Finally, components analysis models do not in a strict sense impose a presumed underlying structure on the data on the basis of some theoretical model. Instead, components analysis seeks to provide a good description of a data set, in terms of variance accounted for, under a particular model representation. We will investigate the quality of the estimates obtained with our CCA model and its ability to capture a known (CFA) structure in the next section.
CCA Performance
In this section, we address two questions: (1) Can the proposed CCA model capture data generated from a known (CFA) structure? and (2) What is the quality of the estimates obtained under the CCA model? To answer these questions, we perform a small simulation experiment.
Data generation
We generated data under a CFA model with known population parameters. We consider a problem setting that is defined by five brands and four attributes. Each data set consists of n replicates of the 20-dimensional
We generate ten data sets for each cell of the design. We examine three different sample sizes (50, 200, and 500). We generate data sets under a loading matrix A with the following nonzero population values: For each (a × 1) vector of brand factor loadings, we set λ1 = [.4,.4,.4,.4], λ2 = [.3,.3,.3,.3], λ3 = [.2,.2,.2,.2], λ4 = [.7,.7,.7,.7], and λ5 = [.8,.8,.8,.8], and for each (a × a) diagonal matrix of attribute factor loadings we set nonzero elements to
Results
The following summarizes the findings pertaining to the relative performance of the CCA model. Whenever possible, we provide results for the CFA model for comparison purposes.
Ability to detect the correct model
In Table 2, we provide summary results on the ability of the basic and extended CCA models to find the correct model for Case 1 and Case 2 data sets. Elements in the table provide average fit values, expressed as a percentage of the total variance explained. Notice that the extended CCA model provides better fits in terms of explained variance than the basic CCA model in all conditions; this is because the extended CCA model fits more parameters (component correlations). However, because differences in average fit between the basic and extended CCA models are nonsignificant for Case 1 data sets, for reasons of parsimony the basic CCA model would be chosen as adequately representing the underlying structure. In contrast, for Case 2 data sets, the extended CCA model provides a significantly better fit than the more restrictive basic CCA model, and so the former would be chosen as better representing the underlying structure.
MODEL SELECTION PERFORMANCE: VARIANCE EXPLAINED (%)

Δ = EV (extended) - EV (basic).
Statistically significant at p ≤ .01.
Computational problems
For CCA models, the frequency of local optima can be a serious estimation problem. For CFA models, nonconvergence and offending estimates can be the primary sources that can plague estimation.
In estimating the CCA models, we initiated five random starts and retained the best-fitting solution for reporting. We define a solution as locally optimal if the fit function value differs more than .01 from the global minimum obtained from starting the algorithm with the population parameters. Averaging over the five random starts, we found only 2.3 (of 30) local minima for Case 1 data sets and only 2.9 (of 30) local minima for Case 2 data sets.
In estimating the CFA models, we used five multiple starts (one automatic, four random) and retained the best-fitting solution for reporting. Overall, across the 60 data sets, the corresponding CFA models yielded inadmissible solutions 38% of the time (23 of 60), generating particularly poor results whenever n = 50, and improper solutions in almost 47% (28 of 60) of the cells.
Parameter recovery
CCA model parameter recovery results are shown in Table 3. Elements in the table give the mean absolute error (MAE) and mean absolute percentage error (MAPE) between the CCA model parameter estimates and their population counterparts. For Case 1 data sets, results only pertain to elements of Λ, because ϕ1 = I. For Case 2 data sets, results pertain to elements of Λ and component correlations in ϕ2. As shown in Table 3, MAEs for Case 1 data sets range between .077 and .103, and corresponding MAPEs range between 8.1% and 11.1%. For Case 2 data sets, Λ MAEs range between .074 and .091, and corresponding MAPEs range between 7.7% and 9.9%; ϕ2 MAEs range between .061 and .084, and corresponding MAPEs range between 6.7% and 8.6%. With respect to the occurrence of systematic biases, we counted the number of biased upward/downward parameters. There are 25 freely estimated attribute loadings in Λ and six component correlations to estimate in ϕ2. The average number of upward-biased attribute loadings was 14.1 (of 25); in the worst cell, 17 of the 25 attribute loadings were biased upward. With respect to the ϕ2 parameters, on average we found 4.2 (of the six) component correlations to be downward biased.
RECOVERY PERFORMANCE: MAE AND MAPE

It is also of interest to compare these results with the appropriate CFA model counterpart. Direct comparisons are, however, complicated by the high occurrence of inadmissible and improper CFA solutions. Table 4 shows a better/worse comparison between CCA and CFA models for only those data sets in which the CFA solution was admissible. Elements in Table 4 give the number of times (of 10) that an admissible CFA solution was obtained and, for these occurrences, the number of times for which the CCA model or the CFA model led to the best recovery—that is, less biased estimates, where we take the absolute difference between the parameter estimate and its population value. Notice that the CCA model generally outperforms the CFA model. With respect to capturing the loadings, the CCA model consistently “wins” when sample sizes are smaller. For example, when n = 50, the CCA model yielded less biased parameter estimates in all cases in which the CFA model produced an admissible solution (6 of 6 and 3 of 3, respectively). When n = 500, the relative performance of the CFA model in recovering the population loadings improves; however, even in these cases, the CCA model does a better job in capturing factor correlations.
RELATIVE RECOVERY PERFORMANCE

Interpretation: Of the six admissible CFA solutions, the CCA model “won” (produced less biased parameter estimates) in all six cases.
Discussion
The simulation results suggest that the CCA models can be used as reliable alternatives for recovering underlying structures. Several aspects of the results warrant discussion. First, in general, there was not a dramatic decrease in CCA model performance in the presence of small samples, in contrast to the CFA model, which performed much better whenever n = 500 (see, e.g., the marked increase in the ability of the CFA to outperform the CCA model as sample sizes increase). Second, the CCA models were able to recognize the data structures correctly. Whenever the model and the data were consistent, the fit measure pointed to the correct model; in cases in which the data and the model were inconsistent, the extended model provided a statistically significant superior fit for Case 2 data sets and an indistinguishable fit compared with the basic model for Case 1 data sets. Third, as far as parameter recovery is concerned, the CCA models recovered population structures fairly well, especially in light of the small sample sizes considered; moreover, the CFA models in these situations are likely plagued by computational problems, and even when they are not, the results suggest that the CCA model can provide better recovery. Finally, generally speaking, Widaman's (1990, 1993) results on component biases were supported, though perhaps not to the extent expected; the number of biased upward loadings averaged a little over 14 (of 25), and the number of biased downward component correlations averaged just over 4 (of 6). 12
In general, our results are similar to those reported in other comparisons of CCA and CFA models (see Kiers, Takane, and ten Berge 1996).
Next, we present three empirical applications to illustrate the usefulness of the decompositional model for different marketing problems.
Empirical Application 1
In this study, we demonstrate how our approach to analyzing brand ratings can be used to understand the relative influence of GBIs and BSAs on brand ratings for a durable good, namely, automobiles. Our focus will be the moderating effects of brand familiarity and brand positioning. We propose that the relative influence (percent of variance accounted for) of BSAs versus GBIs on brand ratings will depend on brand-related experiences.
For consumers possessing high brand knowledge, BSAs will be stronger than GBIs for all attributes. For consumers possessing low brand knowledge, GBIs will be stronger than BSAs for all attributes. 13
We assume that the attributes under consideration are all relevant to the product category.
Consumers with high direct brand experience are likely to have greater brand knowledge and more complex brand associative networks than those with less experience (Alba and Hutchinson 1987; Mitchell and Dacin 1996). Their more complex cognitive structures enable them to make finer attribute performance ratings. Thus, consumers with high experience should have strong links between the brand node and attribute nodes, and their brand ratings should be driven more by BSAs than by GBIs. In contrast, consumers who have little or no direct experience with the brand should be more influenced by marketing communications (Mitchell and Dacin 1996), and their brand knowledge may contain no, few, or weak brand attribute nodes. If attribute nodes are absent or weak, BSAs should be minimal and GBIs will be stronger than BSAs.
To demonstrate this, we consider a situation in which the mean perceptual ratings of three automobiles by consumers with different brand-related experiences appear similar. Nonetheless, the knowledge underlying these perceptual ratings is different and depends on the nature of brand experiences.
Data
Brand ratings were collected from two groups of consumers who differed in their brand-related experiences. The low-experience group (n = 117) were undergraduate students with little to no brand-related experiences. The high-experience group (n = 158) were owners recruited from purchased owner mailing lists. For each of the three cars, Mercedes-Benz, Porsche, and Toyota, 300 questionnaires were mailed: 62 questionnaires were returned by Mercedes-Benz owners, 54 by Porsche owners, and 42 by Toyota owners. Both groups evaluated three automobiles with different brand positionings: the Mercedes S320, the Porsche 911, and the Toyota Camry. The Mercedes S320 represented a prestigious, comfortable, and luxurious automobile; the Porsche 911 represented a sports vehicle with power and pickup; and the Toyota Camry represented a reliable and high-value family car. Subjects evaluated the three brands on eight attributes (see Table 5), using a rating scale anchored by “one of, if not the best” to “poor.” To minimize confusion, the survey instrument contained a picture of each automobile.
AUTOMOBILES: MEAN RATINGS

Significant difference (p < .01) for brands between experience groups.
We present mean ratings for each brand on the eight attributes in Table 5. Notice that the mean ratings are consistent with the positioning of the three brands. Each brand receives the highest ratings on the attributes that are emphasized in its advertising and product claims. 14 Moreover, the brand images are consistent across levels of experience. The perceptual spaces for the low- and high-experience samples proved to be remarkably similar, and only a few of the mean ratings exhibit statistically significant differences between high and low experience. These differences are largely for the Porsche 911, which has the smallest distribution in the United States.
This is in contrast to the data presented in Table 1, for which the brand ratings were flat across attributes. As we indicate in our discussion of Table 1, we believe that flat brand ratings likely will be the rule rather than the exception, especially in fragmented categories (i.e., those with many brands) in which a few brands dominate in terms of market share or in categories in which the dominant brands have diffuse positionings.
CCA Results
CCA model forms were fit separately to each experience-level group. Models were also fit separately within the high-experience group to each owner type (Mercedes, Toyota, and Porsche).
Model fit
In general, all the CCA models provide good fits to the data. As discussed previously, the fit of a model can be assessed in terms of explained variance (EV), and model selection is based on Fisher's Z-transformation test. For consumers who are low in experience, the extended CCA model, which allows correlations among the attribute components, provided a statistically significant better fit than the basic CCA model (EV[basic] = 86.7%, EV[extended] = 92.4%, Δ = 5.7, p ≤ .01). For consumers who are high in experience, the extended CCA model did not yield a significantly better fit over the basic CCA model in any of the ownership groups. Thus, for consumers low in experience, we report results based on the extended CCA model, and for consumers high in experience, we report results based on the basic CCA model. 15
The extended CCA model can provide a significantly better fit than the basic CCA model under low or high experience, but for different reasons. With high experience, increased knowledge may lead to heightened perception of attribute correlations. With low experience, the extended model can also provide superior fit, if GBIs are high, because of the putatively indiscriminate but similar ratings (scores) given to attributes, much in the same way that high correlations appear in halo-laden data.
Variance decomposition
Although the means and perceptual spaces are largely equivalent across levels of brand experience, we expect that for consumers with high brand experience, BSAs would be stronger than GBIs, and the reverse would be true for consumers with low brand experience. Table 6 shows the proportion of variation in brand ratings accounted for by GBIs and BSAs across the two levels of experience. For consumers with high experience, BSAs account for a higher proportion of variance than do GBIs across all brands and attributes. For consumers with low experience, GBIs are stronger than BSAs across all brands and attributes. Moreover, the BSA component for less experienced consumers is small, accounting for at most 16.1% of the variance in any brand rating across the three automobiles. This suggests that these ratings are composed almost entirely of GBIs. The component correlations obtained under the extended CCA model support this interpretation as well. The component correlations are relatively flat, ranging in absolute value between .31 and .35, and show no denotative pattern.
AUTOMOBILES: VARIANCE (%) DECOMPOSITION
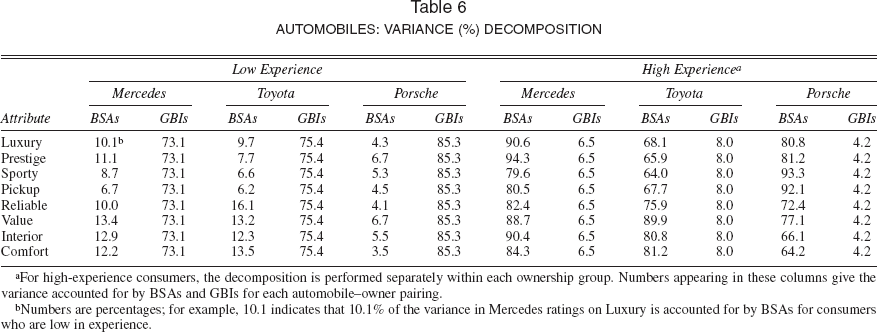
For high-experience consumers, the decomposition is performed separately within each ownership group. Numbers appearing in these columns give the variance accounted for by BSAs and GBIs for each automobile–owner pairing.
Numbers are percentages; for example, 10.1 indicates that 10.1% of the variance in Mercedes ratings on Luxury is accounted for by BSAs for consumers who are low in experience.
Table 6 also reveals the effects of brand positioning. In general, for consumers with high experience, BSAs are stronger for attributes on which the brand is well positioned than for other attributes. For example, BSAs account for more than 90% of the variation in Mercedes's ratings on luxury, prestige, and interior quality. High-experience consumers have developed stronger linkages between the brand and well-positioned attributes. In contrast, although low-experience consumers are most likely aware of brand-positioning strategies (e.g., through advertising), the attribute knowledge is not well formed enough to be stored as a BSA, nor are attribute component correlations distinctively denotative.
In summary, even though the mean attribute ratings of consumers with different levels of brand experience may be similar, the knowledge underlying those ratings is different. For high-experience consumers, brand ratings are based on BSAs, whereas for low-experience consumers, brand ratings are based on GBIs. In the next study, we use the CCA model to further investigate the effects of brand positioning on the components of a brand rating.
Empirical Application 2
The principal objective of the second empirical application is to show how a slight variation of the basic CCA model can be used to investigate whether a brand's positioning influences the relative importance of BSAs and GBIs in driving brand ratings. When a brand is well positioned on a particular attribute or benefit, that attribute or benefit is likely to be an integral part of the associative network for the brand.
The relative influence of BSAs and GBIs on brand ratings will depend on the extent to which the brand has developed a strong positioning on specific attributes.
Brand-building activities that result in strong positioning on specific attributes will enable consumers to retrieve BSAs more easily when they are asked to give brand ratings. In such cases, we hypothesize that more of the variation in the brand's rating on these attributes will be accounted for by BSAs than by GBIs.
Data
The data came from a commercially maintained national tracking panel. Panel members were asked to rate different brands of toothpaste. Three national toothpaste brands, Aquafresh, Colgate, and Crest, having distinctive positions within the category, are considered. Colgate's brand-building activities feature hedonic benefits, in particular, good taste and breath freshening, whereas Crest features preventive benefits, primarily cavity prevention and anti-plaque and anti–gum disease benefits. Aquafresh's position is somewhat less distinct in that it has featured multiple benefits related to tartar control and breath freshening. We focus on six attributes that reflect hedonic and preventive benefits. Hedonic benefits are captured by “leaves a good taste,” “freshens breath,” and “makes mouth/breath feel cool.” Preventive benefits are captured by “reduces tartar buildup,” “helps prevent cavities,” and “prevents gum disease.” Each attribute was operationalized in terms of a seven-point Likert-type scale anchored by “extremely poor” and “extremely good.” 16
Attributes were randomly rotated and respondents were instructed to rate each brand on an attribute before going on to the next attribute. Therefore, priming effects should not be a major source of bias in these brand ratings.
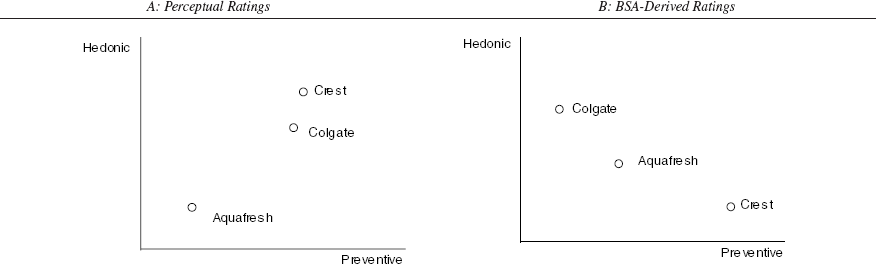
Figure 2, Panel A, shows principal component linear biplots. The perceptual brand space is constructed by restricting each attribute to load on its respective hedonic or preventive dimension. 17 Notice that instead of reflecting the positioning strategies of these brands, the map provides a unidimensional ordering of the brands that essentially reflects their relative market share at the time the data were collected. Crest, the market leader, dominates Colgate and Aquafresh on both the hedonic and preventive dimensions, and Colgate dominates Aquafresh. Thus, similar to the data shown in Table 1, the perceptual ratings provide an evaluative snapshot of the brands but lack clear denotative meaning.
A constrained components model was fit and brands positioned in space on the basis of their weighted component scores.
TOOTHPASTE PERCEPTUAL SPACES
CCA Results
Because each benefit dimension has three indicators, it was possible to fit a CCA model that allowed the influence of GBIs to seep differentially into hedonic and preventive ratings. To accomplish this, we relax the equality restrictions on all within-brand GBI loadings and instead require uniform loadings across all hedonic indicators and across all preventive indicators for each brand. In this way, we can assess whether the relative roles of GBIs and BSAs vary in relation to the attributes and benefits on which the brand is more or less well positioned.
Model fit
Both the basic and extended CCA models provided good fits; the basic model accounted for 89.1% of the total variance, and the extended CCA model accounted for 93.3%. Because a Fisher's Z-transformation test of the null hypothesis that both models yielded identical multiple correlation coefficients could not be accepted (p ≤ .05), we report results based on the extended CCA model. Attribute component correlations obtained under the extended CCA model revealed a pattern consistent with the underlying hedonic and preventive dimensions discussed previously. Hedonic attribute component correlations ranged between .59 and .65, whereas preventive attribute component correlations ranged between .65 and .69. Hedonic–preventive component correlations were low, ranging from .15 to .32.
Variance decomposition
Table 7 shows the proportion of variation in brand ratings accounted for by GBIs and BSAs. Notice that GBIs account for the same amount of variation within a benefit dimension, which reflects the constraints imposed. For Aquafresh, GBIs are relatively strong across both hedonic and preventive benefits, accounting for more than 50% of the variation in brand ratings. This suggests that consumers are retrieving general impressions about Aquafresh regardless of the attribute or benefit on which the brand is being rated. Furthermore, compared with Crest and Colgate, Aquafresh has relatively weak BSAs, which suggests the shortcomings of a dual positioning strategy. For Crest and Colgate, the variance accounted for by BSAs and GBIs supports the proposition on the role of brand positioning. Specifically, given Crest's marketing emphasis on preventive benefits, we expect that Crest's brand ratings on the hedonic dimension would be driven more by GBIs than BSAs. Indeed, GBIs are stronger for the attributes “leaves good taste in mouth,” “freshens breath,” and “makes mouth/breath feel cool.” Similarly, for Colgate, GBIs are stronger for attributes on which the brand is less well positioned, namely, “reduces tartar buildup,” “helps prevent cavities,” and “helps prevent gum disease.” Therefore, the relative importance of these sources of BSAs and GBIs is related to whether the brand has developed a strong positioning on the corresponding underlying benefit dimension.
TOOTHPASTE: VARIANCE DECOMPOSITION AND COMPONENT CORRELATIONS WITH BRAND LIKE/DISLIKE

Numbers are correlations.
Numbers are percentages; for example, 29.7 indicates that 29.7% of the variance in Aquafresh ratings on Tartar is accounted for by BSAs.
BSA-derived perceptual space
Figure 2, Panel B, shows the derived perceptual brand space constructed from the BSA component scores. In contrast to the perceptual space shown in Panel A, the BSA-derived perceptual space much better reflects the strategic positioning of these brands, and the position each brand owns is clear: Crest owns the preventive dimension but is inferior to Colgate on the hedonic dimension, Colgate owns the hedonic dimension but is inferior to Crest on the preventive dimension, and Aquafresh is positioned as a brand that offers moderate levels of both benefit dimensions—more hedonic benefits but fewer preventive benefits than Crest and more preventive benefits but fewer hedonic benefits than Colgate.
Relation to brand affect
Panel respondents also rated each brand on a seven-point like/dislike scale anchored by “extremely like” and “extremely dislike.” 18 The correlations of the component scores with the like/dislike measure should provide further insights into the relative role of BSAs and GBIs. For example, BSA component scores for attributes on which the brand is well positioned should be highly correlated with general brand like/dislike. In contrast, GBIs may have strong association with brand like/dislike for attributes on which the brand is less well positioned.
This question appeared in a different section from the brand rating questions.
The last two columns of Table 7 show these correlations. 19 For Colgate and Crest, BSA scores for attributes on which the brand is well positioned have the strongest correlations with brand like/dislike. General brand impression component score correlations with brand like/dislike are relatively robust for benefit dimensions on which each brand is less well positioned (hedonic in the case of Crest and preventive in the case of Colgate). This provides some external face validity for what GBIs represent and suggests that GBIs will likely work through benefits that a brand may not have explicitly featured. For Aquafresh, the most robust correlations are associated with the GBI component scores, consistent with the more prominent role that GBIs play in shaping Aquafresh's ratings.
We derived these correlations by performing a multivariate regression analysis in which we regressed BSA and GBI component scores on brand like/dislike scores.
In the next study, we extend the model to a different domain, brand extensions. In particular, we assess how well BSAs and GBIs in the parent category might predict preferences toward a brand extension, and in so doing, we investigate their relative roles as sources of brand equity.
Empirical Application 3
This study investigates consumer responses to a brand extension for a regional private label (PL). The core category is paper towels, and the extension category is scouring pads. We demonstrate that decomposing attributes of the parent brand is a useful way of assessing meaning transfer in the context of brand extensions and the role of BSAs and GBIs in building brand equity.
For consumers with high brand knowledge, BSAs for attributes on which the brand is well positioned will be more important in driving evaluations of the extension brand if the attribute is relevant in the extension category. For consumers with low brand knowledge, GBIs, as opposed to BSAs, will be more important in driving evaluations of the extension brand if the attribute is relevant in the extension category.
BSAs are likely to be associatively linked to attribute evaluations (e.g., cavity prevention is a good thing), which in turn are likely to be linked to a brand attitude node (e.g., I like Crest). Thus, for attributes that are relevant in the extension category, positive transfer effects should take place, and the brand should be able to leverage these linkages.
Data
Five hundred respondents rated a local/regional PL and several national brands of paper towels. For the purposes of this analysis, we consider Bounty and Brawny, two of the largest-share brands. Bounty has consistently claimed superior absorbency and strength, whereas Brawny has attempted until recently to own strength. The PL brands have promoted their price advantage. Four performance-related attributes are considered: (1) absorbency, (2) strength, (3) economy, and (4) good value for the money; the first two attributes reflect a functionality dimension, and the last two attributes reflect a price–value dimension. 20
Attributes were randomly rotated and respondents were instructed to rate each brand on an attribute before going on to the next attribute.
Through mock print advertisements, respondents were exposed to a PL brand extension to scouring pads. Along with the brand extension, respondents rated two national scouring pad brands on several attributes. They were also asked to indicate their intentions to buy. The purchase intention (PI) measure was collected on an 11-point scale anchored by “zero chance of buying” and “100% certain to buy.” The PL concept statement (storyboard) featured claims that focused on economy and good value for the money. Consistent with this positioning, the extension was priced at 20% below the two leading national brands. Additional claims featured strength by suggesting that the scouring pad could attack hard-to-clean jobs and could be used around the house as well as in the kitchen.
Figure 3, Panel A, shows principal component linear biplots. The perceptual space is constructed by restricting each attribute to load on its respective functional or price dimension. 21 Similar to the toothpaste data, the map provides a unidimensional ordering of the brands that reflects their market share standing rather than their strategic positioning. Bounty and PL, the two market leaders, dominate Brawny on both dimensions. Bounty, which has a slight market share lead over PL, occupies the dominant position.
As in the toothpaste study, a constrained components model was fit and brands were positioned in space on the basis of their weighted component scores.

PAPER TOWEL PERCEPTUAL SPACES
CCA Results
We imposed equality constraints for each benefit dimension separately with a view toward examining the role that positioning plays in determining the relative importance of BSAs and GBIs on brand ratings. Results are reported for core PL users and noncore PL users to investigate the moderating effects, if any, of brand-related experiences. 22
The PL core users are respondents who indicated that the PL is their favorite brand; noncore users are respondents who indicated that a brand other than the PL is their favorite.
Model fit
For both groups of consumers, the CCA models provide reasonably good fits in terms of explained variance (noncore: EV[basic] = 87.9%, EV[extended] = 89.4%, Δ = 1.5, p ≥ .10; core: EV[basic] = 91.8%, EV[extended] = 92.4%, Δ = .6, p ≥ .10). On the basis of Fisher's Z-transformation test, we cannot reject the null hypothesis that both models yield identical multiple correlation coefficients; therefore, all the results that follow are based on the basic CCA model.
Variance decomposition
Summary variance decomposition effects for both groups of consumers are shown in Table 8. The results are consistent with the hypothesized moderating effects of brand-related experience. For core PL users, BSAs have stronger effects than GBIs for both benefit dimensions; for noncore PL users, GBIs have stronger effects than BSAs for both benefit dimensions. For core PL users, BSAs' effects are stronger for the price–value indicators that reflect attributes on which the brand is well positioned. For noncore PL users, GBIs' effects are also stronger on the well-positioned attributes associated with price–value, which is consistent with the finding reported in the previous studies.
PL: VARIANCE DECOMPOSITION AND EXPLAINED VARIANCE IN PREDICTING PI SCORES

Numbers are percentages; for example, 75.4 indicates that 75.4% of the variance in PL ratings on absorbency is accounted for by BSAs for core users.
BSA-derived perceptual space
Figure 3, Panel B shows the derived perceptual brand space constructed from the BSA component scores. In contrast to the perceptual space shown in Panel A, the BSA-derived perceptual space again better reflects the strategic positioning of the brands. The PL dominates the other brands on the price dimension. Compared with Bounty, Brawny offers slightly better perceived functionality but is inferior to Bounty on the price dimension.
Brand extension effects
We now investigate how well the BSA and GBI components scores from the parent category predict PI for the PL scouring pad extension. Research shows that BSAs that are relevant to the extension category have a strong impact on attitude toward the extension, particularly for high-knowledge consumers (Broniarcyzk and Alba 1994). For less-knowledgeable consumers, brand affect has a stronger impact than do BSAs on brand extension evaluations. This suggests that for core users, price–value BSAs should be strong predictors of PI for the PL scouring pad, because these indicators are relevant in the extension category and account for a substantial amount of the variance in PL ratings in the parent category. For non-core PL users, price–value GBIs should better predict PI.
The last four columns of Table 8 show the variation in PI scores accounted for by the BSA and GBI component scores for core PL users and noncore PL users. Notice first that BSAs' effects on the price–value indicators are by far the strongest predictors of PI, accounting for almost 60% of the variation across core and noncore PL users (56.36% + 3.17%). For core PL users, approximately 61% of the variance in PI scores is accounted for by the components scores. For noncore PL users, components scores account for less of the variation in PI scores (approximately 27%), and BSAs account for only about 4% of the variation. Because noncore PL users have more advertising and other nonbrand usage-related experiences, GBIs' effects on the well-positioned price–value indicators explain more of the variation in PI scores than do BSAs' effects (23.04% versus 3.17%).
General Discussion
Our intention was to focus on two principal issues: (1) Can the presumably extraneous sources of bias that may be present in brand ratings be disentangled? and (2) Do these putatively biasing effects, if present, have any managerial implications for brand equity? To investigate these issues, we developed a framework that can help marketing practitioners identify the sources of variance contained in a brand rating. By unconfounding the influence of BSAs and GBIs on brand ratings, we examined several interesting relationships. Across three disparate product categories (automobiles, toothpaste, and paper towels), we found that the relative influence of BSAs and GBIs on brand ratings depends on both brand experience and positioning. For consumers who possess low brand experience, for example, GBIs appear to influence brand ratings through attributes on which the brand is well positioned, which suggests that brand-building activities can carry over with residual effects. We also examined the role of BSAs and GBIs in influencing brand ratings in an extension category. The evidence suggests that BSAs dominate GBIs in driving extended brand ratings in cases in which the brand is well positioned on benefits that are relevant in the extension category. Moreover, the importance of BSAs is even stronger for consumers who have had more direct brand-usage experience. Our results for consumers who have had less direct brand-usage experience suggest that GBIs will be more important in shaping brand extension ratings than BSAs, again for attributes on which the brand is well positioned and that have greater relevance in the extension category. Thus, brand equity can be leveraged through BSAs or GBIs.
The model can provide insights into brand equity that have both theoretical and managerial implications. According to Keller (1993), the nature and degree of customer-based brand equity is manifested through the favor-ability, strength, and uniqueness of brand associations stored in memory. Although brand attribute ratings capture the favorability of brand associations, they do not provide much information about the strength and uniqueness of associations. The CCA model presented in this article solves this problem by decomposing brand ratings into BSA and GBI components (and correspondingly distinct component scores). Thus, the model provides a mechanism to assess the strength and uniqueness of brand associations.
The first empirical application demonstrates the value of the model in capturing the strength of brand associations. Although the attributes of three automobile brands were rated equally favorably by consumers with high and low brand-related experience, the knowledge structures underlying the ratings were different across the two consumer groups. The attribute ratings of high-experience consumers had stronger BSA components, whereas those of low-experience consumers had stronger GBI components. The stronger BSA components of high-experience consumers reflect stronger attribute associations based on direct experience. The stronger GBI components of low-experience consumers reflect weaker attribute associations based on information conveyed by the brands' communication efforts. This insight into the strength of brand associations would not have been possible if we simply examined the mean ratings.
The second empirical application demonstrates the value of the model in capturing the uniqueness of brand associations—that is, whether the brand has a sustainable competitive advantage or unique selling proposition (Keller 1993). The value of our decomposition model is best illustrated through the positioning maps provided in Figure 2. The positioning map based on the overall brand attribute ratings (Figure 2, Panel A) merely provides a unidimensional ordering of the three toothpaste brands based on their relative market shares. However, decomposing the attribute ratings into BSAs and GBIs reveals the unique positioning of the three brands. In Figure 2, Panel B, which is based on the BSA-derived component scores, Crest is seen to own the preventive benefit dimension, and Colgate owns the hedonic dimension. Thus, the model shows that Crest's unique associations have to do with preventive benefits, whereas Colgate's unique associations are hedonic.
Finally, the third empirical application provides further empirical evidence that core brand associations can affect reactions to brand extensions. Purchase intentions for the PL paper towel brand extension were driven more by BSAs for consumers with high PL experience and more by GBIs for consumers with less experience. Our results suggest that in the paper towel category, the PL should be able to leverage its positioning on economy and price in the extension category by featuring these benefits. Thus, the brand extension may also reinforce the specific associations of this brand, nullifying any dilution effect (Loken and John 1993).
Returning to the problem described at the beginning of the article and illustrated by the data sets shown in Table 1, we argue that the model presented in this article can provide more information than a mere rating of a brand on an attribute. The modeling approach described previously enables marketers to assess the strength and uniqueness of brand associations, thereby showing whether current marketing activities are working as desired and where the brand may need to concentrate its activities. Thus, the model can help determine which attributes may need bolstering and which attributes are likely to survive competitive attacks (because they are strongly held). Perhaps the most important implication of this work is the recognition that brand-building activities can influence brand ratings in several different ways. The finding that BSAs for attributes on which a brand is well positioned strongly influence brand ratings and evaluations of brand extensions should be of some comfort to marketing managers and may well justify the enormous amount of resources devoted to building differentiated brand positioning. The apparent leverageability of a differentiated positioning should also be of particular interest. The finding that consumers with different brand-related experiences may have different decompositional structures with respect to the relative influence of BSAs and GBIs also raises some interesting possibilities. It appears that affect transfer will more likely operate for consumers who have less brand-related experience and for attributes on which a brand is well-positioned. Thus, we speculate that for the nascent user, brand communications first work through GBIs and then, with additional experience of a direct brand-usage nature, “transform” into BSAs. Further research should test this process more directly.