
Abstract
Research addressing the diffusion of successive generations of technological innovations has generally ignored the impact of marketing-mix variables. As a result, there have been several calls for the development of multiple-generation models that incorporate marketing-mix variables. The authors develop a model of first-time sales and subscriptions for successive generations of a technological innovation, which explicitly captures the effects of marketing-mix variables through a proportional hazards framework. The empirical analysis estimates the impact of price for two generations of cellular telephones in a European country. The results suggest that there are important substantive insights to be gained from the parameter estimates for this marketing-mix variable when intergenerational interdependencies are considered. For example, although the time path of the estimated price elasticities in a multiple-generation setting closely follows those reported previously for single generations, the authors find evidence of an important interaction in price response across generations. Therefore, empirical estimates in single-generation models may be missing an important part of the pricing equation.
One constant in the management of technology is change—it is virtually guaranteed that any given generation of technology will end up being replaced by a newer generation. In the case of video games, 8-bit systems were replaced by 16-bit and then 32-bit systems, and now 64-bit technology abounds; 128-bit systems are starting to make their appearance. Computer floppy disks have progressed from 8-inch to 5 1/4-inch to 3 1/2-inch disks. And so on.
Nowhere is this more evident than in the market for cellular telephones. An early generation of cellular telephones used the 450-MHz band and was later replaced by the next generation of analog systems, which used the 900-MHz band. Analog systems have almost been replaced by digital technology that possesses additional advantages, including a substantial increase in subscriber density and improved transmission clarity. The superiority of digital technology and the ability of manufacturers to lower prices has led to a 40% growth rate for sales of cellular telephones in Europe and a 25%–30% growth rate in the United States (Baker 1998). Although much of the academic research on the development of the cellular telephone industry has addressed issues related to pricing behavior (e.g., Geroski, Thompson, and Toker 1989; Parker and Roller 1997), the role of price in the development of successive generations of the technology has been largely ignored.
Pricing decisions for new products are closely tied to the development of the previous-generation product. For example, Padmanabhan and Bass (1993) suggest that the optimal pricing strategy depends on the degree of substitutability across the two generations. Similarly, although changes in price elasticity across a product's life cycle have been studied in a single-product new product diffusion context (e.g., Parker 1992; Parker and Neelamegham 1997), consumer sensitivity to price in a multiple-generation setting is likely to be influenced by intergenerational dynamics. Although there has been some previous theoretical research on optimal pricing across generations (Padmanabhan and Bass 1993), there has been no previous empirical work extending single-generation estimates of price response over time to successive-generation markets.
Since the pioneering work of Fisher and Pry (1971), several researchers have studied technological substitution, focusing on the share of the market captured by the new technology. More recently, researchers have extended this work to examine the diffusion and substitution of successive generations of technological innovations. For example, Norton and Bass's (1987) classic multiple-generation model addresses successive generations of dynamic random access memory chips. One deficiency of this line of research is the failure of these models to address the impact of marketing-mix variables properly. Although there is evidence that the Bass (1969) model works well without covariates (e.g., Bass, Krishnan, and Jain 1994), it is not at all clear whether this is true in the multiple-generation case. Accordingly, there have been several calls for the development of multiple-generation models that incorporate marketing-mix variables (Islam and Meade 1997; Mahajan, Muller, and Bass 1990).
In this article, we develop such a model and use it to assess the impact of price on two generations of cellular telephones in a European country. We note that though the sales process early on for many product categories (e.g., color televisions, microwave ovens) is characterized almost exclusively by first-time adoptions, many other product categories also contain a subscriptions component right from the start. For example, cellular telephones, cable/satellite television, and Internet access not only entail an initial adoption decision but also necessitate signing up for an ongoing subscription with a service provider. For example, although cellular telephone companies are obviously interested in signing up new customers (with the associated sale of handsets), they recognize that overall revenue is quickly dominated by ongoing customer subscriptions. In short, for industries in which a subscriptions component is present, both first-time sales and ongoing subscriptions matter. Therefore, the successive-generations model developed in this article not only considers first-time adoptions of a cellular telephone technology generation but also addresses ongoing subscriptions. Although our model is broadly applicable to products that contain a subscriptions component, an important caveat is that it would not be appropriate to apply such a model to product categories that do not contain a subscriptions component.
When addressing an industry characterized by ongoing subscriptions, researchers need to model both the new adoption and subsequent renewal processes very carefully—to understand ongoing subscriptions, researchers must first understand the underlying initial adoption process (because subscriptions are generated by first-time adoptions as well as ongoing renewals). Therefore, any model of subscriptions must be carefully built on a model of first-time adoption. As a result, we build a model of subscriptions that begins with a model of first-time adoptions and accommodates previous models from a single-generation setting (Bass 1969; Bass, Krishnan, and Jain 1994; Jain 1992).
We have two objectives in this research: (1) to develop an empirical model of successive generations of technological innovations that explicitly captures the impact of marketing-mix variables and (2) to use this framework to evaluate the role that a single marketing-mix variable (price) played in the development of successive generations within a specific product market (cellular telephones). Building on Jain's (1992) prior work in a single-generation context, we incorporate a proportional hazards (PH) framework in a model of first-time sales and subscriptions for successive generations of a new technology. In developing this framework, we do not attempt to develop a broad-based theory of individual behavior (e.g., as in Horsky 1990). Rather, because previous research has ignored the role of marketing-mix variables in a successive-generations framework, we develop the methodology presented here in a preliminary attempt to examine whether incorporating marketing-mix variables matters at all and to ascertain whether substantive insights can be gained from such an analysis.
Our results suggest that there are indeed important substantive insights to be gained from the parameter estimates when intergenerational interdependencies are considered. For example, although the time path of the estimated price elasticities in a multiple-generation setting closely follow those reported by Parker and Neelamegham (1997) for a single generation, we find evidence of an important interaction in price response across generations. Thus, single-generation models that are not able to account for these intergenerational interdependencies may be missing an important component of the impact of price over time.
A General Model of First-Time Sales and Subscriptions
We first present a general model of the diffusion of two successive generations of a new technology. Our objective in first presenting a general model is to develop a framework that describes the process of first-time adoption and the subsequent subscription/renewal process irrespective of functional form. We develop the model in such a manner that it addresses both first-time sales of a new technology (i.e., adoption) and overall subscriptions (for cellular service) in a given time period in the industry (cellular telephones) being studied here. In the subsequent section, we examine specific functional forms as part of the empirical analysis. Furthermore, we build on this general framework by including covariates within a multiple-generation model to assess the impact of marketing-mix variables on the evolution of the market (i.e., first-time sales and subscriptions) over time. 1
We develop our successive generations model from scratch, purposely not building explicitly on prior work by Norton and Bass (1987). The reason for this is that there is an inherent inconsistency in Norton and Bass's original specification when we attempt to derive the underlying first-time adoption model over multiple generations. Consequently, we begin “from the bottom up,” focusing first on adoptions and then on subscriptions. We are indebted to an anonymous reviewer for pointing this out.
Understanding and Decomposing Sales
Many product categories are characterized by both a hardware and an ongoing service component. For example, satellite television requires the purchase of a dish and receiver in addition to a subscription with a content provider; cellular telephones require the purchase of a handset in addition to a subscription with a cellular telephone provider. In such industries, it is particularly important to be precise on the meaning of “sales” used in any analysis. In the cellular telephone market, sales can be divided into sales of handsets and subscriptions.
Handset sales can be divided further into first-time sales (i.e., adoption) by consumers who are new to a given technology (e.g., analog versus digital) and replacement sales. We use the terms “sales,” “first-time sales,” and “adoptions” interchangeably to refer to the first-time adoption of a new cellular technology. “Replacement sales” refers to sales generated by consumers who are replacing a handset of one technology for another handset of the same technology. Although most diffusion models are concerned exclusively with first-time adoption, most industry handset sales figures contain a substantial handset replacement component. Therefore, it would generally be inappropriate to naively apply a first-time adoption model directly to industry-supplied handset data. In the model presented in this article, we develop an approach for estimating first-time adoption from subscriptions data; such an approach does not entail the often difficult task of estimating replacement sales directly from (handset) sales data. “Subscriptions” denotes the number of subscribers to the cellular service. As we discuss subsequently, it is important to distinguish between new subscriptions (corresponding to first-time adopters of the technology) and ongoing or renewal subscriptions (generated from renewals by prior adopters from previous time periods). We demonstrate that it is possible to derive estimates of both first-time sales and subscriptions using only subscriptions data. Consequently, we begin by building a model of first-time sales and subscriptions.
A General Model
Subscriptions are observed on a discrete time basis, so we develop our model using a discrete time formulation. Time intervals are of equal length, where the tth time period corresponds to the unit length interval (t - 1, t]. Let SUBSit be the number of subscribers to the ith technology generation in the tth time interval. In the case of two technology generations,

and
We can express this as follows:

and

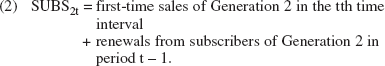
where Sit denotes the first-time sales (i.e., adopters) of Generation i in the tth time interval and RENit denotes the number of subscription renewals received in the tth time interval.
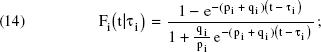
We examine the two components of subscriptions in turn, beginning with first-time sales and then focusing on renewals. Let Fi(t|τi) be the c.d.f. of the time to first purchase for technology Generation i, which is launched at time τi. (By definition, τ1 = 0.) In the absence of a second generation, the sales of the first generation is simply

where m1 represents the market potential of the first generation in the absence of a second-generation product (for a discussion, see Mahajan and Muller 1996, pp. 112–13).
Following work in a single-generation framework (e.g., Put-sis and Srinivasan 1999; Srinivasan and Mason 1986), one approach to modeling successive generation sales would be to specify Sit = mi[Fi(t|τi) - Fi(t - 1|τi)] for all i. However, one problem with such an approach is that it does not account for the interdependencies that exist across the generations. Ideally, any model of the evolution of the market for successive generations of a new technology over time would take into account the distinct nature of first-time adoption versus ongoing buying behavior (e.g., continued subscribing), as noted previously. Furthermore, the model should carefully take into account not only the interdependencies among the different adoption processes over time but also the impact of relevant covariates on each generation (cross-generation effects in particular).
Most of the previous research addressing the successive generations of a new technology has not allowed “leapfrogging.” For example, Norton and Bass (1987) assume that a second-generation product can only be adopted after the first-generation product has previously been adopted—a consumer cannot leapfrog or skip the first generation and buy the second-generation product. However, in many product markets, this is an unreasonable assumption. For example, after digital cellular telephones were introduced, many consumers skipped over the analog technology in favor of the new digital telephones. Therefore, we specify that when the second generation has been launched (at time τ2), a proportion (γt) of consumers who would otherwise have adopted the first generation in the tth time period (had the second generation not been launched) instead purchase the second generation. We refer to γt as the leapfrogging multiplier, because it captures the percentage of first-generation sales lost because of consumers leapfrogging past the first generation. Therefore, we can write sales of the first-generation product as follows:

where γt = 0 for t < τ2. This specification allows the first-generation sales to be cannibalized by the introduction of the second-generation product—where m1[F1(t|0) - F1(t −1|0)]γt is the amount of the first generation's first-time sales that is cannibalized by the second-generation product. Whether the incorporation of leapfrogging matters is an empirical question that we address subsequently.
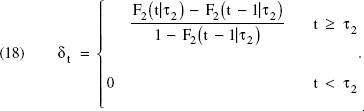
In contrast, first-time sales of the second generation contains three components in any given time interval. First, there are sales to consumers who were not in the market for the first generation but are attracted to the category by the second generation: m2[F2(t|τ2) - F2(t - 1|τ2)], where m2 captures the incremental sales potential of the second-generation product in the absence of a third-generation product. Second, there are the sales to consumers who would have adopted the first generation in the tth time period but instead purchase the second-generation product (see Equation 6): m1[F1(t |0) - F1(t −1|0)]γt. Third, a proportion δt of consumers who were subscribers to the first generation in the (t - 1)th time interval switch to the second generation in the tth time interval instead of renewing their subscription to the first generation (therefore we refer to δt as the switching multiplier): SUBS1, t- 1δt. We can write the sales of the second generation as the sum of the three components as follows:
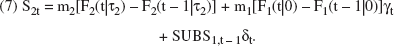
To address the subscriptions component—Equations 3 and 4—we must also specify the mechanism governing subscription renewals. Before the launch of the second generation, we assume that all first-generation subscribers renew their subscriptions to the service. However, following the launch of the second generation, a fraction (δt, as noted previously) of the subscribers switches to the next generation. Therefore, we can write the following:

where δt = 0 for t < τ2. As with the first-generation product before the second-generation launch, we assume that all second-generation subscribers renew their subscription to the service, because there is no competing, superior service 2 :
We can relax the assumption that all first- and/or second-generation subscribers renew their subscriptions by assuming that a fraction of Generation 1 and 2 subscribers do not renew, which we denote θ1t and θ2t, respectively. Thus, Equation 8 becomes REN1t = SUBS1, t - 1[1 - δt - δ1t], and Equation 9 becomes REN2t = SUBS2t - 1[1 - θ2t]. This would also require an appropriate specification for θ1t and θ2t, along with an additional assumption as to whether consumers who do not renew reject the technology forever or move back into the potential adopter pool.

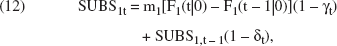
Substituting Equations 8 and 9 in Equations 3 and 4, respectively, we obtain

and

Finally, substituting Equations 6 and 7 in Equations 10 and 11, we get the following expressions for the number of subscriptions at any time interval:
and
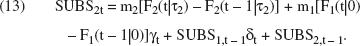
Thus far, we have expressed sales and subscriptions of the two generations in their most general form, without concern for specific functional forms. To estimate the subscriptions equations—Equations 12 and 13—we must specify the functional forms for the underlying adoption-time c.d.f.s, Fi(t|τi); the leapfrogging multiplier, γt; and the switching multiplier, δt, a task we undertake in the next section. Estimating first-time sales (i.e., new adoptions), however, is a bit more difficult. To understand this, note that estimating first-time sales directly through Equations 6 and 7 is often inappropriate. As previously discussed, available sales data typically include repeat purchases—rarely do data providers break out first-time versus repeat purchases for durable products. This is a particularly difficult problem with data of the type used here. Cellular telephones have a relatively short product life cycle, and subscribers to a given service/technology generation may replace their handsets several times while remaining with one service provider. Thus, fitting Equations 6 and 7 to handset sales data would provide misleading insights into the nature of adoption. Although it is important to build a model of subscriptions on a solid first-time adoption model, it may not be appropriate to estimate the first-time sales model directly. Fortunately, estimates of first-time sales over a given time interval can be back-calculated directly from the subscriptions equations— Equations 12 and 13. Specifically, given
Empirical Model Development
From the previous discussion, to estimate the sales and subscriptions model empirically, we need to specify the adoption-time c.d.f., Fi(t|τi); the leapfrogging multiplier, γt; and the switching multiplier, δt. At first glance, γt and δt may be viewed as model parameters to be estimated (e.g., Mahajan and Muller [1996] specify γt as a time-invariant parameter to be estimated). However, γt and δt are much more likely to be time-varying functions that depend on the underlying adoption parameters; therefore, we specify them here as functions of the adoption-time c.d.f.s. Consequently, their inclusion in a model of subscriptions does not increase the number of model parameters that are to be estimated. We now address specification of the adoption-time c.d.f.s, γt and δt, in turn.
Adoption-Time c.d.f.s
To begin, we follow the existing literature in a single-generation context to specify the underlying adoption process with and without covariates. We use the basic Bass (1969) model as the without-covariate base or null model. As noted previously, Bass, Krishnan, and Jain (1994) incorporate marketing-mix variables in a single-generation generalized Bass model (GBM), and we incorporate their model here as the with-covariate null model. Finally, we propose an alternative with-covariate formulation of the Bass model that uses the traditional PH approach. (This model is developed in detail in the Appendix and is closely related to the approach originally detailed for a single generation by Jain 1992.) Thus, the three models for the adoption time c.d.f.s considered in our empirical analysis are the Bass model:
the GBM:
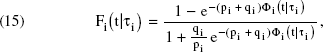
where ϕi(t|τi) = Σtj = τi + 1 exp[β′i xi(j)]; 3 and the PH model:
More formally, following Bass, Krishnan, and Jain (1994), we consider

where Λi(t|τi) is the integrated hazard function associated with Generation i, which is computed as Σtj= τi +1 {ln[1 -F0i(j - 1|τi)] - ln[1 - F0i(j|τi)]}exp[β′i xi(j)] with F0i(t|τi), the baseline adoption distribution, characterized by the Bass model (see the Appendix for derivation). Although we use the Bass model to characterize the baseline adoption distribution, we recognize that there are several alternative distributions that could be considered. We chose the Bass model here primarily for two reasons: (1) it is the baseline distribution that characterizes the only other article to incorporate a PH framework in a single-generation setting (Jain 1992), and (2) it provides a convenient link to the extant literature (which more often than not uses a Bass c.d.f.) more generally.
Leapfrogging Multiplier
In their pioneering work on successive generations, Norton and Bass (1987) assume no leapfrogging across generations; that is, γt = 0 ∀ t. We argue that it is extremely unrealistic to require every consumer to purchase an earlier generation first when a later generation is available. Similarly, we argue that it is unrealistic to assume that the rate of leapfrogging is constant over time and unrelated to the relative diffusion rates of the two generations (as in Mahajan and Muller 1996). Recognizing this, there are several alternative potential specifications for the rate of leapfrogging. We begin with one that uses the existing model in a realistic and parsimonious fashion. Specifically, we indicate the percentage of sales of the first generation lost to the second generation in the tth interval as follows:

This formulation assumes that if x% of consumers who adopt any generation in the tth time interval adopt the second-generation product, then x% of those who would otherwise have purchased the first-generation product adopt the second-generation product instead. For example, if the second-generation product has a low cumulative adoption rate (say, 5%) but is such a “hot” product that 80% of new adoptions in the tth time period are for the second-generation product, it seems reasonable that 80% of the sales that would otherwise have gone to the first generation should go to the second generation instead. Thus, the formulation leads to what we argue is the intuitive assumption that the rate of leapfrogging is proportional to the relative rate of sales growth of the two products.
Switching Multiplier
This same logic does not hold for consumers who switch from the first generation to the second generation; it is difficult to imagine a situation in which 80% of previous adopters of the first generation would switch to the second generation in a given period. In terms of switching behavior, it seems much more reasonable to assume that the proportion of first-generation adopters that switches to the second generation in the tth time period would be proportional to the overall potential adopting population that adopts the second-generation product during the tth time period (i.e., the probability of adopting the second-generation product in the tth time period, given nonadoption at the beginning of the time period). Simply stated, the faster the relative growth of the second-generation product across the potential adopting population, the faster we expect the migration to be from first generation to second generation. Therefore,
This formulation is also intuitive—it suggests that 100% of consumers who adopt the first-generation product will eventually shift to Generation 2 and that the rate of migration from Generation 1 to Generation 2 will be proportional to the overall sales growth of the second-generation product. As with the leapfrogging multiplier, we recognize that alternative formulations are available, but this seems to us to be a reasonable first attempt at an appropriate functional form. The improved fit generated by incorporating the leapfrogging and switching multipliers provides preliminary empirical evidence in support of this assertion.
In our empirical analysis, we test the relative fit of the three adoption-time c.d.f.s, Equations 14, 15, and 16, coupled with the two leapfrogging options, γt as specified in Equation 17 and γt = 0 as in Norton and Bass (1987), within the proposed framework for subscriptions, Equations 12 and 13. Note, however, that the focus of this research is the substantive findings regarding the impact of marketing-mix variables in a successive-generations setting. We present alternative specifications here not with the objective of engaging in a model-fitting exercise; rather, we present alternative models with the ultimate objective of developing an appropriate empirical model for examining the substantive and managerial phenomena of interest. Although we compare these specifications statistically in the next section, the focus of our discussion of the empirical results is the substantive and managerial findings discussed subsequently.
Empirical Analysis
Cellular Telephone Data
The data used in our analysis involve the number of subscribers to two generations of an analog cellular telephone technology, the Nordic Mobile Telephone (NMT) system, in a European country for the time period 1981–94. The first generation, called the NMT450, operates at a frequency of 450 MHz and was in operation over the whole time period; the second generation, called the NMT900, operates at a frequency of 900 MHz and was introduced in 1987. The data for both generations, when plotted over time, demonstrate the familiar S-shaped pattern.
In addition to these subscription numbers, we obtained data containing four yearly price measures: the average price per telephone, connection charge, average price per call, and annual rental; all measures were put into real terms by adjusting for annual inflation. These measures can be grouped into two categories, sign-up cost and usage cost. (For a detailed discussion of cellular telephone pricing over time in the U.S. market, see Jain, Muller, and Vilcassim 1999.) Sign-up charges are paid only once and are dominated by the cost of the telephone rather than the connection fee (at least for the period under consideration). Rather than use both sign-up and usage costs in our empirical work, we used just the sign-up cost, because the correlation between the two is .988 in the data for the European country studied here. Consistent with previous work in the literature on market response modeling in a competitive setting (see, e.g., Hanssens, Parsons and Schultz 1990; Wittink 1987), we constructed relative price variables for each generation's product. In this case, the price of Generation i is expressed as the ratio of the actual price of Generation i to the average market price in the category. 4
A priori, we expected advertising to exert an important influence on the adoption process. Accordingly, we collected data on advertising expenditure and incorporated it into the empirical analysis. However, the coefficient on this variable was statistically insignificant for all the model specifications reported here. Furthermore, nested hypothesis tests could not support its inclusion in the model. Consequently, we neither discuss advertising nor report the associated results.
Methodology, Overall Fit, and General Results
Using these data, we systematically compare several alternative models. Given the focus of our analysis on the intergenerational relationships between the two products, we formulated the model so that the baseline distribution (any one of three listed previously) has generation-specific parameters. However, Norton and Bass (1987, p. 1075) argue that the pi and qi should be constant across generations, and therefore assume pi = p and qi = q ∀ i in their empirical analyses. This assumption is relaxed by Islam and Meade (1997), whose empirical analysis demonstrates that the hypothesis of constant coefficients across generations can be rejected. In particular, their results suggest that pi = p but that qi ≠ q ∀ i.
To examine this in a with-covariate environment, we estimate two forms of each model: one corresponding to Norton and Bass's (1987) original hypothesis of constant coefficients across generations and the other corresponding to the alternative hypothesis of pi = p and qi ≠ q ∀ i. We call these specifications “equal” and “unequal,” respectively. Note that this issue is important because subscriptions of one generation are affected by the diffusion parameters from the other generation (see Equations 12 and 13). Similar parameters imply a similar diffusion path in the absence of marketing-mix effects; in contrast, different diffusion parameters imply that the price effects over time tell only part of the story. 5
We explored the possibility of generation-specific pi but consistently faced estimation difficulties (i.e., nonconvergence). Because Islam and Meade (1997), who also use data on the diffusion of multiple generations of cellular telephone technology, reject pi ≠ p and qi ≠ q ∀ i, we do not consider this alternative here. Furthermore, for the models based on the GBM and PH c.d.f.s, we explored the possibility of generation-specific price coefficients. However, estimation difficulties (i.e., nonconvergence) led us to estimate a common price coefficient across generations.
Previously we presented three possible models for the adoption-time c.d.f., the Bass model, the GBM, and the PH model. In addition, we considered the possibility of including a term in the subscription model that permits leapfrogging, namely, γt. There are two possible specifications for γt: 0 (no leapfrogging) or the form specified in Equation 17, which permits leapfrogging. Therefore, the number of possible model specifications is 12 (combinations of three adoption-time c.d.f.s, two conditions on qi, and two values for γt.
We fit these 12 models using the SAS procedure PROC MODEL (SAS Institute 1988), using full-information maximum likelihood estimation. The fit of these 12 models is summarized in Table 1. Our first consideration is whether qi = q ∀ i, as suggested by Norton and Bass (1987). Using the likelihood ratio test, we reject the null hypothesis of qi = q ∀ i in favor of unequal qi in three of the four possible comparisons. Examining the impact of incorporating marketing-mix variables, we first note that the models based on the GBM c.d.f. offer no significant improvement in fit over those based on the no-covariate Bass c.d.f. In contrast, price is significant for all the models based on the PH c.d.f., and all the specifications offer a significant improvement in fit over their no-covariate counterparts.
SUMMARY OF ALTERNATIVE MODEL CALIBRATION RESULTS
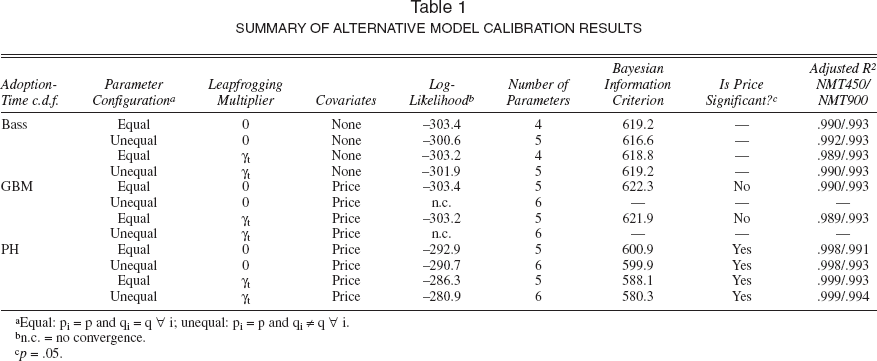
Equal: pi = p and qi = q ∀ i; unequal: pi = p and qi ≠ q ∀ i.
n.c. = no convergence.
p = .05.
Table 1 gives the Bayesian information criterion values for each of the models and shows that the PH model, having unequal qi and allowing for leapfrogging, results in the best model. 6 The coefficient estimates for this model are given in Table 2. All the model coefficients are strongly significant and have signs in the expected direction.
We note that the 12 formulations given in Table 1 are not the only way to incorporate the effects of covariates into successive-generation models. A note discussing the estimation of models by Norton and Bass (1987) and Speece and MacLachlan (1992, 1995) is available on request from the authors.
PARAMETER ESTIMATES

Given these parameter estimates, we are able to arrive at an estimate of the generation-specific adoption-time

ACTUAL AND PREDICTED SUBSCRIPTIONS
Estimating First-Time Sales (New Adoptions)
As noted previously, available sales data typically include repeat purchases—rarely do data providers break out first-time versus repeat purchases for durable products. This is a particularly difficult problem with data of the type used here. Cellular telephones have a relatively short product life cycle, and subscribers to a given service/technology generation may replace their handsets several times while remaining with one service provider.
Given
In Figure 2 we plot the subscriptions data along with the estimates of first-time sales. The gap between subscriptions and first-time sales represents renewals (see Equations 3 and 4). For both generations, renewals quickly dominate first-time sales. First-time sales of the NMT450 peak around the time of the introduction of the NMT900 and level off to a small yet relatively stable number each year. Not surprisingly, first-time sales for the NMT900 quickly dominate those of the NMT450 (in less than three years). Note that the level of renewals for the NMT450 remains relatively stable, despite the presence of the second-generation product; most of the NMT900's first-time sales appear to come from the potential subscriber base that is unique to the second generation.
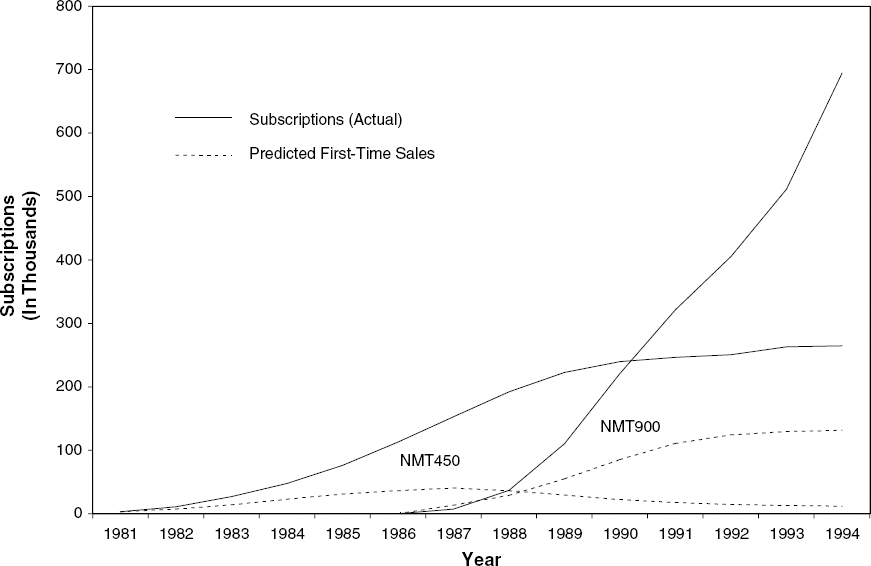
SUBSCRIPTIONS (ACTUAL) AND PREDICTED FIRST-TIME SALES
Impact of Price on Diffusion and Substitution
One advantage of including marketing-mix variables in a diffusion model is the possibility that the empirical results will shed light on the impact of strategic variables that are managerially controllable. Unfortunately, despite the importance of the subject, there is little empirical evidence regarding changes in price responsiveness over time in a multiple-generation framework. Precisely how should price elasticity be expected to vary over time? Bayus (1992) provides an explanation for the generally observed phenomena of declining prices over time based on replacement buying behavior of consumers with overlapping replacement cycles. Padmanabhan and Bass (1993) suggest that the optimal pricing strategy will depend on the degree of substitutability across the two generations. Although both articles shed light on the optimal price on the supply side, they tell little about the impact that the price has on the actual rate of adoptions and subscriptions empirically.
Although we are able to estimate first-time sales, the focus of much of the cellular telephone industry is the revenue generated by subscriptions (ongoing and new). The PH framework presented previously provides a convenient vehicle for assessing how subscriptions and price elasticities change over time in a multiple-generation environment. To begin, we note that a decrease in the price of the second-generation product (NMT900), ceteris paribus, increases NMT900 subscriptions while decreasing subscriptions for the first-generation product (the NMT450), precisely as would be expected. Alternatively, however, a decrease in the price of the NMT450, ceteris paribus, increases not only NMT450 subscriptions but also those of the NMT900. The reason for this is that consumers who adopt the earlier-generation product eventually adopt the newer-generation product. Thus, an increase in the installed base of the NMT450 has a positive impact on the future path of NMT900 subscriptions. In short, the impact of price changes for an earlier-generation product on later-generation subscriptions works through two vehicles: (1) direct price response (e.g., choosing one generation over the other at the point of sale) and (2) the installed base of the earlier-generation product.
To demonstrate price response and the impact of strategic pricing decisions over time, we created a series of figures that reflect the underlying mathematical relationships. First, we show the changes in the estimated price elasticity over time for the NMT450 and the NMT900, relating these results to previous research on price elasticity over time in a single-generation setting (e.g., Parker 1992; Parker and Neelamegham 1997). Second, given that pricing strategy is a managerially controllable marketing-mix variable, we use these results to examine the impact of alternative pricing strategies that are available to firms in this market.
Changes in Price Elasticity over Time
From the basic form of the final PH model—Equations 12 and 13, with Fi(t|τi) given by Equation 16, γt by Equation 17, and δt by Equation 18—we calculated the subscription response elasticity for the price of each Generation i, which is equal to [∂SUBSit/∂pit][pit/SUBSit], for i = 1, 2. The term pit is a component of the vector of covariates xi(t) and denotes the price of the ith-generation product in the tth time period. Recall that the empirical results for the price variable for both products were such that we could not empirically discern different price coefficients for the different generations. Therefore, only one price coefficient was estimated; however, this does not imply that the marginal impact of the price of each generation will be the same across both generations, because the partial derivative will be different for i = 1 and i = 2. This has important implications in a diffusion setting because it suggests that even if the price coefficient does not vary across multiple generations, the observed price elasticity will. We focus on the price variable, though the analysis could easily be extended to any marketing-mix variable (assuming that appropriate data were available).
In Figure 3 we plot the estimated elasticities for both generations of cellular telephones over time using the estimated parameters from the PH model. There is substantial variation in the estimated price elasticities over time. In previous research, Simon (1979) found that price elasticity tends to decrease during a brand's introductory and growth stages, reaches a minimum, and then increases in the decline stage. Parker (1992) and Parker and Neelamegham (1997) find similar patterns across most durable product categories. Thus, the pattern of decline shown in Figure 3 is consistent with previous research, and the estimated first-generation elasticity increases at the end of the observed data series, consistent with previous research. We note that the magnitudes of the reported elasticities are also consistent with those reported by Parker and Neelamegham (1997).

ESTIMATED PRICE ELASTICITIES FOR NMT450 AND MNT900 CELLULAR TELEPHONES
Note, however, that there are important interactions across the two generations. The estimated price elasticity of the second-generation product falls much more quickly than does that of the first-generation product. In addition, the elasticity of the first-generation product increases concurrently with the launch of the second-generation product. Given the substitutability of the NMT450 and the NMT900, these results should not be surprising. Furthermore, when the first-generation product is still on the market, the demand sensitivity of the second-generation product would be expected to fall quickly below that of the first-generation product if there is any technological advantage. This is exacerbated by declining prices of the second generation and a shift down the income distribution over time (as discussed by Horsky 1990; Russell 1980). Although this ex post explanation for the observed pattern of changes over time makes sense from the perspective of the underlying market economics, further research is needed to test this explanation and understand how the pattern changes when the products are less substitutable. In this preliminary analysis, however, it is encouraging that the patterns observed not only make sense but are consistent with previous research.
Own-Price Effects
In addition to the elasticity estimates, we examined the impact of alternative pricing strategies on (predicted) subscriptions by varying price around its actual level for each year in the sample. This enabled us to project the impact of a high versus low pricing strategy for each product on the subscriptions of that product (own-price effect) as well as for the other generation's product (cross-price effect). Therefore, to assess the impact of these alternative pricing strategies, we began with the estimated coefficients presented in Table 2. We then increased price and decreased price by approximately 15% versus the actual levels for each product (one at a time) across the period of observation. 7
The choice of 15% is purely arbitrary; the magnitude of the high versus low pricing strategies is less important than the direction and relative magnitude of these strategies, which is reflected in the figures.
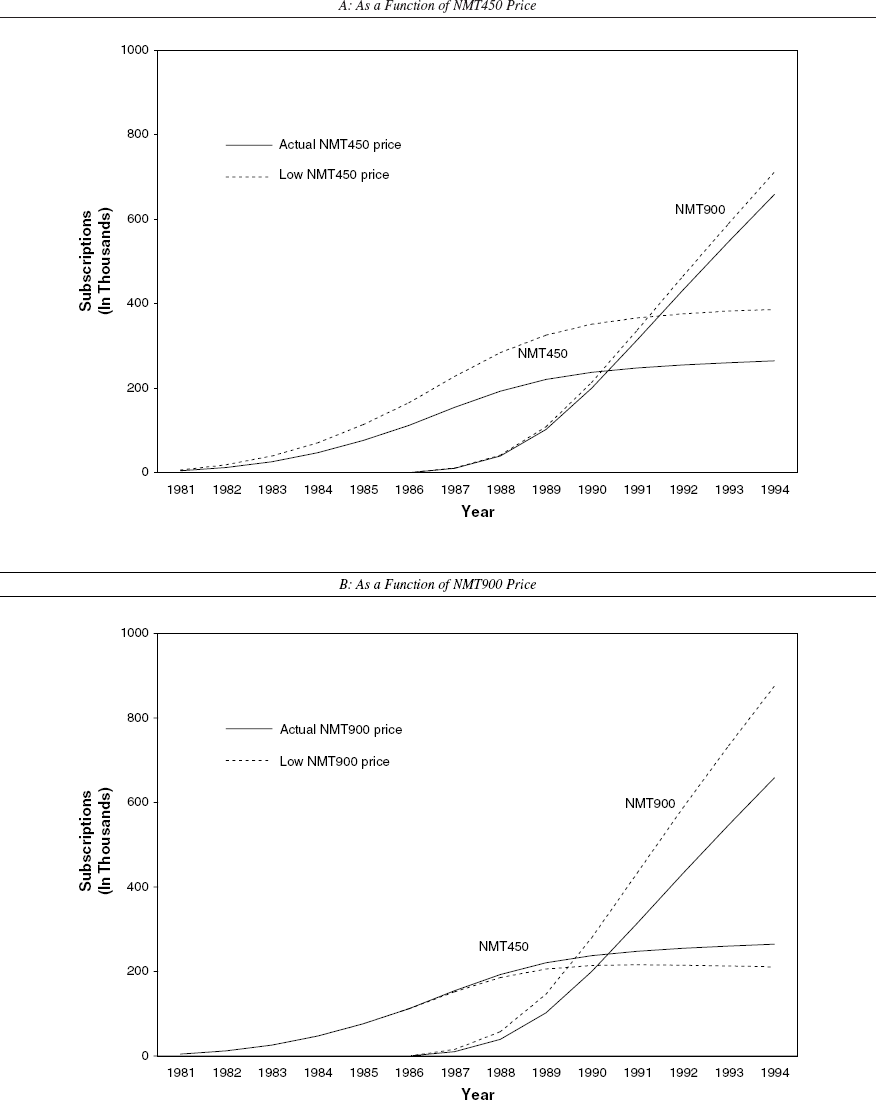
Figure 4, Panel A, shows the own-price effect for the NMT450; the three curves represent projected subscriptions under an NMT450 high, actual, and low pricing strategy, respectively, if the price of the NMT900 is held constant at its actual value. The three NMT900 curves—Figure 4, Panel B—are analogous except that it is the NMT900 price that is changing. We note that the own-price effect is negative for both products, as expected. However, the impact—in absolute terms—of a low price strategy on the NMT900 is significantly greater than for the NMT450. A look at the price elasticities early in the life cycle for the NMT900 (Figure 3) suggests why—a lower price generates a significant response for the NMT900 early in the life cycle. This response in turn increases the installed base of the NMT900 and promotes the familiar word-of-mouth effects (because of the larger installed base of the NMT900). The magnitude of the price elasticities from Figure 3 and the magnitude of the differences in predicted NMT900 subscriptions under the three strategies in Figure 4, Panel B, suggest that a low price strategy for the NMT900 would be effective in generating future subscriptions (not necessarily profits) compared with a similar strategy for the NMT450.

SUBSCRIPTIONS AS A FUNCTION OF OWN PRICE
Cross-Price Effects
Figure 5 provides estimates of the relevant cross-price effects. To keep the graph relatively uncluttered, we consider only the actual price path taken and the impact of an alternative low price strategy. (The results for a high price strategy are simply opposite in direction.) Figure 5, Panel A, demonstrates the predicted impact of a decrease in price of the NMT450 across the observation period, ceteris paribus (if the NMT900 prices are kept at their actual levels), whereas Figure 5, Panel B, does the same for the price of the NMT900 (if the NMT450 prices are kept at their actual levels). As suggested previously, Figure 5, Panel A, implies that when the price of the NMT450 is decreased, not only do subscriptions of the NMT450 increase but subscriptions of the NMT900 do as well (albeit by a much smaller amount). A priori, it might seem surprising that lowering the price of the first generation and keeping the second generation's price fixed increases subscriptions to the second generation. However, the general framework presented previously suggests that SUBS2t increases as the installed base of the first generation increases. That is, growth in the first generation also benefits the second generation, because it provides a bigger pool of subscribers who can later migrate to the second generation. Finally, as was also suggested previously, a lowering of the NMT900 price (Figure 5, Panel B) increases NMT900 subscriptions dramatically while decreasing those for the NMT450.
NMT450 AND NMT900 SUBSCRIPTIONS
Although these results make intuitive sense, they suggest that an optimal pricing policy should be designed to take advantage of these differences. Previous work by Padmanabhan and Bass (1993) recognizes the importance of cannibalization in the optimal pricing of successive generations; our empirical results suggest that price response is likely to be closely related across generations. In the present case, the estimates of p and q in Table 2 are consistent with Kalish's (1983) conclusions favoring a skimming price strategy; furthermore, the actual price path suggests that a skimming strategy was indeed employed in this industry. However, Bayus (1992), in a multiple-generation setting, notes that other factors play a role in the optimal pricing strategy over time. For example, Bayus (1992, Table 3, p. 260) concludes that when the sales of the second-generation product are due to a high proportion of “normal replacements,” a skimming strategy is optimal across the generations; as discussed previously, this seems to be consistent with consumer behavior in this industry. Thus, Kalish's (1983) early results, Bayus's (1992) more recent work, and our empirical results all suggest that a skimming strategy over time would be optimal in this industry, consistent with actual pricing behavior over time. More generally, however, this suggests that researchers need to be careful when applying prior single-generation results (e.g., Kalish 1983) to a multiple-generation environment.
Conclusions
In this research, we develop a model for the diffusion of successive generations of a technological innovation that explicitly captures the effects of marketing-mix variables. The proposed PH model performs well, producing reliable parameter estimates and good fit. On the basis of these results, it appears that when the objective is to understand the diffusion process in the context of multiple-generation products, it would be prudent to incorporate covariates when such data are available. Furthermore, the impact of covariates—for example, the impact that changes in price can play in determining a firm's overall pricing strategy—has significant managerial relevance.
We find that the pattern of declining price elasticities observed by Simon (1979), Parker (1992), and Parker and Neelamegham (1997) holds in a multiple-generation environment (at least for this one category). Furthermore, there are likely to be price response interactions between generations (as shown in Figure 5). This is important, because work by Padmanabhan and Bass (1993) has shown that these cross-product effects have important implications for a firm's optimal pricing strategy. The PH model provides a vehicle for empirically assessing the evolution of price response over time.
Although our research represents a step toward understanding the impact of covariates in a multiple-generation model, it is indeed just one step in this direction. As always, there are limitations to our analysis. Further research should use the general framework presented here to analyze several different product categories. This should be done to see how well the results found here generalize to other data sets. Second, as noted previously, further research should investigate whether any of the conclusions drawn here change when the assumption of the Bass baseline distribution is altered. Moreover, there are alternative specifications available for the leapfrogging and switching multipliers used in this research. It would be worthwhile to investigate the implications of these alternative specifications. Finally, developing individual-level models of the adoption and substitution process would enhance researchers' understanding considerably.
Despite these limitations, our empirical findings appear to be both intuitive and robust. Furthermore, the general framework developed is flexible enough to incorporate a variety of alternative functional forms and assumptions. In developing this model, we have attempted to facilitate further research that would incorporate covariates in a multiple-generation setting. Accordingly, we strongly encourage further research in this regard.
Footnotes
Covariates in a Single-Generation Model
Precisely how should the effects of marketing-mix variables be incorporated within a new product diffusion model? Within the single-generation literature, a standard approach has been to multiply the p.d.f. of adoption times by some function of marketing activities (for a review of these models, see Bass, Krishnan, and Jain 1994). A problem with such an approach is that it fails to capture the effects of past marketing activities on the with-covariate p.d.f. at any given point in time. This problem is widely recognized in the duration time modeling literature (Yamaguchi 1991). As a result, we focus on incorporating the effects of the covariates on the instantaneous rate of adoption given nonadoption to date (i.e., the hazard rate). Jain (1992) introduced this approach to the diffusion literature for a single generation; here we extend it to a multiple-generation setting.
The basic idea is to start with a baseline distribution for adoption times. The effects of covariates are then added through the hazard rate function of the baseline distribution. In particular, in a PH regression approach (Kalbfleisch and Prentice 1980), marketing activities are expected to increase or decrease the conditional likelihood of instantaneous adoption (i.e., the baseline hazard rate). The with-covariates distribution of time to adoption can then be derived from the with-covariate hazard rate function.
We begin by specifying a general model for Generation i (for a single-generation model, there is only one generation, and i = 1). 8 Let Fi(t|τi) be the with-covariate c.d.f. of time to adoption for Generation i launched at time τi, and let hi(t|τi) be the associated hazard rate function. Furthermore, let F0i(t|τi) be the baseline (i.e., no-covariates) c.d.f. of time to adoption of the ith generation of the technology, and let h0i(t|τi) be the associated hazard rate function. The PH framework assumes that marketing activity will increase or decrease the baseline hazard rate; that is, hi(t|τi) = h0i(t|τi)exp[β′ixi(j)], where xi (t) denotes the vector of covariates for Generation i at time t, and βi denotes the generation-specific effects of these covariates. When F0i(t|τi) is the Bass c.d.f., this is the generation-specific form of the with-covariate hazard rate function examined by Jain (1992)(see, e.g., Bass, Krishnan, and Jain 1994, Table 1). By definition,
Although we are concerned with only one generation of a new technology at this point in the article, specifying the model for Generation i is completely general because it not only allows for examination of a single generation (i = 1) but also provides a convenient vehicle for expanding the framework to multiple generations, as required in the body of the article.
Now, by partitioning the interval (τi,t] into contiguous intervals (τi,τi + 1], (τi + 1, τi + 2], …, (t - 1,t] and assuming that the time-varying covariates remain constant within each time period (e.g., a year),
where the last line results because
If we assume that the baseline adoption distribution, F0i(t|τi), is characterized by the Bass model, as given in Equation 14, we have a with-covariate c.d.f. for the time to adoption of each generation of the technology. Note that when pi = 0 (i.e., the covariates are omitted), Fi(t|τi) reduces to the Bass model.