
Abstract
When entering a new market, the first entrant typically faces the greatest market and technological uncertainties. Memorable phrases reflect the associated survival risk, such as “the first to market is the first to fail” and “the pioneer is the one with the arrows in its back.” Although research estimates the market pioneer's survival rate, the typical pioneer survival rate has not been compared with that of early followers. The authors' study compares survival rates for 167 first-entrant market pioneers versus 267 early followers. For these industrial goods businesses, 66% of the pioneers versus 48% of the early followers survived at least ten years. The main conclusion is that the pioneer's temporary monopoly over the early followers plus its first-mover advantages typically offset the survival risks associated with market and technological uncertainties. These results are consistent with previous research in the sense that first-mover advantages that increase a pioneer's market share also help protect the pioneer from outright failure.
Do market pioneers have unusually low survival rates? Unusually low survival rates can offset the pioneer's market share reward that often arises for surviving businesses (Robinson and Fornell 1985) and surviving brands (Urban et al. 1986). Unusually low survival rates can also deter investing in the costly and risky attempt to pioneer a new market.
In a recent Management Science article, Shepherd (1999, p. 623) says, “Common wisdom from the strategy literature suggests that … pioneers have higher returns if they are successful, … but [they] bear a higher risk of failure.” Common or conventional wisdom in marketing seems to reach a similar conclusion. Research by both Lambkin and Day (1989, p. 15) and Golder and Tellis (1993) predicts a relatively high market pioneer attrition rate. Golder and Tellis (1993), for example, report a lifetime market pioneer survival rate of only 53%. Tellis and Golder (1996) provide many valid reasons why the first to market can be the first to fail.
Although conventional wisdom highlights survival risks, it does not highlight two key market pioneer benefits. Because a market pioneer is typically defined as the first entrant, a short-term benefit arises when the first entrant has a monopoly before the second entrant's arrival. If a market pioneer does not face any competitors, its survival should be easier. After one or more competitors enter the market, a long-term benefit arises from first-mover advantages. First-mover advantages include brand loyalty, switching costs, broad product lines that preempt competition, and scale economies (see Kerin, Varadarajan, and Peterson 1992; Lieberman and Montgomery 1998). Given these conflicting forces, the impact of order of market entry on survival is an empirical issue.
In Kalyanaram, Robinson, and Urban's (1995) survey, industry studies cover 7 cigarette markets (Whitten 1979), 18 Iowa newspaper markets (Glazer 1985), 39 chemical product markets (Lieberman 1989), 11 consumer nondurable markets (Sullivan 1992), and 5 medical diagnostic imaging subfields (Mitchell 1991). Because these industry studies yield mixed results, the authors conclude that order of market entry does not appear to be related to long-term survival rates (see Emerging Empirical Generalization #4).
More recent research by Agarwal and Gort (1996) and Agarwal (1996, 1997) uses Thomas Register of American Manufacturers data to examine survival rates in 33 markets. Long time-series data yield a negative relationship between entry by product life cycle stage and survival rates, which supports the importance of first-mover advantages.
In contrast to Agarwal's research, our study relates survival rates to order of market entry. Robinson and Fornell (1985), Robinson (1988), and Lambkin and Day (1989) classify an entrant as a market pioneer, an early follower, or a late entrant. Because Agarwal's research combines market pioneers and early followers in the product life cycle's introductory stage, it is silent in terms of their respective survival rates.
Our study compares survival rates for market pioneers versus early followers but does not examine late entrants. Agarwal's research indicates that late entrants have relatively low survival rates than earlier life cycle stage entrants do. This may arise because late entrants tend to have a relatively low market share (Kalyanaram, Robinson, and Urban 1995), and low market share businesses appear to be more vulnerable to market exit (Caves 1998). 1
Also, in the Thomas Register data, it is not always clear when an entrant shifts from being an early follower to being a late entrant, so it is often difficult to identify a late entrant objectively.
We use the Thomas Register of American Manufacturers to develop a broad cross-section of 167 first-entrant market pioneers and 267 early followers. Our random sample covers new markets for manufactured industrial goods.
In contrast to previous research in marketing, our primary conclusion is that market pioneers have significantly higher survival rates than early followers do. This indicates that the pioneer's temporary monopoly and its first-mover advantages tend to offset the survival risks of market pioneering. Therefore, at least for industrial goods, the first to market does not appear to be the first to fail.
A second and less important research contribution examines the impact of pioneer lead time on survival. Brown and Lattin (1994) and Huff and Robinson (1994) show that first-mover advantages are also influenced by pioneer lead time. Consistent with prior research, increasing pioneer lead time tends to increase pioneer survival rates. A new result from our study is that a short delay tends to increase an early follower's survival chance. This can arise when a short delay helps resolve important market and technological uncertainties. However, any further delay tends to decrease early follower survival rates.
Hypotheses
The hypotheses compare market pioneers with early followers in the early years of a market's evolution. Because many forces influence survival, the hypotheses do not directly test a single theoretical mechanism. Instead, they compare the strength of the pioneer's first-mover advantages and pioneer lead time with the combined impact of market and technological uncertainty.
First-Mover Advantages and Survival
Market pioneers typically face the greatest market and technological uncertainties. Market uncertainty arises because it is unusually difficult to forecast sales for a pioneering product. In many cases, market entry is similar to “an archer shooting at a target shrouded by a veil of fog” (Hamel and Prahalad 1994, p. 238). Because an early follower has more time to learn about customer needs and wants, reduced uncertainty should increase its survival chance.
Yip (1982) describes how technological change provides a gateway for entry. Technological change is especially likely to arise during the market's early years. When an early follower has time to obsolete the pioneer's technology, a gateway for entry arises. Again, delayed entry reduces uncertainty, which enhances an early follower's chance of survival.
In summary, conventional discussions of market pioneer survival in the early years of a market's evolution typically emphasize market and technological uncertainties. Memorable phrases reflect the notion that pioneers face the greatest risk. The phrases include “the first to market is the first to fail” and “the market pioneer is the one with the arrows in its back.” Because of market and technological uncertainties, conventional wisdom yields the following:
When pioneer lead time is held constant, market pioneers have a lesser chance than early followers of surviving.
An alternative hypothesis is that first-mover advantages increase the pioneer's survival chance (see Kerin, Varadarajan, and Peterson 1992; Lieberman and Montgomery 1998). Although several first-mover advantages can arise, this literature is typically downplayed in discussions of market pioneer survival.
Some empirical evidence supports the importance of first-mover advantages. In Table 1, Agarwal's (1997) sample covers 33 categories of consumer, industrial, and military products. For entry into various stages of the product life cycle, her introductory stage entrants (Stage 1) have the highest 12-year survival rates. Introductory-stage entrants include both market pioneers and early followers. Assuming that late entry occurs after the early growth stage (Stage 2), late-entrant survival rates are relatively low. Shepherd's (1999) survey of Australian venture capitalists also supports relatively low late entrant survival rates. Therefore, if first-mover advantages more than offset market and technological uncertainties, we have the following:
12-Year Survival Rates by Product Life Cycle Stage for 33 Product Categories

Notes: The data are from Agarwal (1997, Table I). The five life cycle stages are from Gort and Klepper's (1982) model. To link this material to the marketing literature, we have added product life cycle names, such as introduction, early growth, and so forth.
When pioneer lead time is held constant, market pioneers have a greater chance than early followers of surviving.
Pioneer Lead Time and Survival
Increasing pioneer lead time should increase the pioneer's chance of survival. A short-term benefit arises from the pioneer's monopoly before the second entrant's arrival. If the market pioneer does not face any competitors, its survival should be easier. A long-term benefit arises because increasing lead time tends to strengthen first-mover advantages (see Brown and Lattin 1994; Huff and Robinson 1994). By lengthening the pioneer's temporary monopoly and strengthening its first-mover advantages, we have the following:
Increasing pioneer lead time increases the market pioneer's chance of surviving.
Because increasing pioneer lead time makes the pioneer stronger, to the extent that the pioneer and early followers are competing for scarce resources, an early follower's chance of surviving should decrease. By strengthening the pioneer's first-mover advantages, even a short delay hurts an early follower. This yields the following:
Delayed market entry decreases an early follower's chance of surviving.
An alternative hypothesis for H3 points to an inverted-U relationship. In the first year or two of the market's evolution, decreased market and technology uncertainties yield substantial benefits for an early follower. If so, a short delay can help an early follower's chance of survival. As time goes by, an early follower's learning yields diminishing marginal returns. With diminished learning and a pioneer that is developing stronger first-mover advantages, a long delay should hurt an early follower's survival chance. This yields the following:
Delayed market entry initially increases an early follower's chance of survival. Any additional delay decreases an early follower's chance of surviving.
Data
The Thomas Register of American Manufacturers is a national buying guide that “is a comprehensive, detailed guide to the full range of products manufactured in the United States” (Lavin 1992, p. 129). The Thomas Register attempts to achieve comprehensive coverage by subscribing to a broad range of industry newsletters, searching for startup ventures in university incubators, and, last but not least, providing a free listing in each annual issue. 2
Many of the data insights are based on telephone conversations and email communications with Glenn H. Moore, Associate Publisher/Editor of the Thomas Register.
The 1999 Thomas Register includes approximately 157,000 firms and roughly 63,700 product categories, so many products have numerous and highly specialized categories. The 1999 Thomas Register, for example, lists 128 different types of lights. They range from aircraft lights, airport lights, and aisle lights all the way down to water lights, waterproof lights, and work lights.
Market Boundaries
Thomas Register market boundaries are established by grouping together close product substitutes. The Thomas Register's professional staff does the grouping. Having a professional staff identify new markets helps an academic researcher avoid many subjective decisions—for example, when a new market starts and what competitors should be included in each market. A professional staff also helps gather a large and diverse group of new markets.
One potential danger with the Thomas Register's highly specialized product categories is that the first entrant in a highly specialized category is not a market pioneer. Instead, the first entrant is a late entrant in a broader market, such as lights. Even so, Thomas Register market boundaries attempt to reflect how industrial buyers shop for products. Industrial buyers do not just shop for a light, they shop for aircraft lights, airport lights, and aisle lights. Because specialized categories reflect specialized buyer demands, market boundaries are driven by industrial buyers' behavior. In contrast, in the United States Census of Manufacturers data, similar production processes often drive the Standard Industrial Classification (SIC) code market boundaries (Scherer and Ross 1990, p. 75).
Some new categories in the Thomas Register data are complementary products. Mechanical credit card imprinters, for example, were pioneered in 1962. With only three credit card manufacturers listed in 1960, the credit card market appears to have been in its infancy in the early 1960s. Other new categories represent a new technology, such as distance-measuring instruments, which are electronic devices that were pioneered in 1972. This is the same time period when other electronic devices were first introduced, such as the Bowmar pocket calculator (Schnaars 1994, p. 150).
A Thomas Register product category also needs to maintain meaningful product uniqueness over time. Animal access doors, for example, were first listed in 1972. In 1988, 14 firms were listed as manufacturing animal access doors. In 1989, this category was merged into the access doors category, which suggests that general purpose access doors had evolved to the point at which they could also be used for animal access.
Thomas Register Sample
As a national buying guide, the Thomas Register typically omits firms with exclusively local sales. (In the past five to ten years, local markets have received more coverage, especially in the Thomas Regional directories.) By excluding local markets, our sample emphasizes regional and national markets.
The Thomas Register includes international firms if they have a manufacturing facility, office, or distribution channel in the United States. Even so, because the Thomas Register highlights U.S. manufacturers, imported manufactured goods are often excluded. Therefore, our sample deletes product categories with a relatively high share of imports. 3
To estimate the market share of imported goods, data from the United States Census of Manufacturers at the four-digit SIC code level estimate the ratio of imports divided by domestic shipments less exports plus imports. Because a natural break in our sample arises between 33% and 40%, our sample excludes the 13 import-oriented markets that exceed 33%.
Food and food-related products are covered in a separate issue, the Thomas Food Industry Register. By excluding food and food-related products, our random sample was too small to make accurate inferences about consumer goods. Therefore, our sample covers only industrial goods.
Overall, the Thomas Register provides detailed coverage of domestic manufacturing for nonfood products in regional and national markets. Given these strengths and the use of the Thomas Register in several survival studies in the economics literature (Agarwal 1996, 1997, 1998; Agarwal and Gort 1996; Gort and Klepper 1982), the data should provide meaningful insights into market pioneer versus early follower survival rates.
Key Data-Gathering Issues
The data address 5- and 10-year survival. A longer time horizon, such as 15 years, is not used. A longer horizon goes well beyond a market's early years, when survival is often a critical issue. A longer time horizon also limits survival insights from new markets that were started in the 1980s. 4
For example, when an early follower enters the market three years after the market pioneer, 15-year survival requires 18 years of data. Because our data end in 1999, examining 15-year survival yields missing observations for most of the markets that started in the 1980s and for some markets that started in the late 1970s.
In our university library storage, the Thomas Register begins in 1960. The most time-consuming part of the data collection process is identifying new markets. Examining ten-year survival limits our new markets to those that started in the 1960s, 1970s, and 1980s. 5 Because the new markets were identified in 1997, the last new market that was identified for ten-year survival started in 1987. Each new market survived at least ten years. 6
We started the random selection of markets by using different letters of the alphabet. For example, we compared markets whose names started with the letter A with those in later editions. The random selection covered markets whose first letter begins with A through O. As a contingency, we set aside the letters P through Z.
This is not to say that all Thomas Register markets survive. Locating new markets is a time-consuming process. Rather than making year-over-year comparisons, it is faster to compare a list of markets that are 10 or even 20 years apart and then zero in on the new markets. For all practical purposes, this data-collection process misses new markets that were started and quickly failed.
Following Schmalensee (1982), Urban and colleagues (1986), and Golder and Tellis (1993), we conceptually define a market pioneer as the market's first entrant. As mentioned previously, the Thomas Register excludes most local markets. Therefore, our operational definition of a market pioneer is the first manufacturer in the United States to serve either a regional or a national market. In terms of scale of entry, our operational definition falls between Urban and colleagues' (1986), who require national distribution, and Golder and Tellis's (1993), who include local markets.
Because our research attempts to isolate the importance of first-mover advantages and pioneer lead time, our analysis excludes markets with multiple first-year entrants. This is because a unique first entrant cannot be identified. 7 When a unique first entrant is identified, the market is traced forward on an annual basis until another entrant is identified. This entrant and any other entrants in that year are called early followers. Because many markets have multiple early followers in a single year, our annual data cannot identify the exact entry order, such as second, third, fourth, and so on.
Although we considered calling individual companies for help in identifying the market's first entrant, this would be difficult to do because these relatively small markets all started at least ten years ago.
When a market yields a unique first entrant and one or more early followers, the data gathering is stopped. 8 The final sample has 167 markets, with 167 first-entrant market pioneers and 267 early followers. As shown in Table 2, the sample's most frequently represented markets are industrial machinery and equipment, chemicals and allied products, and electronics.
In an attempt to exclude second entrants that are late entrants, the sample deletes markets with second entrants that entered more than ten years after the pioneer. Although a few late entrants may remain, the typical early follower delay is only three years, so the sample should be largely composed of early followers.
Market Description by Two-Digit SIC Code

Identifying a firm's exit follows Agarwal's (1997, p. 574) guidelines. An exit arises when the firm's name and address are both missing from the product category in a given year. This avoids the problem of confusing an exit with a name change, such as a conglomerate merger, or with an address change from an office relocation.
Data Limitations
First, some surviving firms may be inadvertently deleted from the Thomas Register. However, because the Thomas Register is a national buying guide, it is in the firm's best interest to maintain its “free” listing. Also, when a business does not respond to its annual update request, the Thomas Register initiates multiple contacts to find out if it is still in business. Thus, both participating firms and the Thomas Register attempt to minimize inadvertent deletions.
Second, after two competing firms in the same market merge, the smaller firm is typically classified as exiting and the larger firm as surviving. This is effective when the smaller firm is failing. When both firms are healthy, it misclassifies the smaller firm as failing. Although this problem arises in other survival research, such as Gort and Klepper's (1982), Dunne, Roberts, and Samuelson's (1989), and Agarwal's (1996, 1997, 1998; Agarwal and Gort 1996), there is no reason to expect that it materially biases market pioneer versus early follower survival rates.
Third, in some cases, the Thomas Register can be late in identifying the start of a new market. Even so, after contacting managers, Gort and Klepper (1982, p. 638) conclude that “[t]he initial year of commercial production is in most cases the year the product was first listed in the Thomas Register of American Manufacturers.” When the Thomas Register is late by a year or two in identifying the start of a new market, the empirical results should not be materially biased.
Descriptive Statistics
The model's dependent variable equals 1 if the business survived, 0 otherwise. Survival is evaluated at both five and ten years after the Thomas Register's first listing. As shown in Table 3, 87% of the market pioneers versus 70% of the early followers survived five years. The corresponding ten-year survival rates are 66% and 48%. Both differences are statistically significant. 9
As mentioned previously, we also have some data on markets with multiple first-year entrants. For 358 first-year entrants in 67 markets, the five-and ten-year survival rates are 83% and 55%. As expected, these survival rates fall between those of market pioneers and early followers.
Five-Year and Ten-Year Survival Rates for Market Pioneers Versus Early Followers
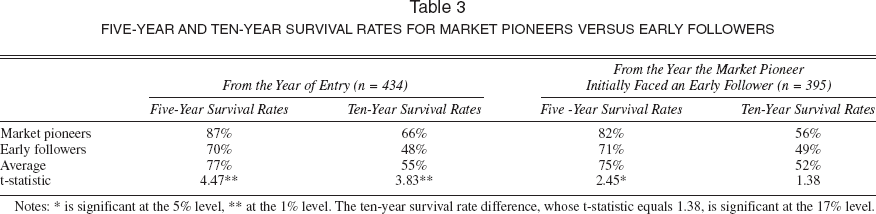
Notes:
is significant at the 5% level,
at the 1% level. The ten-year survival rate difference, whose t-statistic equals 1.38, is significant at the 17% level.
How do these survival rates compare with those in previous studies? Agarwal's 12-year survival rate for Stage 1 entrants averages 56%, which is close to our 10-year average of 55%. Golder and Tellis (1993) report an average market pioneer lifetime survival rate of 53%. This is lower than our 10-year pioneer survival rate of 66%, but lifetime survival rates should be lower than 10-year rates. Thus, survival rates across these three research studies are generally consistent.
Are these survival rate differences influenced by the pioneer's temporary monopoly, first-mover advantages, or both? Comparing survival rates from the year the pioneer initially faced an early follower eliminates the pioneer's temporary monopoly. (Because 13 pioneers exited the market before facing an early follower, deleting these 13 markets reduces the sample size to 395.) Eliminating the pioneer's temporary monopoly decreases the five-year pioneer survival rate advantage from 17% to 11%. The ten-year survival rate advantage decreases from 18% to 7%. These decreases highlight the importance of the pioneer's temporary monopoly. Although more precise hypothesis testing insights are provided subsequently, it appears that the pioneer's temporary monopoly and its first-mover advantages are both important.
Full Model Specification
The full model specification includes the hypothesis testing variables and other control variables described in Table 4. For H1 and H1alt, a market pioneer dummy variable equals 1 for the market pioneer and 0 for an early follower. For H2, H3, and H3alt, interaction terms estimate a different lead time impact for market pioneers and early followers. Each interaction term multiplies pioneer lead time by the respective dummy variable. To reflect diminishing marginal returns, the model uses the natural logarithm of each continuous variable, such as pioneer lead time. 10
When the dependent variable is five-year survival, pioneer lead time for market pioneers is capped at a maximum value of five years. This is because lead time after five years does not retroactively influence pioneer survival.
Variable Definitions

Notes: For the data sources, TRP is the Thomas Register product section, TRC is the Thomas Register company profile section, C is the U.S. Department of Commerce Census of Manufacturers, and H is Hadlock, Hecker, and Gannon (1991, p. 27). The means and standard deviations are for all the entrants in the sample (n = 434).
The model specification holds other variables that influence survival constant. To estimate a different impact for market pioneers and early followers, each business characteristic uses order-of-entry interaction terms. Because important differences do not arise for the industry characteristics, a uniform impact is estimated for market pioneers and early followers.
The additional business characteristics cover (1) new firm versus diversifying entry and (2) relatively small firm assets. Diversifying entrants often share their parents' skills and resources. Sharing a parent's skills and resources should increase the chance of survival. As expected, Agarwal and Gort (1996) report relatively high survival rates for diversification entrants. Relatively small firm assets attempt to measure a suboptimal scale of entry. The small firm assets variable equals 1 for the lowest quartile of firm assets by the decade of entry, 0 otherwise. 11 Relatively small firm assets should reduce the chance of survival.
Firm asset size in the Thomas Register is categorical. Because these categories do not provide precise estimates for large firm assets, our measure highlights small firm assets.
Industry characteristics assess the (1) number of early followers, (2) industry growth rate, (3) high-tech status, (4) calendar year of entry, and (5) industry capital intensity. The number of early followers is the number that entered in the year the first early follower entered. Its predicted sign is ambiguous. On the one hand, an increasing number of early followers helps develop the market, which increases the chance of survival. On the other hand, an increasing number of early followers increases competitive rivalry, which decreases this chance.
Industry growth is measured at the four-digit SIC code level. A growing market typically provides more new customers, more new product opportunities, and higher profit margins than mature markets do. Increased market growth should tend to increase survival rates. Following Agarwal (1996), the high-tech industry dummy variable uses Hadlock, Hecker, and Gannon's (1991) classification. Survival in high-tech industries increases when pioneers and early followers benefit from learning and experience curve advantages. Agarwal (1996) reports that entrant survival rates tend to be higher in high-tech industries.
In recent decades, increasing international competition and shorter new product development cycle times (Griffin 1997, p. 450) can increase competitive intensity. If competitive intensity has increased from the 1960s to the 1990s, survival rates should be negatively influenced by the calendar year of entry. Agarwal and Gort (1996) point out that capital-intensive industries are relatively difficult to exit. Because their empirical results support this prediction, survival rates should increase as capital intensity increases.
Logit Regression Results
Table 5 presents the logit regression results. Statistical significance is based on conservative two-tailed tests. The hypothesis testing results are from the year-of-entry models that explain five- and ten-year survival (n = 434).
Logit Regression Results that Explain Five-Year and Ten-Year Survival
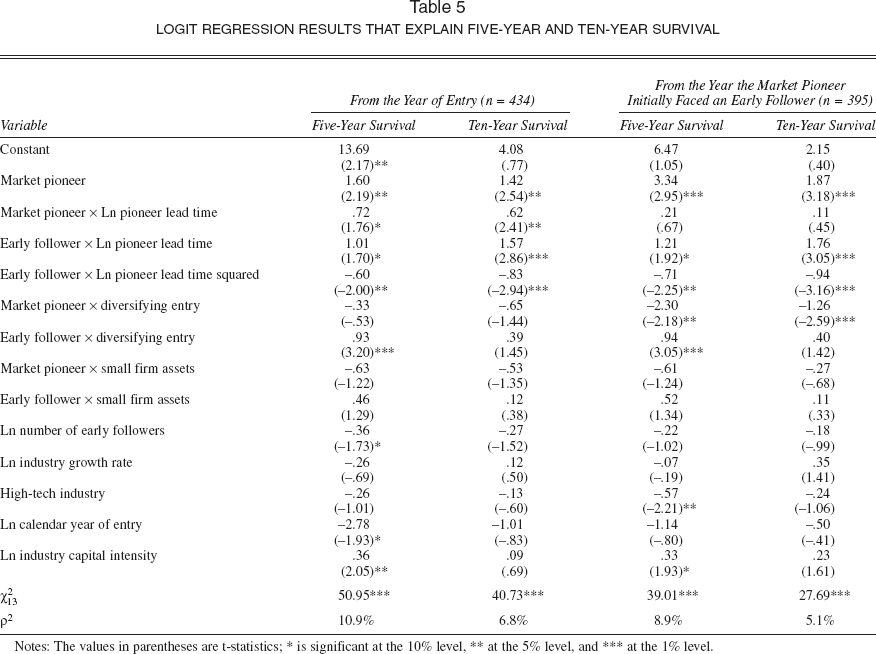
Notes: The values in parentheses are t-statistics;
is significant at the 10% level,
at the 5% level, and
at the 1% level.
Because market pioneering significantly increases a pioneer's chance of surviving both five and ten years, H1alt is supported. Because increasing pioneer lead time increases pioneer survival rates significantly, H2 is supported. This indicates that the combined impact of the pioneer's temporary monopoly plus stronger first-mover advantages helps increase its chance of survival.
We test the potential inverted-U relationship between pioneer lead time and early follower survival using log-linear and squared dummy variable interaction terms. The results consistently support the inverted-U relationship predicted in H3alt. When we set the first derivative equal to zero, early follower survival rates peak when pioneer lead time equals roughly two years. Thus, some delay appears to help an early follower resolve market and technological uncertainties, but an additional delay hurts an early follower's survival chances. 12
Preliminary results from a time-series analysis that uses hazard rate modeling yield hypothesis testing results that are consistent with those in Table 5.
This conclusion has three important caveats: First, when an early follower delays its entry, it assumes that another entrant does not preempt it. Second, these markets all started in the 1960s, 1970s, or 1980s, but the inverted-U relationship probably peaks faster in many of today's faster-moving markets. Third, for frequently purchased consumer goods, Kalyanaram and Urban (1992) report that second through fifth entrants reach 95% of their asymptotic market share within 16 weeks. When first-mover advantages are established this quickly, an inverted-U relationship may not arise.
As shown in Table 5, the two models that explain survival rates from the year the pioneer initially faced an early follower (n = 395) help isolate the importance of first-mover advantages. The isolated impact is supported for H1alt: The market pioneering dummy variable is positive and significant for both five- and ten-year survival. The isolated impact is also supported for H3alt's inverted-U relationship. For increasing pioneer lead time (H2), the impact is positive for both five-and ten-year survival but is not statistically significant. Even so, the overall pattern of results indicates that pioneer first-mover advantages help explain why market pioneers tend to have higher survival rates than early followers do. 13
One other empirical result is worth noting. In Table 5, being a new venture is significantly more important for market pioneers than for early followers (e.g., –.33 less .93). This is consistent with Lambkin and Day's (1989) prediction that market pioneers are often new firms, whereas early followers are more likely to leverage their parent's resources.
Summary
Market pioneers typically face more market and technological uncertainty than early followers and late entrants do. Market uncertainty arises because it is difficult to forecast customer response to a pioneering innovation. Technological uncertainty arises because a pioneer's first-generation technology may not work very well. When an early follower learns from the pioneer's mistakes, its risks are reduced.
However, survival rates for market pioneers are typically enhanced by their temporary monopoly. After their monopoly disappears, market pioneers often benefit from first-mover advantages, such as retaining customer loyalty, setting the industry standard, having superior distribution, and having a broad product line. Although first-mover advantages are discussed in several contexts, conventional survival discussions typically emphasize market and technological uncertainties.
Because market and technological uncertainties are most prominent in the market's early years, survival rates are compared for 167 first entrant market pioneers versus 267 early followers. Across this sample of industrial goods businesses, market pioneers have significantly higher five- and ten-year survival rates than early followers do. Results from a logit regression analysis suggest that pioneers' first-mover advantages more than offset the market and technological uncertainties. Market pioneers' survival also tends to increase as their lead time over the first early follower increases. Increasing lead time gives the pioneers a longer temporary monopoly, which makes survival easier and should help strengthen their first-mover advantages.
In the early years of a market's evolution, an early follower's learning from a short delay can help its chance of survival. The data support this point in the sense that delayed entry initially increases but eventually decreases an early follower's chance of survival. This suggests that an early follower's learning from a short delay resolves a material amount of uncertainty. A longer delay, though, can hurt an early follower when additional learning is modest and the pioneer is getting stronger and stronger over time.
Limitations and Further Research
Because the Thomas Register has relatively narrow market boundaries, market and technological uncertainty should be lower than in broadly defined markets. This is because new markets with relatively narrow boundaries often extend existing knowledge on markets and technologies. Even so, first-mover advantages should also be weaker in markets with narrow boundaries. Therefore, research should examine the extent to which survival rates are influenced by market boundary breadth.
Our sample covers only industrial goods. Would similar results arise in markets for consumer goods? Services? High-technology products? Because market uncertainties, technological uncertainties, and first-mover advantages can vary dramatically across different types of markets, further research should examine the robustness of higher pioneer survival rates across various industry settings.
Risks of Market Pioneering
Absolute survival rates are strongly influenced by the scale of commercialization. A Thomas Register entrant only needs to sell its product in a regional market. In Golder and Tellis's (1993) study, a pioneer only needs to sell its product in a local market. 14 In Urban and colleagues' (1986) study, an entrant must sell its product nationally. By excluding small entrants that failed to achieve a national scope, Urban and colleagues' sample yields higher pioneer survival rates. This helps explain why Urban and colleagues (1986, p. 655) did not locate any market pioneer exits, whereas our study and Golder and Tellis's (1993) report market pioneer survival rates in the 53% to 87% range.
Golder and Tellis's (1993) data include local markets, such as the Brooklyn, N.Y., market for Trommer's Red-Letter light beer. As mentioned previously, the Thomas Register excludes most but not all local markets.
From this perspective, three key steps arise in the market entry process: (1) investing in the attempt to enter a new market, (2) entering the market on a local or regional scale, and (3) expanding to a national scale. Our results, along with those of Urban and colleagues (1986), suggest that when a regional or national scale of operations is achieved, survival rates tend to be higher for market pioneers than for early followers.
In the market entry process, empirical research has not yet linked order of market entry to the survival rate for firms that are attempting to pioneer a new market. We speculate that this is where the greatest risk arises for market pioneer hopefuls, because it is difficult to generate and commercialize an idea that will pioneer a new market.
To address these problems, Hamel and Prahalad (1994, Ch. 11) recommend experimenting with multiple options that are both fast and inexpensive. Although experimentation leads to many small failures, perhaps nine of every ten attempts, these small losses are easily offset by the large gains from pioneering new markets of the future. Thus, a market pioneering strategy has both high risks and high returns, and the greatest risk of failure arises before product launch.
Conclusion
Conventional wisdom on market pioneer survival highlights market and technological uncertainties. Although market pioneers face the greatest uncertainties, they also benefit from first-mover advantages and from the temporary monopoly that arises before they face the first early follower. For our sample of 167 industrial goods markets, market pioneer first-mover advantages plus their temporary monopoly more than offset these market and technological uncertainties. In showing that pioneers often survive past the early and turbulent years of a market's evolution, our results are consistent with Shepherd's (1999) recent survey of Australian venture capitalists. Both studies indicate that the first to market is typically not the first to fail.