
Abstract
In a collaborative study with a major Dutch retailer, the authors assess the short- and long-term effects of a 25% item reduction on category sales. On an aggregate level, a major assortment reduction can lead to substantive short-term category sales losses but only a weak negative long-term category sales effect. Short-term category sales losses are caused mainly by fewer category purchases by former buyers of delisted detergent items. However, the results also show that the assortment reduction attracts new category buyers. These new buyers partially offset the sales losses among former buyers of the delisted items. The collection of supplemental process data on assortment perceptions and actual search time in the test stores before and after the assortment reduction provides evidence that delisting results in an increase in perceived search efficiency and a decrease in actual search time.
Since the early 1990s, increased competition from “category killers,” such as Wal-Mart and Aldi, has forced traditional grocery retailers to implement cost-saving programs (Basuray, Mantrala, and Walters 2001; Dhar, Hoch, and Kumar 2001). A common way to save costs has been to reduce the number of offered items. Some assortment reduction projects use a “cutting-the-tail” strategy, in which low-selling items in a category are eliminated (see, e.g., Boatwright and Nunes 2001; Drèze, Hoch, and Purk 1994; Food Marketing Institute 1993). Such assortment reduction projects can be regarded as natural experiments to assess the impact of assortment cuts. However, the results of these experiments are mixed.
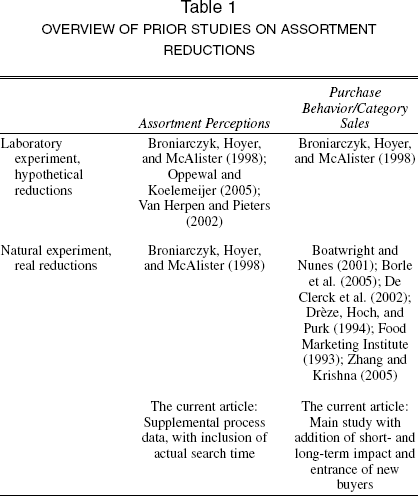
In Table 1, we provide a schematic overview of prior literature on assortment reductions, in which we classify existing studies according to two dimensions: (1) the type of experimental method (laboratory versus natural experiment) and (2) the dependent variables chosen (assortment perceptions versus purchase behavior/category sales). Laboratory experiments tend to focus on perceptions (e.g., Oppewal and Koelemeijer 2005), though some studies have considered both assortment perceptions and stated purchase behavior (e.g., Broniarzyck, Hoyer, and McAlister 1998). Perceptions that have been studied include perceived assortment variety and assortment satisfaction or evaluation. In contrast, natural experiments focus only on category or store sales.
OVERVIEW OF PRIOR STUDIES ON ASSORTMENT REDUCTIONS
Neither the current laboratory experiments nor the natural experiments distinguish between the short- and the long-term effects of assortment reductions. However, this essential distinction can provide valuable insights into the effectiveness of marketing tactics (Dekimpe and Hanssens 1995; Dekimpe et al. 2005). Moreover, ignoring the short-and long-term effects of assortment reductions may lead to the wrong conclusions. For example, if the long-term effect is less negative than the short-term effect, the retailer may overstate the negative consequences of an assortment reduction, which would lead to an overly restrictive policy on assortment reductions and, in turn, to inefficient assortments. Therefore, it becomes essential to study both the short- and the long-term effects of assortment reductions.
In this article, we use a natural experiment to measure the effect of an assortment reduction in a single category (detergents) on category sales. We extend current assortment reduction studies that employ assortment sales as the dependent variable by distinguishing between the short- and long-term effects of assortment reductions. Furthermore, we add to this literature stream by analyzing the entrance of new buyers. Our research questions in this collaborative study can be summarized as follows: (1) What are the short-and long-term effects of a major assortment reduction on total category sales? (2) Do these short- and long-term effects on category sales differ between former buyers and former nonbuyers of delisted items? and (3) Does assortment reduction affect the sales percentage accounted for by new category buyers?
The last research question has particularly important implications for the empirical literature on sales effects of assortment reductions. Several studies have already shown sales effects (e.g., Boatwright and Nunues 2001; Borle et al. 2005; Zhang and Krishna 2005) without explicitly considering short- and long-term effects. However, there are no studies that have considered empirically whether an assortment reduction attracts new category buyers. We aim to investigate this specific issue with a combination of new-buyer analysis and supplemental in-store process data.
We conduct our study in close cooperation with a major Dutch retailer. We use customer loyalty-card data from more than 25,000 households in two test stores and two control stores to assess the short-term and long-term category sales effects of an assortment reduction (we define category sales in monetary units). To provide insights into the explanations of the found sales effects, we collected supplemental process data on changes in assortment perceptions (i.e., assortment variety, search efficiency, and assortment satisfaction) and actual search time due to the assortment reduction.
We structure the remainder of this article as follows: In the following section, we discuss the collaborative research project that underlies this study in more detail. Next, we discuss the theory, methodology, and results. We then discuss findings of the supplemental process data. This is followed by a discussion of our results and managerial implications, in which we focus specifically on the implications for our collaborative research partner. We conclude with research limitations and resulting issues for further research.
Collaborative Assortment Reduction Project
A team consisting of a retailer, a brand manufacturer, and academics carried out this assortment reduction project. The retailer aimed to save costs in the supply chain and reduce complexity by lowering the number of items in various categories, particularly those defined as “routine categories” (Dhar, Hoch, and Kumar 2001). Primarily, the retailer's objective was to lower its total number of store items by approximately 1500, which would enable it to close a warehouse. The associated cost savings were estimated to be approximately €4.5 million per year. However, the retailer feared that such an assortment reduction might affect its category sales. Therefore, we conducted a pilot project in one category to investigate the impact of a major assortment reduction.
In this article, we focus on the results of this pilot project, which considers an assortment reduction in the detergent category. The retailer used to offer 150 detergent items in its assortment. Despite this large number of items, this category performed below its fair share compared with a price-aggressive competitor that carried only approximately 80 items in its detergent assortment. Thus, the retailer decided to remove 37 items of the total 150 items. The removed items constituted 25% of the total number of category items and 14% of the category sales. Thus, in general, low-selling items were removed. A 25% reduction in items is a smaller reduction than that which Boatwright and Nunues (2001) study, but it is a larger reduction than the one that Drèze, Hoch, and Purk (1994) report. For each delisted item, the assortment manager verified that there was at least one reasonable alternative item within the remaining assortment. The 37 delisted items included brand delistings (all items of one brand are delisted) and item delistings (e.g., a delisting of a package format or variety within a brand). 1 Overall, the assortment reduction resulted in the delisting of six complete brands, corresponding with 17 different items. All the delisted brands were low-equity brands. For the other 20 delisted items, consumers could still switch within the brand. The selection of items that were delisted in the test stores was based on item turnover statistics and a consumer decision tree analysis that the manufacturer provided. First, items that did not meet regular turnover demands were selected for reduction. Second, the consumer decision tree analysis showed which detergent segments had potential overlap among items. The retailer's category manager made the final decision about which items should be delisted. In the case of clear “me-too” items, the category manager preferred to delist the item with the lowest gross margin.
In the remainder of this article, we do not distinguish between brand and item delistings. Therefore, when we refer to item delistings, we imply both brand and item delistings. The only exception is the analysis reported in n. 4, in which we explicitly consider differential sales effects between brand and item delistings.
Category space was held constant by giving the remaining items more shelf space and keeping the overall structure (e.g., location of items on the shelf) of the presented assortment constant. In general, this resulted in more facings for remaining items. Furthermore, no new items were introduced during the test. Sales data before and after the assortment reduction were collected from two test stores and two control stores. The perception data were collected in the two test stores before and after the assortment reduction occurred. On the basis of the outcomes of this project, the retailer decided whether the assortment reduction would be rolled out nationwide and, if necessary, which adaptations it needed to make.
Theoretical Background
Sales Effects of Assortment Reductions
Several studies have considered the category sales effects of assortment reductions. For example, Drèze, Hoch, and Purk (1994) study the effect of a 10% item reduction in eight categories and report positive sales effects. However, these positive effects may be due to other changes to the assortment presentation in their study. Using six categories, the Food Marketing Institute (1993) reports both negative and positive sales effects of assortment reductions. The recommended level of cuts led to a sales increase of 2%, and more extreme cuts led to a small reduction in category sales. Boatwright and Nunes (2001, 2004) report an average neutral sales effect of reductions for a weak-performing online grocery store, though they also find negative sales effects for categories with the deepest assortment cuts. On average, 56% of the items were reduced. Borle and colleagues (2005) use household panel data of the same online grocer that Boatwright and Nunes (2001, 2004) study and conclude that overall store sales are reduced and that less frequently purchased categories are more adversely affected by assortment reductions. Moreover, practical experience shows the negative effects of assortment reductions. For example, in 2001, the leading Dutch grocery retailer, Albert Heijn, deleted almost 1500 items across categories, which caused widespread consumer complaints (Foodmagazine 2002).
Negative sales effects may occur because after the assortment reduction, a percentage of buyers will no longer be able to find their preferred item (Broniarczyk, Hoyer, and McAlister 1998). These buyers may initially postpone their purchase but may eventually decide to switch items or switch stores (Campo, Gijsbrechts, and Nisol 2000, 2004; Sloot, Verhoef, and Franses 2005). If the customer switches to another item, no category sales losses will occur. However, if the customer decides to switch stores, category sales will decrease for the retailer.
Conversely, assortment reductions may also have positive sales effects. Previously, the general belief was that more assortment is always better (Oppewal and Koelemeijer 2005). Recently, however, it has been claimed that the opposite may be true (Broniarczyk and Hoyer 2005). Several studies in consumer research and psychology have shown negative effects of too large assortments and positive effects of small assortments (e.g., Gourville and Soman 2005; Iyengar and Lepper 2000). Negative effects associated with large assortment size may occur because of an excessive search complexity (Botti and Iyengar 2004). This may cause customers not to buy products in a category with too large of an assortment; that is, they cancel their purchase (Huffman and Kahn 1998). Reducing assortment size would decrease search complexity, which might induce nonbuyers in this category to start buying products.2 As a result, positive sales effects might occur. This might explain why Drèze, Hoch, and Purk (1994) and Boatwright and Nunes (2001) find either positive sales effects or no sales effects. In the case of no sales effects, positive sales effects due to the entrance of new buyers might offset negative sales effects among former buyers. However, no studies have explicitly considered the issue of the attraction of new category buyers. We believe that this is a notable limitation of current studies. Studying this issue is important because (1) it may explain why no negative sales effects are found, and (2) it might provide an empirical validation of experimental studies in psychology and consumer research that show the benefits of a small assortment. Thus, we explicitly consider the entrance of new category buyers in our empirical analysis. To gain even more insight into the possible attraction of new buyers, we also investigate assortment perceptions, such as search efficiency and assortment variety, before and after the assortment reduction. Furthermore, we study actual search time as a measure of search efficiency.
In the remainder of this article, we refer to new buyers to the category as “new category buyers.” This group may consist of several types of customers, such as new-to-the-store customers, infrequent category buyers, and buyers who used to buy the category products at other stores.
To summarize the foregoing discussion, there is ample empirical and theoretical evidence for a negative sales effect of an assortment reduction, especially among former buyers of delisted items. However, this negative sales effect might be (partially) offset by the attraction of new buyers. In turn, this attraction may compensate the initial negative effect in the long run. The latter sales effect has not been empirically investigated.
Short- versus Long-Term Effects
Numerous studies in marketing science have considered the short- and long-term sales effects of marketing-mix variables, such as advertising, promotions, pricing, and new product introductions (Bijmolt, Van Heerde, and Pieters 2005; Dekimpe and Hanssens 1995; Nijs et al. 2001; Pauwels, Hanssens, and Siddarth 2002; Pauwels et al. 2004). However, the literature on assortment reductions contains no studies that distinguish between short- and long-term effects.
The available evidence indicates that the short- and long-term effects of marketing-mix instruments may differ. For example, Nijs and colleagues (2001) demonstrate a short-term effect of price promotion that dissipates in the long run. According to Hanssens, Parsons, and Schultz (2001), most effects of marketing actions dissipate over time. The question is whether these findings hold for assortment reductions as well. Note that an assortment reduction is fundamentally different from the previously studied promotions. The assortment reduction is a one-time permanent change, whereas promotions occur regularly and are temporary events. Therefore, long-term effects of an assortment reduction are more likely to be present.
To understand the short- and long-term effects of assortment reductions further, we first focus on the reactions of former buyers of delisted items because we expect that negative sales effects will occur mainly for them (Broniarczyk, Hoyer, and McAlister 1998). As we noted previously, negative sales effects among these former buyers manifest when they switch to another store to buy the preferred item or brand or postpone their purchase. Because most consumers visit several stores to buy their grocery products, a store switch with regard to detergent purchases may lead to permanent sales effects. In general, postponement results in a short-term effect. Consistent with Van Heerde, Leeflang, and Wittink's (2000) terminology, this effect may be labeled the “post–assortment reduction dip.” After a certain period, the customer must buy the product because the stock at home has been depleted. At that time, the customer who initially postponed his or her purchase must decide whether to switch stores to buy the preferred item or to switch to another item. The initial downward peak in sales might be followed by an upward peak in sales some weeks after the assortment reduction because of item switching. To investigate such a pattern, we must study not only the direct and long-term effect but also the effect of the reduction in the period in between. Thus, we expect a relatively large negative sales effect in the short run due to postponement and store switching and a smaller sales effect in the long run because part of the group that initially postponed will switch to another item within the store. Overall, the total resulting sales effect among former buyers might remain negative and significant in the long run.
A complicating factor is the entrance of new buyers as a result of the assortment reduction. This might occur gradually over time. Thus, the entrance of new buyers will not compensate for negative sales effects directly after the reduction. However, the possible negative sales effects among former buyers might be compensated for in the long run. Thus, on a total category sales level, the existence of a long-term negative sales effect of an assortment reduction comes into question. To summarize our total discussion of expected sales effects, we provide Figure 1, which shows the expected sales effect among different groups of category buyers.

Expected Short-Term (St) and Long-Term (Lt) Sales Effects of An Assortment Reduction Among Different Groups of Buyers
Research Methodolgy
Data
We analyze customer loyalty-card data to measure the effect of the assortment reduction on category sales. Data on household purchases are available for two stores in which the assortment reduction actually took place and two control stores in which the assortment remained unchanged. These control stores are essential to distinguish between the effects of the delisting and other exogenous changes in sales. The selected stores are geographically far apart. Therefore, it is unlikely that a household will visit more than one store in our sample.
The retailer supplied a database that detailed the purchases of 26,941 households in the detergent category in the four stores. The data are based on purchases of individual households that participated in the retailer's customer loyalty-card program; these purchases account for more than 80% of total store sales. The data cover a period of 52 weeks, 26 weeks before and 26 weeks after the assortment reduction was implemented.
Decomposition of Sales Effects
The foregoing theoretical discussion outlines how sales effects might differ across groups of retail customers. To investigate this formally, we decompose the sales effects for these different groups of buyers. Previous studies decomposed sales effects of marketing actions, such as promotions, on the basis of the behavioral source of this effect (e.g., category expansion, brand witching, stockpiling; see Van Heerde, Gupta, and Wittink 2003; Van Heerde, Leeflang, and Wittink 2004). In this study, we decompose sales effects on the basis of the type of customer; we determine customer type on the basis of the behavior before the delisting (T1). That is, we consider three customer groups in our database: (1) former category buyers of delisted items before the assortment reduction, (2) former category buyers of nondelisted items before the assortment reduction, and (3) new category buyers after the assortment reduction (noncategory buyers in the 26 weeks before the assortment reduction). We can then formally decompose the category sales after the assortment reduction at time T1 as follows:

where t > T1 and the subscripts refer to the previously defined customer groups.
In our analysis, we begin by considering the total sales effects. Subsequently, we focus only on former category buyers, thus distinguishing between buyers of delisted items and nonbuyers of delisted items. Households that have not bought detergents before the delisting cannot be assigned to either subpopulation. Our final analysis focuses on the entrance of these new buyers.
We expect that the percentage of preferred items that is delisted will also affect the impact of the assortment reduction on household behavior. This would be an interesting hypothesis to investigate; however, we lack sufficient data to test it. Therefore, we focus on the binary distinction outlined previously; that is, we consider households that bought a delisted item and households that did not.
Econometric Modeling
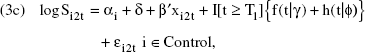
To estimate the effect of the assortment reduction on the category sales in the test stores, we specify an econometric model in terms of log category sales for specific sets of households. Thus, the parameters should be interpreted as relative effects; that is, they represent percentage changes. An advantage of such a specification is that sales associated with different-sized populations can be compared easily. For ease of exposition, we begin by specifying the model to compare the total category sales across the four stores. For this case, we can present the model compactly as follows:

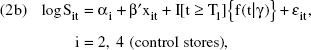
where Sit denotes the sales for store i = 1, 2, 3, 4 at time t = 1, …, T; xit denotes a vector of explanatory variables, such as promotion dummies or dummies for aberrant observations; I[t ≥ T1] denotes an indicator function that equals 0 before the time of delisting (T1) and 1 after the delisting; and f(t|γ) and g(t|θ) denote flexible functions of the time index that measure the change in category sales in the period after the delisting. These functions depend on unknown parameters γ and θ. In this specification, we explicitly use the control stores to identify the effect of the delisting. The function f(t|γ) gives the baseline changes in category sales in all stores, regardless of the delisting, and g(t|θ) gives the (additional) change in the test stores due to the assortment reduction. Note that these functions capture everything that is different after the delisting versus before the delisting. Thus, they are not specified for t < T1. We estimate the model on the basis of the entire sample (t = 1, …, T), and therefore the estimates of f() and g() depend on the observed sales before the delisting. This final function is the key point of our analysis because it indicates the change in sales that is unique to the test stores. Note that this model contains four equations, one for each store. For the error terms, we assume a joint normal distribution with an unrestricted covariance matrix, namely, (ε1t, ε2t, ε3t, ε4t) ∼ N(0, Σ). For the period before the delisting, we keep the model simple on purpose. Further parameterizing the development before T1 does not have a large effect on the estimates of the effect of the delisting. However, it takes up degrees of freedom.
To complete the model specification, we specify f(t|γ) and g(t|θ). There are several possibilities with varying degrees of flexibility and sophistication. The most straightforward specification assumes a constant effect; that is, f(t|γ) = γ and g(t|θ) = θ for all t. However, the change in category sales after the delisting may not be the same for all time periods. Previously, we highlighted the need to study the intermediate points between the short-term and the long-term effect. It is also possible to include time dummies; however, because we consider category sales on a weekly basis, this would yield too many parameters. Instead, we choose a specification somewhere in between, assuming a constant effect and using a time dummy for each period.
In our model, we opt for a cubic spline approach. The resulting function is a smooth piecewise cubic function. To illustrate this technique, we consider the simplest form of the cubic spline. We introduce two parameters that represent the function value at T1 and T (referred to as knots); we obtain the function value for T1 < t < T by simple linear interpolation. In this case, the cubic spline reduces to a linear trend; that is, g(t|γ) = θ1 + (θ2 - θ1)(t - T1)/(T - T1); thus, we estimate the instantaneous (short-term) effect at the time of the delisting (t = T1) by θ1 and the effect at the end of the sample (t = T) by θ2. Between these two extremes, we interpolate the effect using a straight line; for example, halfway between T1 and T, the function value equals .5(θ1 + θ2). Note that in a regression context, it is easy to estimate θ1 and θ2 because they appear linearly in the function specification. In many cases, the assumption of linearity may be too restrictive. This idea can be extended by adding more parameters and increasing the flexibility of the function; that is, we introduce more knot points. Furthermore, instead of linear interpolation, we use a smooth piecewise cubic function (for a general discussion of cubic splines, see Monahan 2001; Poirier 1976; for an application, see Koopman and Ooms 2003; for an application of linear splines in marketing, see Wedel and Leeflang 1998). For this technique, we must select additional knot points next to the points T1 and T used in the linear case. We can obtain a model specification with time dummies if we place a knot at every period. Unfortunately, there are no guidelines for selecting the number and the placement of knots in a practical situation. The optimal placement of knots is at the (unknown) locations where the derivative of the curve is expected to change the most. The number of knots should be chosen relative to the number of available observations. Using few knots may result in a model that is too restrictive, and using too many knots may result in estimation problems. If too many knots are selected, the resulting curve will usually show highly nonlinear behavior, that is, many peaks and troughs. In our application, we use five knot points distributed evenly over the period after the delisting. The first knot is located at the start of the delisting, and the final knot is the end of our observation sample. We interpret the function value at the end of the sample as the long-term effect of the assortment reduction. Note that this long-term effect depends on the sample. If an even longer sample were collected, a different long-term effect might be found. The function f(t|γ) is specified analogously. The resulting complete model can be estimated using generalized least squares because the cubic spline is linear in the parameters.
Decomposition analysis
To study the category sales of subpopulations within a store, we can easily extend Equations 2a and 2b by including additional equations (one equation for every subgroup) and spline functions. Within the group of detergent buyers before T1, we decompose the sales effects between former buyers and nonbuyers of delisted items as follows: On the basis of observed purchase behavior before T1, we assign each household to one of two groups: (1) those that bought at least one item involved in the delisting and (2) those that did not buy such an item. There is no reason to believe that there will be differences in the composition of each group across stores, because the assignment is based on behavior before the assortment reduction became effective. We must now restrict ourselves to households that bought at least one detergent item in the period before the delisting. Every selected household makes at least one purchase before T1, but we do not know whether they will also make a purchase afterward. Therefore, our selection introduces a selection or survival bias in the data; that is, in general, the sales will show a negative trend. However, this trend will occur for both the test stores and the control stores and therefore will not interfere with the estimate of the effect of the delisting. Again, this illustrates the need for data on control stores next to the stores in which the assortment reduction actually took place.
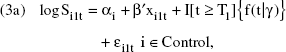
For each group, we calculate the total sales per week, denoted by Sijt, where j = 1 corresponds to former buyers of detergent items that were not delisted and j = 2 corresponds to the former buyers of a delisted item. The model we use is a straightforward extension of Equations 2a and 2b; we introduce an additional dummy variable for the former buyers and two additional spline functions as follows:
Former nonbuyers (j = 1):
Former buyers (j = 2):

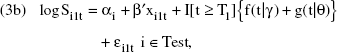
where i denotes the store (i = 1, 2, 3, 4), 8 denotes an additional intercept for the former buyers of delisted items, and Control and Test denote the sets of control and test stores, respectively (test stores = {1, 3}). We now have eight equations rather than four (two groups times four stores). To economize on the number of parameters in the covariance matrix of the residuals, we now assume that the disturbances are independent across stores. Note that we allow for correlation within a store. Table 2 shows an overview of the interpretation of the four-spline function in Equation 3. The functions f(t|γ) and g(t|θ) have the same interpretation as before; the first function captures the general pattern of detergent sales after the delisting, and the second function gives the sales development specific to the test stores. Former buyers of delisted items are expected to behave differently than former nonbuyers, regardless of the assortment reduction, because they are selected to show specific behavior. The function h(t|φ) measures this difference in behavior. It gives the specific effect for former buyers of delisted items in general, that is, across test stores and control stores. The function k(t|v) specifies in what way former buyers in the test stores are different from former buyers in general. We are most interested in the estimates for k(t|v). Again, we model the entire time path of the (possible) changes in category sales. We are interested not only in the size of the effect but also in its timing and duration. 3
Change of Category Sales After the Delisting in the Model of Equation 3, Split Into Control Stores Versus Test Stores and Former Buyers of Delisted Items Versus Former Nonbuyers

Usually, researchers have used other models, such as vector auto-regression models and vector error correction models, in studies that distinguish between short- and long-term effects of marketing actions (e.g., Nijs et al. 2001; Paap and Franses 2000). However, these studies do not examine a one-time event, such as the assortment reduction. Instead, for example, the effect of price promotions is studied, such that multiple promotions are observed in the sample. Because an assortment reduction is a one-time event, we cannot use these models. Thus, we use spline regression. Intervention analysis (see, e.g., Hanssens, Parsons, and Schultz 2001) also does not seem to be appropriate, because the shape of the effect of the delisting over time would need to be specified beforehand. Furthermore, for small time series as the ones we study herein, estimation of intervention models is not straightforward.
Controlling for other marketing interventions
Unfortunately, no detailed price information is available in our database. However, this is not a serious problem. As we stated previously, this database pertains to purchases in four different stores. In two stores, the delisting actually took place, whereas in the other two, all detergent items remained on the shelf. The control stores are selected to be similar to the test stores in terms of assortment policy, square meters (large supermarkets), intensity of competition (five or more competitive supermarkets within a range of four kilometers), and urbanization (urban areas). Furthermore, basic marketing efforts are the same across these stores; that is, the same (price) promotions occur in all stores at the same time. This implies that delisted items were not promoted in the control stores. Therefore, changes in the price level do not influence a relative comparison across brands. However, promotions will affect estimates for the development of category sales in the control stores. To correct for the presence of promotions we construct a promotional indicator. Because we know that promotions occur in all stores at the same time, we base the promotional indicator on the total sales across all stores. To identify the weeks in which a promotion (of some sort) took place, we estimate a model with a cubic spline function for the total sales across all stores. We assume that a promotion occurred for each observation with a large positive error; that is, we compare the error with the estimated standard deviation of the residuals. We label the weeks in which the error is larger than 1.5 times the standard deviation as a promotion. Note that the presence of multiple promotions leads to a rather high estimate of the residual standard deviation. We then reestimate the same model, now including the promotion indicator, to identify promotions that had a smaller impact. Again, we use the same rule, but the estimate of the standard deviation is smaller. Finally, we check the derived promotion indicator for face validity. Note that the definition of this promotional indicator is irrelevant for the effects of the delisting we estimate. Again, this is because promotions occur in all stores, and we use control and test stores to identify the effect of the delisting.
Empirical Results
Analysis 1: Total Category Sales
We first focus on the weekly total category sales for each store, which can be directly obtained from the database by simple aggregation. In Figure 2, we show time-series plots for the category sales in each store, which demonstrate a slight decrease in sales for all four stores. This overall decrease in detergent sales cannot be attributed to the delisting because in the control stores, the number of available items remained constant. To assess the actual effect of the assortment reduction, we must compare the changes in the test stores to changes in the control stores.
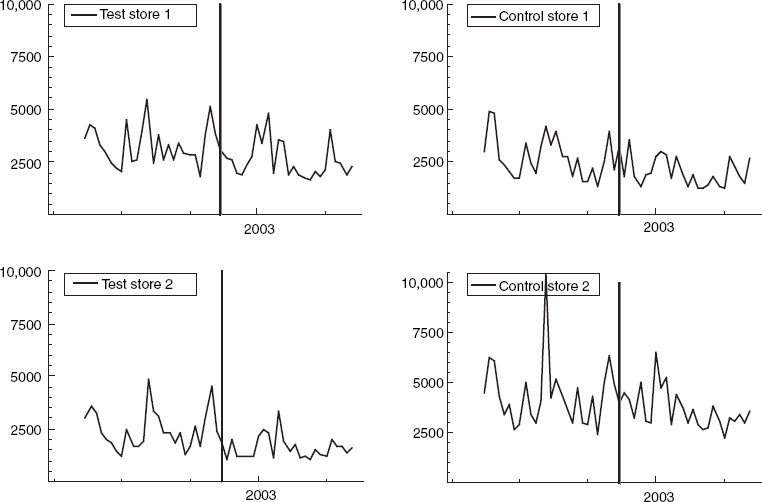
TOTAL WEEKLY CATEGORY SALES PER STORE
In Table 3, we provide the parameter estimates for Equations 2a and 2b, with which we model the total category sales per store. As regressors, we include the previously discussed promotional indicator to control for promotional effects. We also include a dummy variable to correct for an influential outlier. This outlier corresponds to a week of extremely low reported sales in one of the stores. The retailer informed us that this was due to an error in the data collection system and that the actual sales were higher; however, the exact figure was unknown. Although the stores were selected in advance for their similarities in detergent shelf metrics, the estimated store intercepts show some differences in baseline sales across the four stores, which may be explained by the unique characteristics and environment of each store. The most interesting results appear in the final lines of Table 3, which display the estimated function value of f(t|γ) and g(t|θ) at the chosen knot points and the associated standard errors. The results show that the effect changes over time. Therefore, a model in which the effect of the delisting is captured by a single dummy variable is not valid. In Figure 3, we depict the same values together with the interpolated values, with a 95% confidence interval to indicate the uncertainty in these estimates. The function value of the spline at any point in time is a linear combination of the parameters. Therefore, the confidence intervals can be obtained easily from the covariance matrix of the parameter estimates. The first graph in Figure 3 shows that the decrease in overall detergent sales, in both the test stores and the control stores, occurs mainly during several weeks in early 2003. For this period, f(t|γ) is significantly different from 0 and negative. The second graph portrays the effect that may be attributed to the delisting. As we expected, the drop in category sales reaches its maximum negative sales effect in the first few weeks after the delisting took place. In later periods, sales recover, and at the end of the sample, the decrease in sales is significant only at 10%. These results seem to indicate that the delisting mainly had a (substantive) short-term effect. In contrast, we find only weak evidence for a long-term effect. On the basis of the estimation results, we can easily test the hypothesis that the long-term effect equals the immediate effect (H0) against the onesided alternative that the long-term effect is smaller in magnitude (Ha). For this comparison, we can directly compare the parameter estimates for the spline function g(t|θ) at the points 2002:46 and 2003:19. On the basis of the results, we reject H0 at a 5% significance level.

Effect of the Delisting on Detergent Category Sales (95% Confidence Bounds)
ESTIMATED PARAMETERS FOR LOG WEEKLY CATEGORY SALES (EQUATIONS 2A AND 2B)

These results also show that a model with a single intervention dummy or a linear function would not have captured the changes in sales adequately. The effect we find is nonlinear.
Analysis 2: Decomposition of Former Buyers versus Former Nonbuyers
The parameter estimates for Equation 3 appear in Table 4. In this case, we consider only sales generated by households that made at least one detergent purchase before T1. The sales of the group of former nonbuyers in the control and test stores do not differ significantly after the delisting, as the estimates for g(t|θ) demonstrate. Former buyers of delisted items in the control stores also do not behave significantly different from the other households in the control stores. The estimates for the function h(t|φ) demonstrate this. However, in the most interesting case, for consumers who are actually confronted with the removal of their preferred item or brand, we find a significant decrease in sales; the estimates for k(t|v) reflect this. We also show this finding in Figure 4. The two graphs in Figure 4 indicate the changes in sales in the test stores relative to the control stores. The top graph shows that for households in the test stores that did not buy a delisted item before T1, we find no significant effect on sales (g[t|θ]), whereas the lower graph (k[t|v]) shows that for the group of former buyers of delisted items in these stores, there is a strong and significant decrease in sales a few weeks after the delisting. At the end of our sample, the effect of the delisting remains rather negative though, again, significant at only a 10% level. Thus, we find only weak evidence for a long-term sales effect of the assortment reduction among former category buyers of delisted items. 4

Effect of the Delisting on Detergent Category Sales, Split Into Sales Change Due to Delisting for Former Buyers and Former Nonbuyers (95% Confidence Bounds)
Following the work of Boatwright and Nunes (2001), we also performed a further decomposition by investigating sales effect differences between former category buyers of delisted brands and former category buyers of delisted items. However, our results did not show any significant differences between these two groups of former category buyers. This contrasts with the findings of Boatwright and Nunes (2001), who report different effects. The estimation results of this analysis are available on request.
Estimated Parameters for Log Weekly Category Sales, Split Into Former Buyers of Delisted Items and Former Nonbuyers (Equation 3)

Analysis 3: Sales of New Category Buyers
In this analysis, we consider only new category buyers. These buyers purchased detergents only after the assortment reduction and thus did not purchase in the weeks before the assortment reduction. However, the term “new category buyer” is not totally justified, because our observation period before the assortment reduction on which we base our grouping is only 26 weeks. Thus, our subsample of new buyers may also include some households that buy detergent infrequently in the considered stores and therefore did not make a purchase before the delisting in the considered period. The detergent sales of new buyers equal 0 before the delisting. Therefore, we cannot apply the same methodology as we did previously. Instead, we consider the detergent sales generated by the new buyers relative to the total detergent sales. For all stores, we expect this percentage to increase over time because some households that bought detergent before the delisting may stop purchasing detergents at the store, and more and more new households will enter. The stores in which the assortment reduction actually took place may attract more new buyers than the control stores, which will lead to a larger percentage of purchases made by new buyers. To quantify the difference, we again perform a regression analysis using spline functions (see Figure 5). We initiate our analysis two weeks after the start of the delisting. In Figure 5, the top graph shows the estimated baseline effect, which demonstrates that regardless of the delisting, the percentage of sales attributed to new buyers tends to increase over time. The bottom graph shows the additional effect in the test stores, namely, the additional share of sales of the new buyers in the test store. Immediately following the delisting, there is no significant difference between the control and the test stores. However, at the conclusion of our sample, the new buyers generate 28% of the sales in the control stores and 38% in the test stores, which is a significant difference (p < .01). A possible explanation for this finding is that the reduced assortment enhanced search efficiency and thus attracted more new buyers than did the nonreduced assortment.
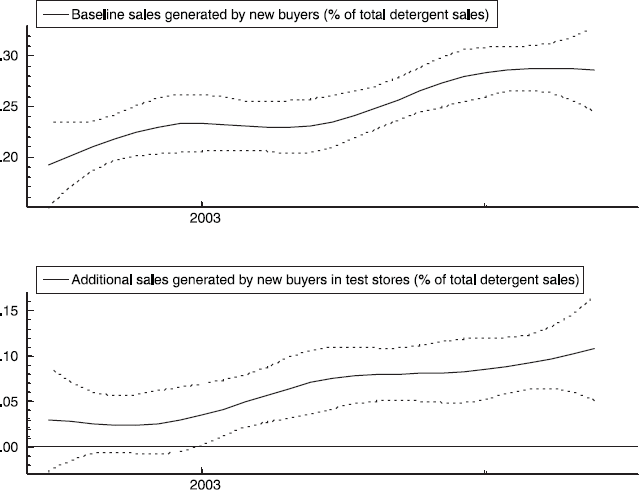
Sales Effect Due to Entrance of New Buyers
Supplemental Process Data
To understand the found sales effects further, we collected supplemental process data. We investigated in the test stores whether perceived assortment variety, perceived search efficiency, assortment satisfaction, and actual search time changed because of the assortment reduction. In particular, we found that search efficiency might be increased, and search time might be decreased. This could explain why we found a significant increase in category sales originating from new buyers in the test stores.
Research Methodology
Data collection
In the two test stores, data were collected 1 week before and 12 weeks (Week 6 of 2003) after the assortment reduction occurred. 5 Customers were observed as they made their detergent purchases by experienced interviewers from a research agency. Directly after the customer bought his or her detergents, the interviewer contacted the detergent buyer to determine whether he or she would participate in this study. In total, 333 respondents participated in the in-store survey (before purchase: 179; after purchase: 154; total response percentage = 65%). 6
Given an interpurchase time of approximately 4 weeks for detergents, we chose to conduct the “after” survey 12 weeks after the delisting took place to give consumers enough time to get used to the new shelf.
Because approximately 80% of the test store sales were covered by loyalty-card purchases, the additional study may be viewed as an in-depth survey of a subset of the households examined in Study 1.
To assess whether the participants in the before and after surveys had the same background, we collected demographic variables, such as gender, age, and household size, and buying behavior variables, such as primary buyer, store loyalty, store visit frequency, and detergent buying frequency. Using pairwise t-tests and chi-square tests, we did not find any significant differences between the two samples for these variables.
In the week of the second measurement, the total category sales in the test stores are not significantly different from the total category sales in the control stores (see Table 3; estimate of g[t|θ] for t = 2003:6). However, former buyers of delisted items in the test stores purchase significantly less than those in the control stores (see Table 4; estimate of k[t|v]). Therefore, it must be that in this week, new buyers account for a larger share of the purchases in the test stores; unreported estimates of the spline functions for the new buyers confirm this.
Measurement
Following the work of Hoch, Bradlow, and Wansink (1999) and Van Herpen and Pieters (2002), we measure perceived assortment variety with a four-item, five-point Likert scale (1 = “strongly disagree,” 5 = “strongly degree”). The items include “This assortment offers a wide variety of detergent,” “I definitely miss some detergent items on this shelf,” “This shelf offers the full range of detergent items,” and “There are no important detergent items missing on this shelf.” The coefficient alpha of the scale was .79. We defined perceived search efficiency as customers' perceived ease in finding the preferred item (Broniarczyk, Hoyer, and McAlister 1998). Again, we used a four-item, five-point Likert scale, with a coefficient alpha of .67. The items we used include “In this product assortment it is easy to find the detergent item I prefer,” “This is an orderly organized assortment,” “Some items are difficult to find in this assortment,” and “This shelf offers the detergent items in a logical order.” We conducted a confirmatory factor analysis to assess whether both factors are unidimensional and found sufficient scores for the fit statistics (root mean square error of approximation = .06, goodness-of-fit index = .96, and confirmatory fit index = .95; Bagozzi and Yi 1988; Baumgartner and Homburg 1996). The factor loadings were all significant and larger than .5. Therefore, we formed composites of the underlying items of perceived variety and perceived search efficiency. Finally, we used a single item to measure assortment satisfaction; specifically, we asked consumers to evaluate the detergent shelf with a grade from 1 to 10.
We also collected the actual time (in seconds) consumers spent searching for an item in front of the detergent shelf. The interviewer started the time measurement when the detergent buyer entered the aisle and started looking at the detergent shelf and stopped the clock when the customer picked the first detergent item off the shelf.
Results
The perceived assortment variety does not change after the assortment reduction occurred (3.9 before versus 3.9 after; p > .10), which indicates that even the large cut of 25% of the items did not lead to lower choice perceptions among detergent buyers. However, in line with the work of Broniarczyk, Hoyer, and McAlister (1998), detergent buyers in the after-reduction group evaluated the detergent shelf significantly better in terms of perceived search efficiency than did the before-reduction group (4.1 versus 3.7, respectively; p < .01). This finding is confirmed by the results for actual search time in front of the detergent shelf, which demonstrate that the after group used significantly less time to buy the first detergent item than did the before group (14 seconds versus 20 seconds; p < .05). This finding reveals that a “cleaned-up” shelf lowers search costs among buyers. Because the perceived assortment variety did not change and perceived shelf efficiency increased, we also might expect an increase in the assortment evaluation, which our results confirm. Assortment evaluation significantly increased from 7.4 before the reduction to 7.6 after the reduction (p < .05). 7
We also conducted a regression analysis in which assortment satisfaction was the dependent variable and perceived assortment variety, perceived search efficiency, and actual search time were explanatory variables. This analysis reveals significant effects of assortment variety (p < .10), perceived search efficiency (p < .01), and actual search time (p < .05).
Thus, the main findings arising from the supplemental process data are that the assortment reduction increases search efficiency (both perceived and actual search time) without lowering assortment variety among detergent buyers. As a consequence, assortment satisfaction increases. This result fits our finding that more new buyers are attracted to the stores in which the assortment reduction was implemented. However, there is one cautionary note. As this experiment includes only buyers of detergents, we did not include any evaluations of nonbuyers either before or after the assortment reduction, which could have two potential effects. First, we did not include former buyers of delisted items who switched stores or postponed their purchase because their detergent product was not available in the after-reduction sample. As a consequence, evaluations measured after the reduction could be overstated because we did not include the dissatisfaction of these former buyers. Second, because of the reduced complexity of the assortment, new detergent buyers could be attracted to the category, even though we did not include these buyers in the before-reduction survey. Because this group should have a lower assortment satisfaction, evaluations in the before-reduction survey could be inflated as well.
Discussion
In this collaborative research project, we investigated the short- and long-term sales effects of an assortment reduction. Although this study pertains only to a single category, it contributes to the literature on assortment reductions in that we (1) investigate the short- and long-term sales effects of this reduction, (2) decompose the short- and long-term sales effects between former buyers and nonbuyers of the delisted items, (3) consider the entrance of new buyers as an explanation for the finding of neutral or positive sales effects in prior studies, and (4) investigate differences in actual search time before and after the assortment reduction. In addition, we conducted a more qualitative study that showed that increases in search efficiency might explain the increasing sales from new buyers.
The main conclusions of our study are as follows: First, on an aggregate level, we find a short-term negative sales effect and no strong significant long-term negative sales effect. Thus, reducing an assortment by delisting mainly low-selling items and brands has a negative sales effect in the short run. Second, extending the findings of Boatwright and Nunes (2001), we find that strong short-term negative sales effects occur mainly among former buyers of delisted items, probably because of their initial postponement and store switching. In the long run, the negative sales effect dissipates slowly. Within the time frame of our database, the results indicate some evidence (but not strong) of a long-term negative sales effect among former buyers of delisted items. Third, our study reveals that the assortment reduction may induce non–category buyers to buy within the category. We assume that the improved search efficiency, as shown with the supplemental process data and reflected in increases in perceived search efficiency and a decreased search time, induces noncategory buyers to purchase detergents in this store. This finding provides an important empirical confirmation, in the context of a natural experiment, of the findings in several experimental studies in consumer research and psychology that too large of an assortment may influence retail customers to refrain from buying products because of the high search complexity (Botti and Iyengar 2004; Gourville and Soman 2005). However, the increased search efficiency may not be attributed solely to a reduction in the number of items. In addition, the duplication of facings of more popular items may have increased search efficiency because remaining items that have more facings can be recognized more quickly (De Heer 2001). However, this duplication is an automatic consequence of an assortment reduction and a constant category space. This is only one single study in one category. Thus, more research is required to generalize this finding. One final methodological contribution of this research is that to our knowledge, this is the first application of a cubic splines methodology in marketing. It is a useful model for researchers who aim, for example, to study the effect of one single event, such as an assortment reduction, on sales over time.
Management Implications
On the basis of this study, our partner retailer decided to roll out the assortment reduction on a nationwide level. The results of our study provided the retailer with confidence that an assortment reduction would not significantly harm its detergent category sales in the long run. On the basis of consumer complaints in the pilot study, some small adaptations in the number of items to delist were made, so that in total, 32 of the 37 tested items were delisted in the final rollout. The results from this rollout indicate that detergent sales, measured as a percentage of total store sales, were not significantly affected by the assortment reduction in the long run.
The collaborative research project also provides some information for the retailer regarding the execution of assortment reduction projects. One key lesson is that a sole focus on short-term sales effects leads to incorrect conclusions. Instead, the time span for analyzing these effects must be long enough to include long-term effects. Another key lesson is that assortment satisfaction apparently can be improved through assortment reduction and that new category buyers can be attracted. Therefore, the retailer continued its assortment reduction projects in other categories in which customers might find assortments that are too large.
Research Limitations and Further Research
Our study has some limitations that may provide worthwhile opportunities for further research. First, our study is based on a single product category. Assortment reduction effects may differ across categories. This has already been shown by Borle and colleagues (2005). Therefore, additional studies should include more categories to determine whether our findings can be generalized to other product categories. For example, researchers could study hedonic categories, nonstockpileable product categories, impulse categories, and so forth (Narasimhan, Neslin, and Sen 1996). Second, because each store has its own unique characteristics and each store environment is different, further research should be based on data collected from more than four stores. Third, this study considered the effects of an assortment reduction at the aggregated category level. Other studies have investigated consequences of an assortment reduction at the disaggregated customer level. For example, Borle and colleagues (2005) consider how assortment reductions affect shopping frequency and purchase quantity, providing a deeper insight into consequences at the customer level. More research is required both at the aggregated and at the disaggregated level because the number of studies on the effects of assortment reductions is still limited. Fourth, in practice, assortment reduction mainly implies delistings of low-selling items and brands, but delistings also may include high-equity brands, for example, when the retailer has a conflict with a national brand manufacturer. Additional research should study the short-and long-term effects of these delistings. A related possibility is that the manufacturer decides to delist an item. In this case, the item will not be available in any store. Such a delisting will probably have a different effect. Fifth, consumers may be confronted with multiple delistings in one or more categories. Further research efforts could focus on how multiple delistings affect category and store sales.