
Abstract
Many of the products introduced during the past two decades have been services rather than goods. An important influence on the growth and long-term profits of these services is customer attrition, which can occur at the category level (disadoption) or between firms (churn). However, the literature has rarely modeled how services penetrate a market and has not evaluated the effect of attrition on growth. The authors combine diffusion modeling with a customer relationship approach to investigate the influence of attrition on growth in service markets. In particular, the authors model the effects of disadoption and churn on evolution of a category and on growth of individual firms in a competitive environment. The authors show how neglecting disadoption can bias parameter estimation and, especially, market potential. They also derive an expression for the customer equity of a growing service firm and apply it to valuation of firms operating in competitive industries. The results for six of seven firms in four service categories are remarkably close to stock market valuations, an indicator for the role of customer equity in valuations of growing service firms.
Many of the new products introduced during the past few decades have been services rather than durable goods. Widely used services, such as cell phones, satellite radio, and financial services (e.g., direct banking), were not available before 1980. The growth of the Internet has also driven the offering of many new services, including instant messaging, shopping portals, and online brokerages. Indeed, the service sector in the United States employs most of the country's work force, is responsible for more than 80% of the gross domestic product, and is growing considerably faster than the goods sector (U.S. Department of Commerce, Bureau of Economic Analysis 2003; Zeithaml and Bitner 2003).
A considerable influence on the market growth of a new service is customer attrition. Beginning with the initial stages of penetration into a market, there are customers who leave the service: They switch to competitors or, alternatively, leave the category. In this sense, the growth of a new service is similar to a leaking bucket—there is an inward flow of adopters and a concurrent outward flow of customers who leave. Customer attrition (and its complement, customer retention) has gained considerable attention from managers and researchers in recent years after demonstrations of the relationship between a firm's customer retention rate and its long-term profits (Reichheld 1996). Customer retention is a basic component in the computation of customer lifetime value (CLV) (Kumar and Shah 2004), and its antecedents and consequences for service firms have been the focus of much research attention in recent years.
Despite this, however, the literature on the evolution of markets for new products has dedicated little effort to defining and modeling the effect of attrition on the growth of service markets. In general, the diffusion modeling literature, which has been the main thrust of research on the growth of new markets (Bass 1969; Mahajan, Muller, and Wind 2000), has focused on the growth of category-level markets for single-purchase durable goods and has not examined services and customer attrition. Studies examining the growth of competitive markets have mostly focused on the competition for acquiring new customers from the remaining market potential and not on interfirm switching (Kalish, Mahajan, and Muller 1995; Krishnan, Bass, and Kumar 2000; Teng and Thompson 1983).
The goal of this article is to provide a framework that enables researchers to understand how the dynamics of customer attrition affect the growth of markets for services and to examine the consequences for management. We present a multifirm model that captures the complex dynamics of customer acquisition and retention during a service firm's growth: In any given period, a firm can acquire customers from the pool of nonusers (which includes new customers and customers who disadopted the category in the past) and those who switch from a competitor (known as “churn”). Alternatively, the firm can lose customers to a competitor (churn) or to disadoption from the category. Although the dynamics are not trivial, our model is relatively simple and enables an in-depth analysis of the growth of services.
We demonstrate the implications of our approach in two ways. First, we begin with a simple model that focuses on category-level growth. This model enables us to consider how category-level attrition (disadoption) affects the growth of service categories. We show that neglecting attrition and using the classic diffusion approach—an approach intended originally for durables but widely used in service markets—can create considerable bias in parameter estimations and, more seriously, in estimates of market potential.
Second, we construct a model of a competitive brand-level market that considers interfirm churn and category disadoption. We use this model to calculate the customer equity for service firms. Customer equity, which represents the sum of the lifetime values of a firm's customers, has emerged in recent years as a key marketing measure that can be used to assess the return on marketing activities and the value of firms (Gupta, Lehmann, and Stuart 2004; Kumar and George 2007; Peppers and Rogers 2005; Rust, Zeithaml, and Lemon 2000). Our model for calculations of customer equity enhances existing aggregate approaches in two ways: It (1) provides for brand-level analysis and (2) incorporates attrition both in CLV and in the growth function. Thus, our model is especially well suited to cases such as cell phone service, in which interfirm customer churn is an integral part of the growth process. Similar to Gupta, Lehmann, and Stuart (2004), we compare our customer equity measures with estimations of firms’ values by the stock market and show that, in six of seven cases in four service categories, our estimations are notably close to the stock market valuations for the firms. We also show that neglecting to take attrition into account leads to a considerable underestimation of the value of the customer base.
The rest of this article continues as follows: We briefly review the relevant literature regarding the empirical and theoretical aspects of attrition and service diffusion. Next, we present our model at the category level and its underlying assumptions and study the influence of disadoption on market growth. We then explore the competitive model and calculate the customer equity of seven brands of services in markets for mobile phones, online brokerages, online book retailers, and satellite radio providers and discuss their customer equity relative to a model without attrition and to stock market valuations. We conclude by discussing the theoretical and practical implications.
Diffusion and Attrition
Services have traits in common with both durable goods and fast-moving consumer goods. As do sellers of fast-moving consumer goods, service providers depend on repeat purchases for commercial success. The growth of the market for fast-moving consumer goods is usually attributed to advertising, promotion, and consumer trials; therefore, studies of such goods usually rely on frameworks such as stochastic choice models. Conversely, purchase decision making for services is governed by internal communication mechanisms, such as word of mouth and imitation (Murray 1991; Wangenheim and Bayon 2004). In this sense, services are similar to durable goods. However, a major difference between durable goods and services is the existence of the outward flow of customers, or customer attrition, which is when a customer decides to terminate the relationship with the provider.
Attrition is mainly relevant to services that entail regular repurchases and in which customers develop long-term relationships with service providers (Berry 1999). Thus, we focus on continuous service encounters that are characterized by some kind of longitudinal customer-firm relationship (Bolton and Lemon 1999). Examples include cable television, telephone, online services, and financial services.
Attrition (and its complement, retention) has become an important subject when analyzing the relationships of firms with their customers. Since the early 1990s, the business literature has focused on retention rate as a major component of firms’ long-term success (Reichheld 1996). In the academic literature, there is increasing attention being paid by marketing researchers to the antecedents and consequences of customer retention (Lemon, White, and Winer 2002; Lewis 2004; Thomas, Blattberg, and Fox 2004).
Because we approach attrition from both category and firm levels, two research schools are of interest: diffusion-of-innovation modeling and competitive dynamics during market growth. Regarding the former, customer attrition has not been formally integrated into models of the diffusion of innovation. In general, the diffusion literature has focused on the category level and has modeled the diffusion of services as if they were durable goods for categories that include cell phones (Krishnan, Bass, and Kumar 2000), landline telephones (Jain, Mahajan, and Muller 1991), cable television (Lilien, Rangaswamy, and Van den Bulte 2000), and online banking (Hogan, Lemon, and Libai 2003).
Some diffusion-related studies have analyzed long-term effects that extend beyond the original purchase, including studies of the replacement of worn-out units and multiunit ownership (Kamakura and Balasubramanian 1987; Ratchford, Balasubramanian, and Kamakura 2000; Steffens 2003), the growth of successive generations of products (Mahajan and Muller 1996; Norton and Bass 1987), and trial–repeat models for pharmaceuticals (Hahn et al. 1994; Lilien, Rao, and Kalish 1981). Despite their long-range views, however, these models focused on goods, not on services, and are not related specifically to attrition.
Some diffusion studies have examined growth in a competitive market (for a review, see Chatterjee, Eliashberg, and Rao 2000). In general, these studies have investigated one of two scenarios. One is the case of a saturated market, which is usually described using a Lanchester formulation. In this scenario, the total number of customers remains constant, and the firms compete directly to gain each other's customers (Chintagunta and Vilcassim 1992). The other scenario, which is usually described using a Vidale–Wolfe formulation, typically assumes that firms compete for the remaining market potential of nonadopters; the models do not account for the direct transfers of customers between firms (Eliashberg and Jeuland 1986; Givon, Mahajan, and Muller 1995; Krishnan, Bass, and Kumar 2000; Parker and Gatignon 1994). Thus, there is a need for an approach that explicitly incorporates both customer switching and competitive growth.
With the general term “attrition,” we denote any case of a customer who terminates a relationship with a service provider. In competitive environments, such as those for mobile telephone, cable and satellite television, e-banking, and other subscriber-based services, attrition is an important operational measurement that is monitored regularly by service providers. Attrition rates are influenced by customer satisfaction (Bolton 1998), competitive pressure (Oliver 1999), switching costs (Burnham, Frels, and Mahajan 2003), and customer information on alternatives (Capraro, Broniarczyk, and Srivastava 2003).
Most of the literature on customer profitability has focused on cases of churn (when an exiting customer is acquired by a competitor). However, customers also can disadopt; that is, they can leave the service category altogether (Hogan, Lemon, and Libai 2003). Empirical evidence for service industries suggests that many customers stop using a new service during the growth stage (Kramer 2002; Reichheld and Schefter 2000; Sarel and Marmorstein 2003), a phenomenon that may intensify as consumers are pressured by firms to adopt new technologies (Meuter et al. 2005). Thus, attrition consists of churning and disadopting customers, and the attrition rate is the sum of the churn and disadoption rate.
There are primarily two ways marketing modelers have considered customer attrition. “Lost-for-good” attrition occurs when the customer is not expected to return in the foreseeable future. Because of their simplicity, lost-for-good assumptions frequently have been used for lifetime value calculations (Berger and Nasr 1998; Gupta, Lehmann, and Stuart 2004). Use of the lost-for-good approach has been criticized by Rust, Lemon, and Zeithaml (2004), who propose an alternative “migration” approach, in which the customer leaves for a limited time—possibly to a competitor—and then may return.
What kind of attrition does disadoption represent? Hogan, Lemon, and Libai (2003) model both a case in which the customer is lost for good after disadoption and a case in which the customer leaves the service and then comes back during the growth process. The latter case is probably more realistic for most innovative services. Longitudinal improvements, especially in terms of the service's price and quality, coupled with reduced uncertainty and a growing social pressure to adopt, enable a customer who is returning to a previously dropped service to form reasonable expectations about the service. Indeed, one reason for considerable investments in online banking in the late 1990s was the realization that the low utility of the service in its initial form was driving attrition. When online banking became more user friendly and functional, some of those who had tried it earlier and were disappointed eventually returned (Monahan 2000).
Model of Category-Level Service Growth with Attrition
In this section, we introduce a category-level model for services that incorporates disadoption and use the model to understand how the disadoption rate affects the growth of a new service category. As we noted in the previous discussion, two options are available for modeling attrition in general and disadoption in particular. In the first, the lost-for-good disadopter never rejoins the service, and in the second, the disadopter may rejoin the service at a later date.
From a dynamic modeling point of view, the lost-for-good option is problematic because the constant disadoption leads to a zero level of adoption in the long run, regardless of the values of the rest of the parameters. This is inconsistent with both classical diffusion approaches and empirical data. In addition, as we mentioned previously, anecdotal evidence supports the option that a customer might eventually return. Note that though a customer might theoretically return immediately after disadoption, readoption typically takes a while because the customer's return is subject to the diffusion process. Thus, in our model, and consistent with calls to take customers’ eventual return into account when modeling attrition (Rust, Lemon, and Zeithaml 2004), we assume that disadopting customers can rejoin.
When disadopters are given the possibility to return, it must be decided how to model the external and internal influences on returning disadopters compared with first time adopters. There is no empirical evidence that supports a clear assumption on this point, and yet studies of CLV commonly assume uniform influence of acquiring new customers and regaining former ones (Villanueva and Hanssens 2007). Recent approaches that have examined the recapturing of lost customers have also avoided making assumptions about reactions to marketing efforts by new versus recaptured customers (Thomas, Blattberg, and Fox 2004). Given the absence of detailed information on return probabilities, we do not distinguish between these two types of customers in the potential market. In the final section of this article, we discuss the potential implications of relaxing this and other assumptions.
Let N(t) be the users or subscribers, m the market potential, p and q the external and internal parameters, and δ the disadoption rate. Thus, the diffusion of the new service is given by the following equation:

Note that at each time, we assume that only those who did not disadopt spread positive word-of-mouth communications about the product. Thus, the degree of the word-of-mouth promotion by retained customers is the same (q), but the effective word-of-mouth impact is reduced as a result of the disadoption rate δ from [qN(t)]/m to [q(1 – δ)N(t)]/m. Because disadopters return to the market potential, the remaining market potential is m – N(t) and is not affected by the disadoption.
Equation 1 is a first-order quadratic differential equation. Using the initial condition N(0) = 0, we can integrate Equation 1 to arrive at the following solution (the derivations appear in Web Appendix A at http://www.marketingpower.com/jmrapril09):

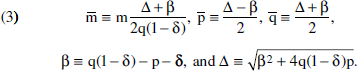
The market penetration curve (Equation 2) has the same functional form as the Bass (1969) equation but with different parameters:
To assess the reliability and identification of the model, we performed a series of simulations in which we generated data with our model, estimated its parameters, and observed whether it returned the correct parameters. We generated a full factorial combination of parameter values in typical ranges and performed nine sets of 64 simulations each: one with clean data and the others in which we added a random noise to the data (each point of data was perturbed with a normally distributed noise term, whose standard deviation determined the noise level). We checked several noise levels and two noise generation mechanisms—one whose noise term had a fixed standard deviation (normalized as a percentage of market potential) and relative noise, in which the standard deviation of the noise term was proportional to the value of each data point. Although, as we explain subsequently, we treat δ as exogenous in the empirical estimation, the simulations estimated the disadoption rate from the data. The simulation results, which are available in Web Appendix B (http://www.marketingpower.com/jmrapril09), indicate that even in the high noise level, the majority of the parameters were correctly estimated; for example, in the (relative) 6% noise level, 93% of the parameters were not significantly different from the original parameters at the 5% level.
An important implication of Equation 2 is that the maximum number of subscribers,
The existence of an effective market potential raises the issue of interpretation of that potential: It can be viewed either as the number of consumers who will ever try the product or as the level of market saturation. When there is no disadoption, the two interpretations coincide. However, in the presence of disadoption, these are two different constructs: m is defined as the number of people who will ever potentially try the service, and the level of market saturation is
Given the sensitivity of the diffusion process to levels of disadoption, the extent to which ignoring attrition when modeling service growth biases the parameter values comes into question. We assume a growing service category in which the diffusion parameters are estimated from continuous service (e.g., subscriber) data with a disadoption rate δ. As we showed previously, the penetration curve described in Equation 2 is equivalent to the Bass curve with
To demonstrate the magnitude of the bias, we used data from three U.S. service categories that were evaluated in previous diffusion studies: cell phones (Krishnan, Bass, and Kumar 2000; Lilien, Rangaswamy, and Van den Bulte 2000), cable television, (Lilien, Rangaswamy, and Van den Bulte 2000), and online banking (Hogan, Lemon, and Libai 2003). For each service category, we obtained historical data on the number of subscribers from industry and financial reports (10K and 10Q). We used nonlinear least square estimates (Putsis and Srinivasan 2000) to evaluate p, q, and m from Equation 1.
Disadoption rates (δ) are constantly monitored by firms and by industry analysts, so we treated them as exogenous. We used industry data and the literature to obtain values for disadoption levels (δ) for each industry. On the basis of the industry reports, we estimated a yearly attrition rate of 16.5% for the U.S cable industry (see, e.g., annual reports by the Federal Communications Commission and Kramer 2002) and 16% for online banking (see, e.g., O'Sullivan 2000). For the cell phone industry, we used the average disadoption rate of 8% that we computed in our empirical analysis (which we present subsequently).
Table 1 displays the results of the empirical analysis and suggests that the potential for bias is considerable. For the services listed, the average overestimation of p is 46%, the average underestimation of q is 39%, and the average underestimation of m is 30%.
BIAS IN PARAMETERS FOR THREE SERVICE CATEGORIES IN THE UNITED STATES

Notes: Standard errors are in parentheses.
Another misinterpretation pertains to the values of estimated p and q. Because p is usually regarded as being influenced by the firm's advertising policy, the biased p may lead firms to overestimate the influence of their advertising and, consequently, to underinvest in advertising. Similarly, the biased q may lead to undervaluation of the power of internal influences in the industry. Finally, neglecting attrition may be problematic when comparing penetration curves for countries or industries that differ in their disadoption rates. In such cases, differences in the curves may be related to p, q, and m, so at least some of the difference is due to the different disadoption rates.
Competitive Services Growth Model
Next, we present a model that describes the growth of a service firm and takes into account the two forms of attrition—churn and disadoption. Consider a firm that introduces a new service into a market with potential m and in which there are k competing firms. At every time t, there are customers who stop using the new service. Some of them disadopt; others defect to competitors. The attrition rate, denoted by ai, consists of disadoption and churn in an additive form: Total attrition rate (ai) = disadoption rate (δi) + churn rate (ci). Figure 1 illustrates the flow of customers to and from a focal firm in a three-firm market.
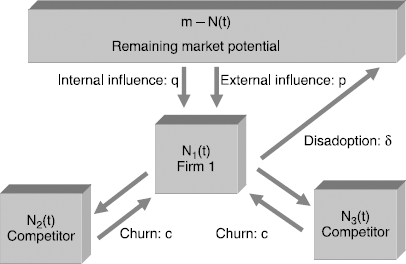
CUSTOMER FLOW TO AND FROM THE FOCAL FIRM (FIRM 1) IN A THREE-FIRM MARKET
Let Ni(t) be the number of subscribers of firm i at time t. The total number of subscribers in the category is N(t) = N1(t) + N2(t) + … + Nk(t). Let pi be a parameter representing the power of external influence (advertising and other marketing efforts), and let qi represent the power of internal influence (typically, word of mouth and imitation). As in conventional diffusion modeling, we assumed that word of mouth is exchanged between users and nonusers. We also assumed that internal influences are at the brand-specific level; that is, potential users join a brand of service only as a result of communication with existing customers of that brand. In this sense, we took the approach of Mahajan, Sharma, and Buzzell (1993) and Kalish, Mahajan, and Muller (1995).
Under the preceding assumptions, the diffusion, which we illustrate graphically in Figure 1, can be described using the following model for firm i = 1 … k and ai = ci + δi:

The relationship between this competitive model and the category-level one appears in Web Appendix C (available at http://www.marketingpower.com/jmrapril09).
Two issues are worth additional discussion at this point. First, consistent with the category-level model, at each point, we assume that only the (1 – δi)Ni(t) users who did not disadopt spread positive word-of-mouth communications. Second, we distributed churning customers among the competing firms according to the distribution parameters ∊ij, the share of the churn of firm j that goes to firm i. Here, we assumed that the churning customers are distributed according to the relative number of subscribers for each firm. Thus, the specification for ∊ij is given by
where ∊ii = 0 and N = ΣiNi.
Equation 4 can be solved analytically under some restrictive conditions (see Web Appendix D at http://www.marketingpower.com/jmrapril09). The solution is an S-shaped function that is similar to the penetration function of Equation 2 but with an additional term that describes the balance between a firm's effectiveness in attracting adopters and the attrition's components.
Similar to our category-level model, to validate the identification and reliability of the model, we performed a series of simulations in which we generated data with our model, estimated its parameters, and observed whether it returns the correct parameters. We randomly sampled 300 combinations of a full factorial set of parameter values in typical ranges, and we performed ten sets of 300 simulations each—one with clean data and the others in which we added a random noise to the data. Each point of data was perturbed with a normally distributed noise term, whose standard deviation determined the noise level. As in the category-level case, we checked two noise generation methods: The first is a noise term with a fixed standard deviation, and the second has a relative noise with a standard deviation that is proportional to the value of the data point. The simulation results indicate that even for high noise levels, most of the parameters were correctly estimated. For example, in a 6% noise level, 96% of the parameters were not significantly different from the original parameters at the 5% level (see Web Appendix B).
The Customer Equity of Competitive Firms
Theory
In this section, we present an application of increasing interest among researchers and practitioners; we calculate the customer equity of firms. Customer equity is the sum of the CLV of each of the firm's customers (Kumar and George 2007; Rust, Zeithaml, and Lemon 2000; Villanueva and Hanssens 2007). This equity can be used, for example, as an objective function for determining the effectiveness of a firm's marketing mix and service activities when optimizing the trade-off between investing in customer acquisition and retention or when examining the effect of operational measures, such as satisfaction or attrition, on the firm's long-term profitability.
There are two basic approaches to customer equity measurement (for a review, see Kumar and George 2007). In a disaggregate-level approach, the value of each of the firm's customers is computed individually and then summed. It fits well when the supply of individual-level customer data is rich. Under an aggregate-level, top-down approach (Berger and Nasr 1998; Blattberg, Getz, and Thomas 2001; Gupta, Lehman, and Stuart 2004), firms use segment- or firm-level data to compute the average CLV and multiply that average value by the number of customers to arrive at the customer equity. Given the nature of our service growth model, we chose to use the aggregate approach.
While initial approaches to customer equity that focused on profit were calculated using existing customers (Blattberg, Getz, and Thomas 2001), later work defined customer equity as the discounted sum of profits from present and future customers (Rust, Lemon, and Zeithaml 2004). Indeed, for growing firms, the contribution of future customers to equity can be a significant part of the firm's overall equity, thus requiring estimating expected growth in the number of customers.
In the first attempt to rigorously examine the customer equity of a growing service firm, Gupta, Lehmann, and Stuart (2004) suggest an aggregate-level method for calculating the customer equity of growing service firms based on publicly available data, such as the number of subscribers, margins, and retention rates (see also Gupta and Lehmann 2005). For firm i, let the acquisition cost of a single customer be denoted by costi and the lifetime value of a single existing customer be denoted by CLVi. In addition, let Ni(t) be the number of customers of firm i at time t and ni(t) be the number of customers who join during period t. Finally, let the discount rate be denoted by ρ. Then, customer equity of firm i at time t is given by

The first term on the right-hand side of Equation 5 is the contribution of the existing customer base, and the second term is the summation over all future customer cohorts, discounted according to the time difference between the starting point t and the beginning of the revenue stream from the customer. Thus, customer attrition can have a dual effect on customer equity. First, attrition influences the individual customer's lifetime value. Second, in line with our discussion in the previous section, it affects the shape of the diffusion curve expressed by ni(t).
The value of Equation 5 depends on the functional shape of the growth curve. Gupta, Lehmann, and Stuart (2004) apply their model to data for the number of customers who ever adopted the product, not for the number of current subscribers; therefore, their work was not related explicitly to attrition or to competitive effects. We wanted to capture the influence of both attrition and competition; therefore, we applied Equation 5, where ni(t) is derived from the competitive services growth model in Equation 4. Note that with some restrictive conditions, Equation 5 with the penetration function of Equation 4 can be formally calculated to yield a solution involving the Gauss2F1 hypergeometric function (which is available on request).
In the following subsection, we demonstrate the dual effect of attrition on customer equity. We calculate the customer equity of seven service firms using the growth function of the services growth model and compare the results with the stock market valuation of these firms (see Gupta, Lehmann, and Stuart 2004). This comparison is of interest to both finance and marketing researchers because it illustrates the importance of a model that explicitly considers attrition of customers and shows the extent to which and the cases in which the stock market valuation agrees with or deviates from the straightforward customer equity approach we present here.
Empirical Estimation
Calculating equity in a competitive scenario requires a comprehensive set of data on market evolution. Because it involves estimation of the diffusion parameters for both the focal firm and its competitors, historical subscriber data are needed for all the players in the category. More complex still is the comparison with the stock market value. The firm must be public, and it should operate and be traded in a single competitive market.
Thus, there are several limitations on the types of firms that can be used for our study. An example of an industry in which attrition plays a dominant role is cell phone service providers. To study the cell phone market in this respect, we used data from World Cellular Information Service, a major data provider for this industry. Aiming to study the European cellular market, which includes 16 countries and more than 50 operators, we found that one operator—Belgium's Mobistar—matched our requirements. A similar procedure for Pacific Asia identified one Korean operator—SK Telecom.
Overall, we used data for 7 focal firms in five markets and their main competitors, for a total of 13 firms. The focal firms were Amazon.com, Barnesandnoble.com, E*Trade, Mobistar, SK Telecom, XM Satellite Radio, and Sirius Satellite Radio. Competitors of Mobistar (traded on the Brussels Stock Exchange) are Belgacom and BASE. Competitors of SK Telecom (traded on the New York Stock Exchange [NYSE]) are KT Group and LG Telecom. The two players in the U.S. satellite radio market are XM Satellite Radio and Sirius Satellite Radio, both of which are traded on the NASDAQ. In the United States’ fragmented market, online brokerage industry reports and E*Trade's (NYSE) analysis suggest that E*Trade's main competitors are Ameritrade and Schwab.
Amazon.com's case is more complex because it increasingly offers lines other than books. We compared Amazon.com (NASDAQ) with its major book competitor, the online service branch of Barnes & Noble, Barnesandnoble.com (which was independently traded on the NASDAQ until it was purchased by Barnes & Noble in the third quarter of 2003). During the time frame of much of our data points, book retailing constituted most of Amazon.com's revenue, and Barnesandnoble.com was considered Amazon.com's main competitor in the book market (Filson 2004; Mutter 2003). Nevertheless, Amazon.com's other growing business lines can affect assessments of its customer equity, which helps explain our results for Amazon.com.
We obtained customer and financial data from financial reports, 10K and 10Q forms, press releases, and World Cellular Information Service. Following Gupta, Lehmann, and Stuart (2004), we took the margins and acquisition costs as averages over the preceding four quarters. We took attrition rates for the satellite radio and cellular firms directly from the firms’ financial reports. We took attrition rates for online brokerage firms from a management report by Ameritrade. We took the rates of attrition for online book sellers from the work of Gupta, Lehmann, and Stuart. Table 2 summarizes the data for each firm.
DESCRIPTIVE DATA FOR THE SEVEN FOCAL FIRMS

Notes: Data on number of customers, quarterly margins, and acquisition costs are the latest available for each firm, except for Barnesandnoble.com, for which quarterly margins and acquisition costs are for September 2003—the time of acquisition (after that date, the firm no longer reported that data).
For each industry and firm i, we estimated the diffusion parameters pi, qi, m, and c with Equation 4, using seemingly unrelated, nonlinear least squares (SAS “proc model” with the seemingly unrelated regression option). We performed estimations for each firm within an industry simultaneously. Recall that overall attrition rates are constantly monitored by firms and that we could therefore treat them as exogenous. Although the model in Equation 4 allows for different attrition and churn rates among firms, in our analysis the attrition and churn rates (and, therefore, the disadoption rates) were taken as identical among competitors and equal to that of the focal firm. This was necessary because complete attrition data were available for the focal firms but not for the competitors. Moreover, we observed from trade publications and the limited data available that attrition rates of firms within the same industry are similar. In the case of the cellular and satellite radio firms, we had more comprehensive attrition data for the nonfocal firms, so we also ran the analysis by allowing the attrition and churn rates to vary among the competitors. The results of this additional analysis in terms of the other parameters were similar. However, we found that almost all the disadoption parameters were nonsignificant.
Note that for the cellular operators, the differences in rates between churn and overall attrition imply that, consistent with the managerial intuition in this industry, most of the attrition is churn. The disadoption rates are 7%–8%, which is consistent with the average value over time for cellular disadoption. In satellite radio, 63% of the attrition is disadoption (a quarterly churn of 1.75% translates to an annual churn of 6.8%, comprising 37% of attrition), which is typical of early development of technological industries.
Table 3 presents the parameter estimations for the 13 firms based on Equation 4. Having estimated the parameters, we calculated customer equity for the 7 focal firms using Equation 5. When calculating the CLV, we assumed a long-term planning horizon:

Parameter Estimations Based on Equation 4

p = .05.
p = .01.
The value of p, q, and churn for online books, online brokerages, and satellite radio refer to quarterly data.
Exogenous estimation.
where g is the gross profit margin; ρ is the discount rate, taken to be 12%, which is in line with the work of Gupta, Lehmann, and Stuart (2004); r is the retention rate; and a = 1 – r. Following Gupta, Lehmann, and Stuart, we deducted the relevant corporate tax rate (38% for U.S. firms and 30% for Mobistar and SK Telecom) from the equity and used the after-tax value as a proxy for the firm's value.
To study the effects of attrition on customer equity, we compared our calculations with a competitive model that does not consider attrition. Thus, we reestimated the parameters using Equation 4, taking a = c = δ = 0, and calculated the equity. This “no-attrition” model is close in spirit to the models of Kalish, Mahajan, and Muller (1995) and Krishnan, Bass, and Kumar (2000), with brand-level word of mouth instead of category-level word of mouth. Table 4 presents the calculated customer equity for the seven focal firms based on Equation 5, with the penetration function from Equation 4, and compares those values with calculations using the model that does not consider attrition for the last quarter of available data that we had for each firm.
MARKET POTENTIAL AND CUSTOMER EQUITY

The results imply that the valuation of customer equity according to the competitive services growth model is considerably higher for all firms than valuations from a model without attrition, especially for the higher attrition rates. When the attrition rate is not zero, ni(t) = dNi/dt + aNi(t), while a zero attrition model uses ni(t) = dNi/dt. That is, we consider the contributions of all the customers who joined the service during the period. When considering only ni(t) = dNi/dt (i.e., the net difference in number of subscribers between periods), the contributions of existing customers are ignored.
Note that adjusting the data and adding the customers who left could at least partially compensate for use of a no-attrition model. For a monopoly, the adjusted data set is the number of people who ever adopted the service. However, this adjustment provides only a partial compensation because it does not include the accumulated word-of-mouth contribution of these customers (who left the service). In a competitive scenario, such adjustment is problematic because it is necessary both to add the customers who left and to subtract the customers who arrived from competitors. Such subtraction requires prior knowledge of the amount of churn and disadoption, and in addition, interpretation of the adjusted data is no longer clear.
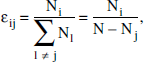
Figure 2 presents a comparison of our valuation, the valuation of a model without attrition, and the average stock market value of the firms. We performed the comparison for the latest three quarters of our data. Because Mobistar provides full operational reports only once a year, we compared Mobistar for the fourth quarters of 2002, 2003, and 2004. As we mentioned previously, in the third quarter of 2003, Barnesandnoble.com was purchased by Barnes & Noble. We performed the equity calculation for Barnesandnoble.com for the time of the acquisition.
MARKET VALUE AND CUSTOMER-BASED VALUATION
Figure 2 has several implications. In all categories, the competitive services growth model provides estimations that are considerably closer to the stock market values than those from the model that does not consider attrition. For six of the seven firms, the customer equity estimations are remarkably close to the stock market values. If we take the latest valuation for Barnesandnoble.com, E*Trade, Mobistar, SK Telecom, XM Satellite Radio, and Sirius Satellite Radio, we find that the average deviation of our calculated values from that of the stock market is 17.7%. The one exception is Amazon.com, which is traded at higher values than those generated by our model; we discuss this further in the next section.
This approach has two primary limitations. First, the stock market value may be influenced by factors other than future customer-related cash streams, such as various assets or debts the firm owns or owes. Indeed, when customer-related profits do not play a major part in expected future earnings, careful adaptation should be made before comparing the two values. Second, the stock market may make assumptions regarding future growth (e.g., about firms entering new markets) that are not embedded in our model.
Discussion
At the beginning of this article, we compared the growth of competitive services to a leaking bucket. There is an inward flow of new adopters and customers who switch from competitors. There is also an outward stream of customers who either disadopt the category or defect to the competition. This complex environment makes analysis of the growth of new services nontrivial; yet the ubiquity and the importance of new services make such an analysis essential for managers who want to understand the environment in which their services compete.
We presented a competitive service growth model that provides a platform for this analysis. Our approach is relatively straightforward, and with a few simplifying assumptions, the basic model has a closed-form solution. To demonstrate potential applications, we focused first on the category level and examined the role of category-level attrition in the evolution of markets for new services. We demonstrated how using a durable goods approach to study the growth of a service can considerably bias estimation of the parameters of growth.
We then moved to the brand level and used our approach to develop a method of functionally estimating the customer equity of firms. The approach presented here is the first customer equity measure that takes into account interfirm dynamics in a growing market and is especially critical to the calculation of customer equity when firms are strongly affected by both customer switching to competitors and disadoption of the category.
As firms aim to better understand the economic value they give to their shareholders, there is increasing interest in the marketing-finance interface in general (e.g., Hogan et al. 2002; Kumar and Petersen 2005). This is the motivation for recent efforts to contrast a service firm's customer equity and stock market value (Gupta, Lehmann, and Stuart 2004). A match between the two is not always straightforward, especially when a firm's long-term customer value is just one source of value for shareholders. For a service firm that derives value mostly from customers, the comparison is relevant and can help researchers better understand the role of customer equity in the perceptual value of firms.
We used our approach with seven firms in four service categories. As Figure 2 demonstrates, we found that with the exception of Amazon.com, our model's estimates of customer equity were remarkably close to the stock market values for the six firms, with an average difference of approximately 18%. Notably, while our approach generated values that were close to the stock market values, a competitive model that ignored attrition yielded much lower valuations. With the necessary caution stemming from our small sample, the results suggest that attrition plays a critical part in how the stock market values service firms. This may turn out to be an important aid to those advocating proper management of customer assets as a way to increase shareholder value and, in a more general sense, as evidence of the role of marketing for service firms.
The one exception to our relatively reasonable valuations was Amazon.com, an example that likely stems from the limitation of our long-term approach. The value of Amazon.com's stock has been the subject of much industry-related discussion since the late 1990s, with some experts repeatedly claiming that it is overvalued (Damodaran 2001; Hough 2003). The main issue is likely related to assumptions about Amazon.com's future growth. Because Amazon.com is no longer an online bookseller but rather a general online retailer and because much of its growth may stem from nonbook categories (some that are not retailing, such as Web-based advertising), it may be that relying on recent margins and growth patterns in this case is not realistic.
Our aim is not to be part of the specific debate regarding Amazon.com but to point out that customer equity approaches of the type we presented here are a potentially appropriate framework for the analysis, even as a sensitivity analysis tool. For example, some analysts wonder what margin or growth rate would justify Amazon.com's high share price (Hough 2003). Because these are parameters in our model, analysts can use such a customer equity approach to make more informed decisions and justify their positions. It may be that Amazon.com's unique market reality does not fit well with the simple assumptions of the model we present here. Researchers aiming to examine this case further may need to develop extensions to our model that better account for the case of a rapidly changing target market. However, this is beyond the scope of this article.
Limitations and Extentions
The services growth model relies on several assumptions related mainly to the nature of attrition. The assumptions were made to provide an analytical formulation and enable empirical estimations. However, extended models can be developed that relax some of these assumptions.
One such assumption regards the equal diffusion parameters for the readoption of disadopting customers compared with the acquisition of new ones. There is little evidence to date to infer the difference between the two groups precisely because there is little empirical research on customer reacquisition in general (for an exception, see Thomas, Blattberg, and Fox 2004). Theoretically, disadopters may need less information to readopt because they have already used the product and are aware of its performance. However, consumers who disadopted may be reticent to readopt without solid evidence that the second time around will be a satisfactory experience.
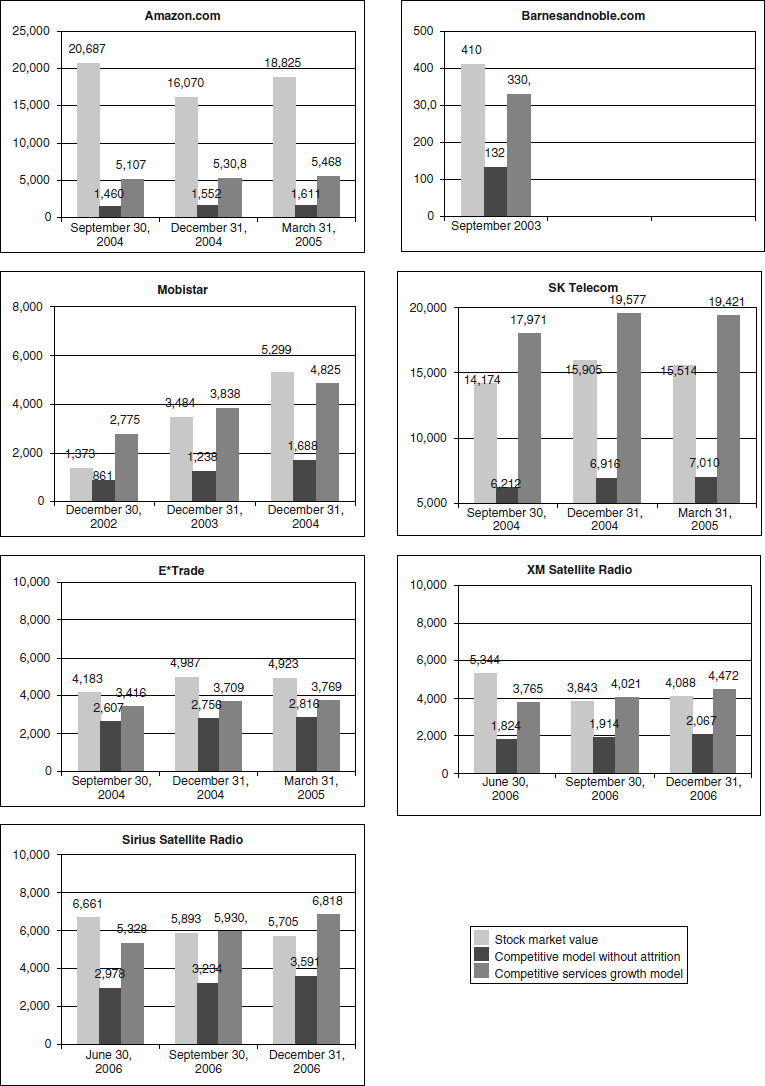
Relaxing this assumption can theoretically be done by splitting the pool of potential users into first-time adopters and disadopters who might eventually readopt (see Figure 3). However, such a model can be difficult to estimate without much richer data on customer word-of-mouth behavior. Meanwhile, the values of the external and internal influence parameters in our model represent the average communication impact of both new adopters and readopters and should be interpreted accordingly.

AN EXTENDED COMPETITIVE SERVICES GROWTH MODEL
What is the minimal model that is necessary to abstract from the assumption of equal influence on disadopting customers and new adopters? In this minimally extended model (see Figure 3), the pool of nonadopters is broken down into two subpools—first-time adopters and disadopters (those who adopted at least once). The equations describing this model appear in the Appendix.
This model is difficult to apply in practice because of its large number of parameters. For three firm markets, such as the cellular industries in our sample, this model requires six more parameters in addition to the eight parameters we already included in Equation 4. This can create an estimation problem, especially with a small number of data points. To test the reliability of this model, we performed simulations in the same procedure as described for the category-level and brand-level models (i.e., generating data with the model and then trying to recover the model parameters using nonlinear regression). We generated clean data and noisy data in various noise levels. The results indicate that though the model correctly estimates the true parameters for the clean data, performance deteriorates considerably when noise is added. For example, in a noise level of 4% (relative to each data point value), fewer than three quarters of the parameters were estimated correctly (see Web Appendix B at http://www.marketingpower.com/jmrapril09). In addition, the average R-square value was 40%, compared with 78% for the simulations of Equation 4. However, this model can still be applicable for sets with large number of data points.
Since the 1990s, the marketing literature has emphasized a study of customer attrition and its implications for marketing strategies. Incorporation of customer attrition into mainstream marketing models is part of the shift in the marketing discipline from the study of marketplace exchanges as transactions to that of relationships that should be managed and examined in the long run (Agustin and Singh 2005; Morgan and Hunt 1994). To accomplish that shift, marketers must adapt the tools they use, and we hope that this study can serve as a step at that direction.
Footnotes
Appendix: The Extended Model
In the article, we assumed equal probability of return of disadopting customers compared with the acquisition probability of new ones. This assumption means that though customers differ in their p and q, we consider the average values of their probabilities. This assumption is relaxed by splitting the pool of potential users into first-time adopters and disadopters who might eventually read-opt (see Figure 3).
Under these assumptions, the diffusion process can be described using the following set of differential equations:
We checked the reliability of the model using the procedure described in Web Appendix B (available at http://www.marketingpower.com/jmrapril09): We randomly sampled 30 combinations of a full factorial set of parameter values in typical ranges for the three-firms case, generated data with these parameters using the preceding equations, and then performed ten sets of 300 simulations each, one with clean data, four with absolute noise (noise levels of 1%, 2%, 4%, and 6%), and five in various levels of relative noise (noise levels of 1%, 2%, 4%, 6%, and 10%). We performed the estimations using SAS (proc model, seemingly unrelated regression option). The rest of the procedure precisely followed that in Web Appendix B.
Table A1 displays the number of estimations that were significantly different from the original parameters at the 5% level. The table implies that with clean data, the parameters are fully recovered by the model. However, when noise is added, the number of cases of wrong estimations increases substantially even in the low noise levels. In the noisy case, the estimation of many parameters received the boundary values (0 or 1), and standard errors were large. The average adjusted R-square (averaged over all the simulations) is 40%.
References
Supplementary Material
Please find the following supplemental material available below.
For Open Access articles published under a Creative Commons License, all supplemental material carries the same license as the article it is associated with.
For non-Open Access articles published, all supplemental material carries a non-exclusive license, and permission requests for re-use of supplemental material or any part of supplemental material shall be sent directly to the copyright owner as specified in the copyright notice associated with the article.