
Abstract
This article examines the global spillover of foreign product introductions and takeoffs on a focal country's time to takeoff, using a novel data set of penetration data for eight high-tech products across 55 countries. It shows how foreign clout, the susceptibility to foreign influences, and intercountry distances affect global spillover patterns. The authors find that foreign takeoffs, but not foreign introductions, accelerate a focal country's time to takeoff. The larger the country, the higher its economic wealth, and the more it exports, the more clout it has in the global spillover process. In contrast, the poorer the country, the more tourists it receives, and the higher its population density, the more susceptible it is to global spillover effects. Cross-country spillover effects are stronger the closer the countries are to one another, both geographically and economically, but not necessarily in terms of culture. The model the authors develop also quantifies the spillover between each country pair, allowing it to be asymmetric.
In the past decade, marketing researchers have shown a strong interest in modeling the takeoff of new products, which refers to the first dramatic increase in sales after an initial period of low sales. After the first efforts to model the takeoff of new consumer durables in the United States (Agarwal and Bayus 2002; Golder and Tellis 1997), scholars have recently turned to the study of cross-national differences in time to takeoff. Tellis, Stremersch, and Yin (2003) show that large variance exists in the time to takeoff among Western European countries, which is explained by differences in national culture rather than economic differences. Chandrasekaran and Tellis (2008) extend this study to a sample of 31 countries and also show large cross-country differences in time to takeoff. Tellis, Stremersch, and Yin capture cross-country spillover by merely controlling for the number of prior takeoffs in other countries, while Chandrasekaran and Tellis do not control for foreign takeoffs. The current research extends these prior studies by explicitly modeling the cross-country spillover effects of new product introduction and takeoff in foreign countries on the product's time to takeoff in a focal country.
Our model explicitly incorporates the distance (economic, cultural, and geographic) between countries—hereinafter referred to as the “intercountry distance”—as moderating the influence of foreign introductions and foreign takeoffs. In addition, it allows countries to show different levels of susceptibility to foreign introductions and takeoffs and differential foreign clout in the international spillover process. The concepts of foreign susceptibility and foreign clout allow cross-country influences to be asymmetric in our model. For example, the influence of Country A on Country B can be stronger than vice versa because of a stronger clout of A than B or a higher susceptibility of B than A. In contrast, Tellis, Stremersch, and Yin's (2003) model implicitly assumes that all countries are equally distant, all countries have the same susceptibility, and all countries have equal clout. Our new model outperforms their model on fit (both in-sample and out-of-sample) and conceptual insight.
Our study also adds to the international diffusion literature. In this literature, several authors have modeled cross-country spillover, which they typically relate to intercountry distances (e.g., Albuquerque, Bronnenberg, and Corbett 2007; Dekimpe, Parker, and Sarvary 1998, 2000b; Ganesh and Kumar 1996; Ganesh, Kumar, and Subramaniam 1997; Kumar and Krishnan 2002; Libai, Muller, and Peres 2005; Putsis et al. 1997; Takada and Jain 1991; Van Everdingen, Aghina, and Fok 2005). Concepts such as foreign susceptibility and foreign clout in international spillover are relatively novel in that literature. A recent study by Albuquerque, Bronnenberg, and Corbett (2007) is the only diffusion study to examine the susceptibility and influence of countries in cross-country diffusion, but the authors do not relate these concepts to country characteristics. Moreover, they investigate adoption at the firm level, while we focus on consumer innovations. Overall, our exploration of these concepts for international takeoff may also stimulate new work on spillover in international diffusion.
We estimate the parameters of our model on a novel data set composed for this study. It contains penetration data on eight recently introduced, high-tech durables (CD players, video cameras, personal computers [PCs], mobile phones, Internet, ISDN [integrated services digital network], digital cameras, and DVD players) in 55 countries around the world. Our data set is richer than any other data set so far in the international diffusion and takeoff literature streams and includes many developing countries (Dekimpe, Parker, and Sarvary 2000c). In addition, this global data set enables us to describe global takeoff patterns more extensively than anyone before us (16 countries in Tellis, Stremersch, and Yin [2003], 31 countries in Chandrasekaran and Tellis [2007], and 55 countries in this study).
In the following section, we explain the concept of takeoff in more detail. Next, we discuss the theoretical concepts underpinning our model. Then, we develop our econometric model, after which we turn to the data used to estimate the model parameters. Subsequently, we present the results and end by discussing the implications and limitations of this study.
Takeoff
Takeoff is defined as the transition from the introductory stage to the growth stage of the product life cycle, which is characterized by the first large increase in sales (Agarwal and Bayus 2002; Golder and Tellis 1997). According to Golder and Tellis (1997), the main reason new product takeoff occurs lies in the concept of “affordability.” New product sales are initially low because of relatively high prices, but as soon as prices decline, the new product becomes affordable for a larger population, and takeoff occurs. According to Agarwal and Bayus (2002), the main reason new product takeoff occurs lies in the concept of “industry ecology.” New product sales are initially low because of a limited number of suppliers, but as soon as a large number of firms enter, the product and its distribution improve, and consumer awareness of and confidence in the new product increase, leading to a sharp increase in the demand for the new product.
Takeoff is a critical event in the life of a new product because the jump in sales has important implications for the resources required for manufacturing, marketing, and inventory management. Moreover, takeoff is a signal of mass adoption, and knowing when takeoff is most likely to occur helps managers decide whether to pull the plug on a product (Tellis, Stremersch, and Yin 2003). Alternatively, diffusion studies model the overall new product sales growth pattern, while not explicitly considering takeoff. Moreover, the data used in these studies frequently start from the point of takeoff rather than introduction (Golder and Tellis 1997).
This study examines country characteristics as drivers of time to takeoff (i.e., the time between the commercialization and the moment of takeoff of the new product)—in contrast to Golder and Tellis (1997) and Agarwal and Bayus (2002), who focus on the effect of company decisions on market-level takeoff—and the spillover effects that occur across countries. To obtain a comprehensive set of country characteristics, we build on both the international takeoff and the international diffusion literature streams (e.g., Chandrasekaran and Tellis 2007; Dekimpe, Parker, and Sarvary 2000c; Putsis et al. 1997; Stremersch and Tellis 2004; Steenkamp, Ter Hofstede, and Wedel 1999; Talukdar, Sudhir, and Ainslie 2002; Tellis, Stremersch, and Yin 2003; Van den Bulte and Stremersch 2004). From this literature, we can expect that four main country dimensions affect time to takeoff and international spillover effects. First, a country's economy (see Tellis, Stremersch, and Yin 2003) is directly related to the affordability of a new product and time to takeoff (e.g., gross domestic product [GDP]), and economic streams across countries (e.g., international trade or traffic of people) is related to spillover effects across countries. Second, a country's culture (see Van den Bulte and Stremersch 2004) is related to the degree to which citizens will be, on the one hand, innovative and, on the other hand, socially connected. The former may influence time to takeoff, while the latter may influence spillover patterns. Third, a country's demography (see Dekimpe, Parker, and Sarvary 2000c) may affect the ease with which countries can be penetrated by new products and their influence in the international realm. Fourth, a country's geographic location will affect spillover patterns, with isolated countries being less important in spillover patterns than closely connected countries.
Global Spillover in Takeoff: Conceptual Framework
To conceptualize global spillover patterns in new product takeoff, we first examine the underlying concepts of clout, susceptibility, and intercountry distance in such spillovers. We then formulate our expectations regarding the effects of country covariates on each of these concepts, along the higher-level dimensions we identified previously—namely, economy, culture, demography, and geography.
Clout, Susceptibility, and Intercountry Distance in Global Spillover
Figure 1 graphically summarizes our conceptual framework and shows two main events that may lead to spillover effects on the time to takeoff of product k in country i—namely, the prior introduction and takeoff of product k in country j (i ≠ j). 1 Foreign introductions and takeoffs may positively affect new product takeoff probability in a focal country for several reasons. First, foreign introductions are indicative of a supplier's high expectations of the new product and of the support of foreign distribution channels. Both signal the expectation of commercial success to the marketplace, which in turn enables support of retail channels and consumer acceptance in the focal country. Both distribution channels and consumers in the focal country may be even more easily convinced if takeoff in other countries has already occurred (Tellis, Stremersch, and Yin 2003). Under these circumstances, distribution channels may decide to promote the product more heavily. Second, foreign availability of the product following the launch will generate cross-country word of mouth among consumers (Kalish, Mahajan, and Muller 1995). Moreover, cross-country word-of-mouth spillover may intensify after the takeoff in the foreign country, as the product begins to appeal to the mass market and uncertainty about the ultimate success of the new product gradually fades (Agarwal and Bayus 2002; Stremersch et al. 2007).

The Role of Clout, Susceptibility, and Distance in Global Spillovers of Takeoff
Although time to takeoff is the fundamental dependent variable in our study, in the discussion of the theory and in the econometric modeling, for ease we discuss the occurrence of the takeoff event. More formally, we discuss the probability that takeoff takes place at a particular point in time given that takeoff did not occur yet. For readability, we abbreviate this probability as “the probability of takeoff.” Note that a variable that has a positive effect on this probability will shorten the time to takeoff and therefore will have a negative effect on the time to takeoff.
The contribution of this article lies in the idea that the extent to which such spillover effects materialize depends on the specific pair of countries studied. As Figure 1 shows, we model the influence of foreign susceptibility of country i, foreign clout of country j, and the distance between country i and country j on such cross-country spillover effects of introduction and takeoff, all operationalized through country characteristics.
The concepts of susceptibility and clout are similar to a brand's vulnerability to lose market share to competing brands and a brand's ability to take share away from competitors (Kamakura and Russel 1989). In a similar vein, we argue that some countries will be more receptive to influences from foreign countries (i.e., foreign susceptibility), while other countries will be more capable of influencing foreign countries (i.e., foreign clout). We expect that the higher country i's foreign susceptibility, the stronger is the spillover effect of foreign introductions and takeoffs on new products' time to takeoff in country i. Furthermore, the higher country j's foreign clout, the stronger is the spillover effect of introductions and takeoffs of new products in country j on the time to takeoff of those products in other countries. Variation across countries in susceptibility and clout generates asymmetries in the influence of the countries on one another.
We also consider the distance between countries. Studies on cross-country learning have shown that the closer countries are, the stronger is the learning effect from the lead to the lag country, which in turn positively affects adoption timing (Ganesh, Kumar, and Subramaniam 1997; Kumar and Krishnan 2002). Along similar lines, we expect strong cross-country spillover effects to occur between countries that are close to each other in economic, cultural, or geographic terms, and we expect distant countries to have little effect on each other. As Figure 1 shows, we expect country characteristics to affect time to takeoff, intercountry distance, foreign susceptibility, and foreign clout.
Country Characteristics: Economy, Culture, Demography, and Geography
Economy
The economic wealth of a country may have a strong positive effect on the probability for takeoff to occur because takeoff is driven to a large extent by affordability concerns (Golder and Tellis 1997, 2004). In addition to wealth, we take into account the distribution of wealth. If income inequality is high, only a few people in a country may be able to afford a new product, while the vast majority will lack such ability (Chandarasekaran and Tellis 2008; Tellis, Stremersch, and Yin 2003). In line with these arguments, we expect income inequality to be negatively related to the takeoff probability.
Moreover, a poor country is likely to be more susceptible to foreign events, such as introduction and takeoff. Citizens of poor countries have a stricter budget constraint than citizens of wealthy countries, which will make them more hesitant to adopt new products early on without strong signals of ultimate success in other countries (Dekimpe, Parker, and Sarvary 2000a). In contrast, a rich country is more likely to influence other countries than relatively poor countries because the reputation and sophistication of users of an innovation in wealthy countries can signal the quality of an innovation to foreign consumers (Beise 2004).
The economic openness of a country is another important variable in explaining the penetration potential of a new product (Talukdar, Sudhir, and Ainslie 2002). An economy can be open in terms of its international trade (e.g., imports or exports of goods and services) or in terms of its international traffic of people (e.g., tourism). Citizens in open economies will be more able to share information with foreigners because they have developed more relationship heuristics (Wuyts et al. 2004), such as understanding the way to conduct business with a country (Beise 2004) or a higher ability in foreign languages, than more closed economies. Therefore, foreign clout will be especially high for export-oriented countries or countries in which citizens show higher tourism expenditures abroad, while countries showing higher import figures or countries that receive many tourists will be more susceptible to the influence of foreign countries.
We also expect economically distant countries to show weaker spillover effects than economically close countries. This expectation is grounded in theories that connect economic similarity, mainly in terms of GDP, to cross-country learning (Dekimpe, Parker, and Sarvary 2000b; Ganesh, Kumar, and Subramanian 1997; Kumar and Krishnan 2002). Similar economic conditions between countries may be associated with similarities in consumer demand and in the communications infrastructure (Mitra and Golder 2002). Consequently, it is more likely that consumers from economically similar countries communicate with each other about new products than consumers from economically dissimilar countries.
Culture
A popular framework to study national culture is the four-dimensional framework posited by Hofstede (2001). The four “classic” dimensions he originally posited (subsequently, he added a fifth, long-term orientation) are uncertainty avoidance, individualism, masculinity, and power distance. In this article, we focus solely on the dimension of uncertainty avoidance, which indicates the extent to which a society tolerates uncertainty and ambiguity and, moreover, the extent to which a culture programs its members to feel either uncomfortable or comfortable in unstructured situations. The reasons for this choice are that (1) uncertainty avoidance is found to be the most relevant to innovative behavior (Steenkamp, Ter Hofstede, and Wedel 1999; Tellis, Stremersch, and Yin 2003); (2) inclusion of all cultural dimensions generates harmful collinearity and inefficiency in the estimation because of over-parametrization with likely insignificant effects; and (3) in our empirical tests, we find that uncertainty avoidance is the only cultural dimension among the four with significant explanatory power.
A country's high uncertainty avoidance hinders consumer innovativeness (Steenkamp, Ter Hofstede, and Wedel 1999), which negatively affects a new product's takeoff probability (Tellis, Stremersch, and Yin 2003). Uncertainty avoidance may also affect foreign susceptibility. Citizens of countries low in uncertainty avoidance show less alienation from what happens in the world, have greater tolerance of foreigners' opinions, accept people from other races as neighbors more easily, tolerate immigrants better, and show a more open-minded mentality in search for information than citizens of countries high in uncertainty avoidance (Hofstede 2001). Therefore, the former type of countries will show greater foreign susceptibility than the latter type. The relationship between uncertainty avoidance and foreign clout is less clear, though we could argue that if the new product has taken off in countries high in uncertainty avoidance, this is a stronger quality signal, given that they are more conservative than countries low in uncertainty avoidance.
The degree to which citizens in two countries have similar or different attitudes toward uncertainty affects the degree to which spillovers exist between the two countries. The reason is that people communicate more easily when they share a common cultural background (Ganesh, Kumar, and Subramanian 1997; Kumar and Krishnan 2002; Rogers 1995; Takada and Jain 1991).
Demography
Both population size and population density may affect the takeoff probability of a new product positively because they both enhance the speed at which an innovation diffuses through a population (Dekimpe, Parker, and Sarvary 2000c). Both population size and population density may also be important demographic influences on foreign susceptibility and clout. Small countries are typically less self-centered than large countries (Alesina and Wacziarg 1998; Spolaore 2004), which may make them more susceptible to foreign influence. In contrast, large countries are likely to have a more diverse population than small countries (Alesina and Spolaore 1997), which may generate more diverse foreign contacts. Putsis and colleagues (1997) indeed show that large European Union (EU) countries have relatively more external contacts than small EU countries. Therefore, we expect large countries to have more foreign clout.
Countries with a dense population may be more susceptible to foreign influences than countries with a low population density because foreign information can more easily penetrate the social system (Lemmens, Croux, and Dekimpe 2007; Mitra and Golder 2002). People in dense countries are close to one another physically, which may enhance the likelihood of communicating with one other, and consequently there may be more ways for citizens to learn about new products' adoption in foreign countries. High density may also increase word of mouth with foreign countries and thus increase clout.
Geography
We consider geography only in relation to the distance between countries. We expect that the more geographically distant countries are, the weaker is the international spillover between them. This expectation is grounded in prior work, for example, by Mahajan and Peterson (1979), who refer to it as “the neighborhood effect,” and by Garber and colleagues (2004), who find spatial clusters in adoption phenomena.
Other Variables
We also control for other factors that prior literature has found to be of importance. First, we control for time because it is well known that there is duration dependence in the time to takeoff (Golder and Tellis 1997). We include both the time since introduction and the time of introduction (i.e., the launch year). Note that the first variable is time variant, while the second is time invariant. Second, we control for the product category.
Modeling Global Spillover in New Product Takeoff
The econometric model we develop to capture global spillover in new product takeoff builds on the conceptual framework in Figure 1. We denote the number of countries by I and the number of products by K. Time of introduction of product k in country i is given by
More formally, we model the conditional probability
Let

where I[A] is an indicator function that equals 1 if Condition A is true and 0 if otherwise. Similarly, we denote by Dikt a dummy variable:

This dummy indicates whether the product k took off in country i at or before time t. We now specify the conditional probability of takeoff of product k in country i, conditional on the introduction of this product, as follows:

We specify Vikt as follows:

where μk denotes a product-specific intercept, Zi denotes a vector of country characteristics, and β is the associated effect of these characteristics. The term

The influence of foreign introductions and foreign takeoffs is captured by the terms α1 (l = 0, 1) and yy. The first term specifies the main effect of an introduction (l = 0) and takeoff (l = 1) in one country on another. Both parameters (α0 and α1) are expected to be positive (i.e., increase the takeoff probability) because an introduction or takeoff in another country is a positive signal. The second term measures the influence of country j on country i. We decompose Φij as follows:

where πij measures the distance between i and j, ρj captures the clout of j (ρj > 0), and θi equals the foreign susceptibility of country i (θi > 0).2 We opt for a multiplicative specification in Equation 6 because susceptibility, clout, and distance interact with one another. If the susceptibility of a country i is low, we expect Φij to be small for all j, even for a nearby country j with high clout. An additive specification would not capture such effects.
Here, θi, ρj, and πij are all related to the influence of introduction and takeoff. This choice has a benefit (i.e., saving on the number of parameters) but also a drawback (i.e., foreign susceptibility, clout, and intercountry distance are assumed to be the same for introduction and takeoff). Here, we opt for model parsimony. If rich data, with much variance, are available, it may be possible to relieve this constraint, but we were not able to do so in our database. Note that through α0 and α1, we allow the net effect of foreign introduction and foreign takeoff to be different.
Foreign susceptibility of a country is related to economics, national culture, and demographics, which we capture in a vector of country-specific variables Wi. To ensure that θi is positive, we specify θi as follows:

where the parameter vector δ measures the importance of economic, cultural, and demographic characteristics to the country's foreign susceptibility.
For clout, we consider a similar specification:

Note that to be able to identify α0, α1, δ, and κ, we cannot include a constant in Wi or Ui.
We relate the weights πij to economic, cultural, and geographic distance measures, denoted by Xij, as follows:
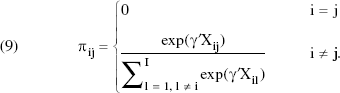
We expect that γ < 0; that is, a larger distance results in a smaller weight. Some variables may be reverse scaled—for example, a dummy variable that indicates whether two countries are neighbors. For such variables, we expect that γ > 0. Note that if γ = 0, all πij (i ≠ j) will be equal to 1/(I – 1).
Note that through the normalization in Equation 9, we restrict that πi1 ++ πi2 + … + πiJ = 1. Thus, we ensure that the total spillover effect is measured by α0 and α1 and that πij will not be equal to πji. The latter is not a limitation of our model but a logical consequence of the normalization of the weights. The relative weight πi indicates how the total foreign influence on country i is distributed across all countries. This weight is not necessarily symmetric. To explain this point further, we consider the following hypothetical situation: Suppose that there is a continent of four countries and one island far off the coast of the continent. Furthermore, suppose that only the geographic distance is important. The weight of the island for any of the four countries on the continent is likely to be small. However, for the island country, the other countries are all far away, and the weight of each country will be substantial. This example shows that the normalization is essential to be able to isolate the effect of the presence of many close-by countries from the susceptibility of a country. 3
In the data we use in the subsequent empirical section, we do not observe all country/product pairs. For each product, we observe a different set of countries. However, we must define πij for all country pairs regardless of the focal product. Therefore, the sum in Equation 9 is always over the complete set of all countries.
In principle, the same variables may enter W (susceptibility), U (clout), X (distance), and Z (direct country effect). For example, the log of GDP will enter all four concepts. Such specification will not cause multicollinearity or identification problems, because they all affect the takeoff probability differently. Regarding identification, consider the influence of Country A on Country B, and for the sake of exposition, suppose that we use logGDP as the only country characteristic. The GDP of Country A may affect the clout of A, while the GDP of B may affect the susceptibility of B. The absolute difference between the GDPs—economic distance—may affect the weight of the influence between A and B. Therefore, the influence of A on B is related to logGDPA (clout), logGDPB (susceptibility), and |logGDPA – logGDPB| (distance). Our distance measure |logGDPA – logGDPB| is an absolute value, and therefore not linearly dependent on logGDPA (clout) and logGDPB (susceptibility), thus providing identification. Our approach can be compared with a hierarchical model in which the same variable is used to capture differences in several parameters. Examples of such models are widespread in the marketing literature (e.g., Fok et al. 2006; Montgomery 1997).
The typical problem of multicollinearity among the country characteristics themselves may still remain. In the empirical section, we use the statistic by Belsley, Kuh, and Welsch (1980), also known as the condition index method, to test for this and find that our estimation is not plagued by harmful multicollinearity.
We estimate the model parameters using maximum likelihood. We denote yikt = 0 if takeoff has not occurred for product k in country i at time t and yikt = 1 if takeoff has occurred. Furthermore, let Lik = min (Tik, T); that is, Lik is the year of takeoff in case this is observed and the end of the data set in case takeoff is not observed. We can now write the likelihood as follows:

Note that possible right censoring is incorporated in this model specification. The log of the likelihood in Equation 10 can straightforwardly be maximized over the parameter space. To avoid ending up with a local optimum, we perform the maximization many times, each time with different random starting values. We used Ox 4.04 (Doornik 2002) to this end. Standard errors are easily obtainable using the Hessian of the log-likelihood.
Data
Data Collection Procedures
We gathered penetration data for eight products (CD players, PCs, video cameras, digital cameras, mobile phones, internet access, ISDN, and DVD players) across 55 countries worldwide. For Internet access and mobile phones, we use population penetration because multiple people in one household typically have access to the Internet and possess a mobile phone. For all other products, we use penetration data at the household level because they are typically considered household products, especially early in the life cycle.
Our database covers annual data from 1977 to 2004. Because the eight products are launched at different times during this period, the start of the data set differs across these products (CD players: 1982; PCs: 1981; video cameras: 1977; digital cameras: 1998; mobile phones: 1980; Internet access: 1990; ISDN: 1989; and DVD players: 1998).
We collected the penetration data from several sources, including Euromonitor, International Telecommunications Union, the World Bank, and the Organisation for Economic Co-operation and Development. We used Euromonitor as the main source for our data. However, for some product–country combinations (e.g., Internet in Finland), data for earlier years were available in one of the other mentioned sources. Because we needed data starting from the launch year, for cases in which earlier years were available, we decided to merge the Euromonitor data with the data from one of the other sources. We merged those data series only when the remainder of the time series was highly correlated or even identical.
To ensure that we have data from the year of introduction, we also collected data on launch years from external, secondary sources, such as books, company reports, and articles in newspapers and scientific journals. Consistent with Tellis, Stremersch, and Yin (2003), we included all product–country combinations for which (1) the precise launch year is known and we have data available from that launch year or (2) the precise launch year is unknown but the penetration in the first year of our data is less than .5%. We dropped all other series to avoid left-truncation bias. In total, the sample we use contains 308 product–country combinations.
Data on the independent variables were gathered from multiple, publicly available sources, such as the United Nations Statistical Yearbook, the CIA World Factbook, World Development Indicators, U.S. Census Bureau, Euromonitor online, Hofstede (2001), and various Web sites (e.g., for capital distances, we accessed http://www.wcrl.ars.usda.gov/cec/java/capitals.htm).
Measures
We first discuss the measures we employ for the dependent variable, after which we turn to our measures for the independent variables. Note that, in principle, complete time series could be used for the independent variables. However, complete time-series data are lacking for many developing countries. Therefore, for these variables, we use only the average over time so as not to introduce any bias stemming from a different treatment of developed and developing countries.
Dependent Variable
The dependent variable in our model is the occurrence of takeoff for a new product at a particular point in time. We identify takeoff using the same methodology as Tellis, Stremersch, and Yin (2003). This methodology specifies a threshold function that plots the growth rate of sales versus market penetration and identifies takeoff as the first year a product's growth in sales crosses this threshold. This threshold for takeoff varies by the base level of penetration. When the base level of penetration is small, a relatively large percentage increase in sales may occur without signaling takeoff; in case of a large base level of penetration, takeoff may occur at a relatively small percentage increase in sales.
Tellis, Stremersch, and Yin (2003) specify the threshold function used for takeoff identification heuristically. They iterate between identifying takeoff years on the basis of a threshold function and visual identification. The threshold rule they retain in the end is the one that provides the best fit with visual identification of takeoff times. Although its metric properties have not been inventoried, it performs well empirically. Because we have penetration data instead of sales data, we evaluate the growth in penetration (rather than the growth in sales), accounting for the base level of penetration. Because takeoff occurs early in the life cycle, when few replacements take place, this adaptation should not have major consequences. By definition, takeoff can occur only once in a product's life.
Figure 2 provides an example of the application of the threshold rule using data on the penetration of digital cameras in Italy. The upper part of the figure shows the cumulative penetration of digital cameras in Italy, and the lower part shows the threshold rule and the sales growth percentage. In this case, 2001 is the first year that the growth crosses the threshold and therefore is determined to be the year of takeoff. The threshold rule we use is simple, has predictive validity, and is interpersonally certifiable (Tellis, Stremersch, and Yin 2003). In the “Robustness” subsection, we consider other measures as a robustness check.

Example of Threshold Rule to Identify Takeoff
Independent Variables
Recall that in our model, the cross-country influence of introduction and takeoff is affected by (1) foreign susceptibility, (2) foreign clout, and (3) intercountry distances. For each, we use several indicators, which we explain next. We normalize all measures (M = 0, SD = 1) to allow for effect comparison.
We operationalize the economic indicators as follows: We measured economic wealth as the log of GDP per capita in U.S. dollars. We measured economic trade as the log of import divided by GDP as an indicator of susceptibility and the log of export divided by GDP as an indicator of clout. We used the Gini index at the household level and based on net income to capture income inequality (Tellis, Stremersch, and Yin 2003). We operationalized the effect of tourism on foreign susceptibility as the number of tourist arrivals divided by the number of inhabitants of the visited country (Gatignon, Eliashberg, and Robertson 1989; Helsen, Jedidi, and DeSarbo 1993). We operationalized the effect of tourism on foreign clout as the log of tourist expenditures (in U.S. dollars) in foreign countries. We took the measure for uncertainty avoidance from Hofstede (2001). The demographic variables are population density, operationalized as the number of people per square kilometer, and population size, operationalized as the log of the number of inhabitants.
We measured geographic distance as the log of the distance (in kilometers) between the capital cities of countries (Ganesh, Kumar, and Subramanian 1997) and with a dummy variable that indicated whether two countries are neighbors. We measured economic distance as the absolute value of the difference in the log of GDP per capita between countries (Mitra and Golder 2002). We used the absolute difference between the uncertainty avoidance index of countries as a measure for the cultural distance between countries. 4
Some authors also use a composite index for cultural distance, which combines multiple Hofstede (2001) dimensions. We include only uncertainty avoidance to remain consistent with the other components of the model and to make this effect easy to interpret.
We checked the independent variables for potential multicollinearity using Belsley, Kuh, and Welsch's (1980) statistic. This statistic equals 8.31, which is below the commonly used threshold value of 30. Thus, collinearity among regressors in our model does not threaten our conclusions.
Empirical Results
Descriptives of Time to Takeoff
In Tables 1, 2, and 3, we present summary statistics on time to takeoff for all products, countries, and regions in our sample. Each table presents the number of cases (Column 2), the number of right-censored cases for which we did not observe any takeoff yet (Column 3), the average time to takeoff based on the raw data for the cases in which takeoff has already occurred (Column 4), and the expected time to takeoff (Column 5). We calculated the latter using a discrete-time duration model with the same baseline hazard as specified in Equation 5 and product, country, or region fixed effects. Given the model parameters, the expected time to takeoff can easily be obtained from the implied takeoff probabilities. Note that this metric automatically accounts for right censoring. We observe that in the case of zero right-censored cases, the expected time to takeoff according to the simple model is close to the average time to takeoff in Column 4. In all other cases, we find a longer time to takeoff.
On average, the time to takeoff across all product–country combinations for which takeoff has already occurred is 4.46 years. However, large differences exist in the time to takeoff across product categories, countries, and regions. Columns 4 and 5 of Table 1 show that the average time to takeoff is shortest for DVD players and longest for video cameras.
Time to Takeoff Per Product Category
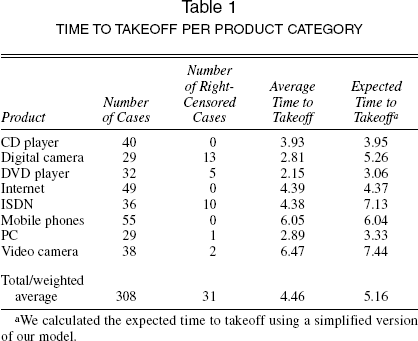
We calculated the expected time to takeoff using a simplified version of our model.
If we examine the cross-country variation in time to takeoff in Table 2, we observe large differences, with the time to takeoff varying from an average of 1.50 years for Switzerland to an average of 9.33 years for Indonesia (see Column 4). Other countries in which the products in our sample take off quickly are Switzerland, the Nordic countries, New Zealand, the United Kingdom, Hong Kong, and the United States. We come to similar conclusions if we account for right censoring (see Column 5 of Table 2).
Time to Takeoff Per Country Increasing in Average Time to Takeoff
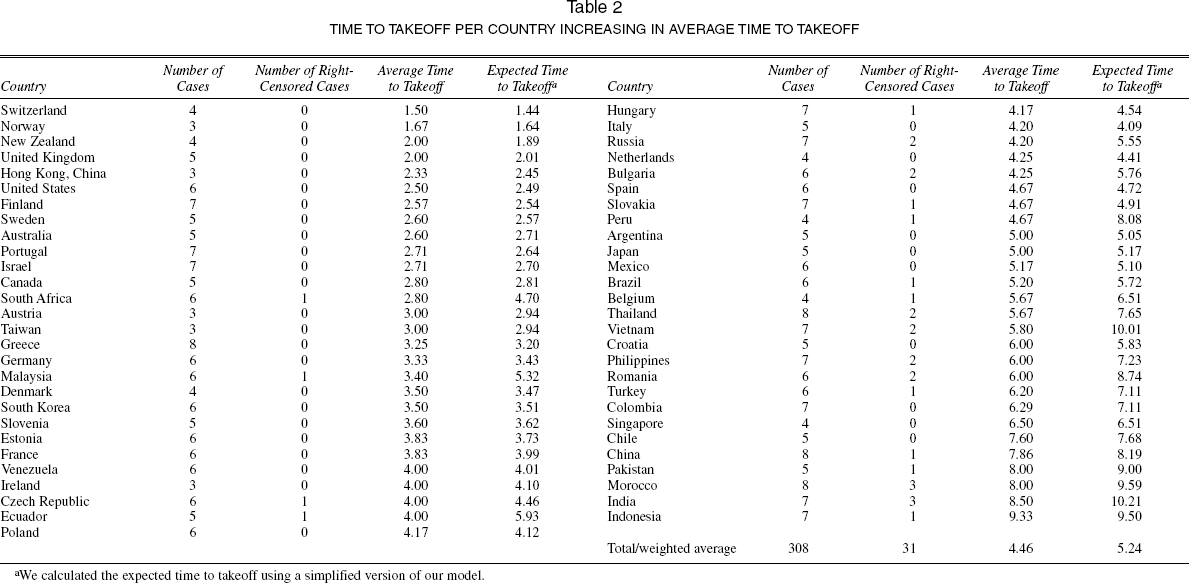
We calculated the expected time to takeoff using a simplified version of our model.
Table 3 presents the descriptive statistics across regions. The Western European and the North American countries show the shortest time to takeoff, while the countries in South America, Africa, the Middle East, and Australasia lag behind with respect to time to takeoff.
Time to Takeoff Per Region
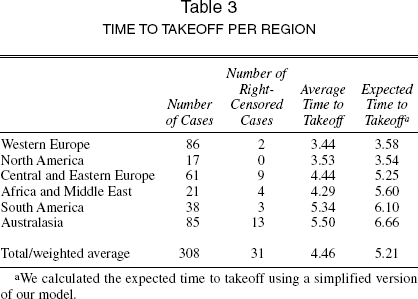
We calculated the expected time to takeoff using a simplified version of our model.
Model Fit
Next, we estimate the parameters of the model we specified previously. We evaluate the fit of our model by comparing our model with various restricted models on the basis of the log-likelihood and likelihood ratio tests. The simplest model we consider here contains only the baseline hazard (Model 0). Furthermore, we compare our model with a baseline hazard model that includes product fixed effects (Model 1); a baseline hazard model that includes both product fixed effects and country characteristics (Model 2a); a baseline hazard model that includes product fixed effects and introduction and takeoff effects (Model 2b); and a baseline hazard model that includes product fixed effects, introduction and takeoff effects, and country characteristics (Model 3). The latter model does not account for variation in spillover effects according to between-country distance, clout, and susceptibility as our model does (Model 5). Models 4a–4f extend Model 3 by including either one (Model 4a, 4b, and 4c) or two (Models 4d, 4e, and 4f) of these concepts. From these fit comparisons, we can conclude that our model with the combined effects of susceptibility, clout, and the weights is preferred over any other model we estimated.
Using the results of the log-likelihood and likelihood ratio tests, we can also calculate some absolute measures for the fit of our final model. Because we have a duration model, standard measures, such as the R-square, are not well defined. In the literature, the fit of the model is commonly judged relative to the fit of a basic model. The performance relative to such a simple model can be measured using the likelihood ratio index (1 – logLfinal/logLsimple) or a pseudo-R-square (Cox and Snell 1989; Magee 1990). If we take the model with only a baseline hazard (Model 0) as the basis for comparison, we obtain a likelihood ratio index of .22 and a pseudo-R-square of .64.
As a further model validity check, we also compare the fit of our model with a model similar to that developed by Tellis, Stremersch, and Yin (2003). In this model, we account for the number of prior takeoffs in foreign countries and include work/fun product dummies and the introduction year of the product. Furthermore, we include all country characteristics used in our model as explanatory variables. Because this model is not nested in our model, we compare both models on the basis of information criteria. The information criteria (Akaike information criterion, Hannan–Quinn, Bayesian information criterion, and consistent Akaike information criterion) all indicate that our model (logL = −556.69, 35 parameters) outperforms that of Tellis, Stremersch, and Yin (2003) (logL = −624.79, 16 parameters). This further substantiates our claim that clout, susceptibility, and country distance are important factors in global spillover.
Parameter Estimates
We present the parameter estimates in Table 4, which shows the influence of foreign introductions and takeoffs and the role of foreign susceptibility, foreign clout, intercountry distance, the direct effect of country characteristics, the effect of the launch year, the product fixed effects, and the effect of time. The significant effects appear in Figure 1, marked with an asterisk. The results show that the takeoff probability of a new product in a country increases as a result of foreign takeoffs
Parameter Estimates for the Full Global Spillover Model

p < .10 (two-sided).
p < .05 (two-sided).
p < .01 (two-sided).
We have experimented with a model without the foreign introduction events (α0 = 0) and a model without foreign takeoffs (α1 = 0). The results for the former model are the same as the results in Table 4. In the model without foreign takeoffs, we still do not find any effect of foreign introductions. Thus, our results are not affected by any multicollinearity between foreign takeoffs and foreign introductions.
Foreign susceptibility is affected by economics, both by wealth
The foreign clout of countries is determined by economic variables—that is, a country's economic wealth
The intercountry distance dimensions of geography
For the direct effects of country characteristics, we find that higher economic wealth
These findings are consistent with prior literature, except for the strong significance of the economic characteristics of countries (e.g., Tellis, Stremersch, and Yin [2003] find that economic differences across countries do not affect time to takeoff). The reason may be that our sample includes many developing countries, whereas previous studies have not, and consequently there is more variance in our data on economics than in data sets employed in prior research. Moreover, Burgess and Steenkamp (2006) argue that economic factors may be especially important in emerging markets because these countries are more resource constrained. Resource constraints may be a prime driver of international takeoff because takeoff itself hinges on affordability (Golder and Tellis 1997).
Table 4 also presents the effect of the launch year, the product fixed effects, and the effect of time. All else being equal, the (conditional) probability of takeoff first increases until approximately three years after introduction, after which it gradually decreases. This pattern is similar to that found by Tellis, Stremersch, and Yin (2003), who also find that the probability of takeoff peaks at three years.
Influence of other Dimensions of National Culture
As we explained previously, we included only one dimension of national culture in our model—uncertainty avoidance. To test whether the other dimensions of Hofstede's (2001) national culture framework affect our conclusions, we estimate our model using each variable separately. We take the model in Table 4 as the basis. Furthermore, we consider a model without any cultural variable (LL = −565.27, 31 parameters). This enables us to test for the significance of each variable. For efficiency reasons and because the cultural variables are highly correlated, we do not begin with a model that includes all cultural variables. When comparing the models by including only one of the cultural dimensions with the model without any cultural variable, we find that uncertainty avoidance is the only significant factor at the conventional p < .05 significance level (LL = −556.69, 35 parameters, p = .002). Individualism (LL = −562.61, 35 parameters, p = .256), masculinity (LL = −562.88, 35 parameters, p = .311), and power distance (LL = −561.26, 35 parameters, p = .091) do not add to the explanatory power of the model. Because power distance is marginally significant, we also estimate a model that includes both uncertainty avoidance and power distance, but this model does not explain more of the variation in the data than our model with only uncertainty avoidance (p = .300). The same applies to the other dimensions of national culture. Therefore, we determine that our specification with uncertainty avoidance as the only dimension of national culture is empirically valid.
Robustness
We checked the robustness of our results and the model's performance in three ways. First, we considered other early growth metrics, such as time to 3% penetration (approximately, the mean penetration level at takeoff, as shown by Golder and Tellis [1997]) and 10% penetration (as used by Van den Bulte and Stremersch [2006] as an early growth metric). Second, we estimated our model parameters after randomly deleting countries from the data set. Third, we removed the DVD category, estimated the parameters for both models, and then calculated the predictive likelihood of both models on the DVD category. In the latter comparison, we obtain a log-likelihood of −49.09 for our model and −52.99 for Tellis, Stremersch, and Yin's (2003) model.
Foreign Susceptibility and Foreign Clout
From the estimated parameters, we can calculate the foreign susceptibility and the foreign clout for every country. Table 5 includes the country (Column 1), its foreign susceptibility (Column 2), its rank on foreign susceptibility (Column 3), its foreign clout (Column 4), and its rank with respect to foreign clout (Column 5). Countries that are most susceptible to foreign influences are mainly Asian countries, such as Singapore, Vietnam, India, Pakistan, and China, while the Nordic countries and the United States show the lowest levels of foreign susceptibility. Three Western European countries are in the top five with respect to clout—Belgium, Germany, and the Netherlands. Hong Kong is ranked 2nd and Taiwan is ranked 4th, while the United States ranks only 13th. Belgium and the Netherlands have strong clout, which may appear surprising at first, but both countries have among the highest import and export ratios in the world and, in general, are influential because of their centrality, both politically (founding countries of EU) and economically (trade and logistic nodes and large harbors). In general, Table 5 shows that countries that ranked high on clout are ranked low on susceptibility, and vice versa (correlation = –.50, p < .001), indicating strong asymmetry in influences.
Estimated Foreign Susceptibility and Clout for all Countries
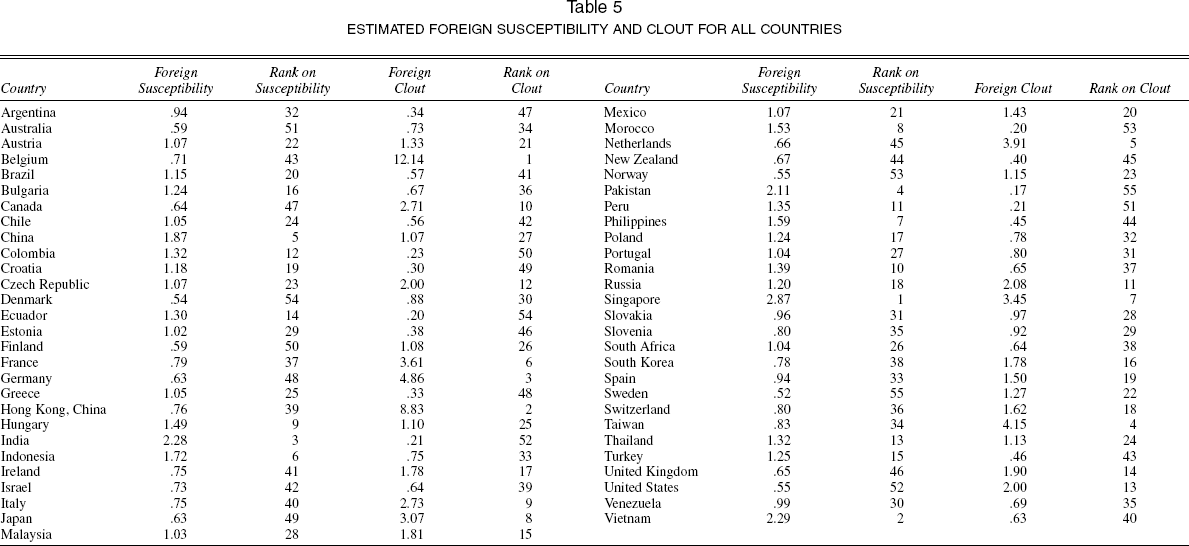
Although a clear pattern of clout and susceptibility emerges, it is necessary to be cautious in interpreting our results, given the uncertainty surrounding our estimates. First, the measure for clout is related to potential clout, not actual clout. Thus, whether a country can have an impact depends on when takeoff occurs in a country. For example, for Belgium, we find a high potential clout (ranked 1). However, the actual impact of Belgium is limited because the average time to takeoff for Belgium is only 5.67 years. Consequently, the takeoffs in Belgium show only cross-country spillover effects for countries in which the takeoff occurs late. Second, susceptibility and clout are defined locally; that is, a country with a large clout still influences only local countries because of the significant moderating effect of distance. This implies that cross-country spillover effects occur mainly between countries that are close to one another in both geographic and economic distance. Third, our estimation of clout and susceptibility is mostly affected by countries with “average” values on the predictors and not as much by countries with “extreme” values. Therefore, our estimation approach more accurately represents a country that has average values on predictors than countries with extreme values on predictors. For example, Belgium and the Netherlands may be such extreme countries because they have extremely high import and export numbers relative to their size.
Bivariate Cross-Country Influences Visualized
Our model enables us to visualize bivariate cross-country influences. Figure 3 shows graphic representations of the cross-country effects for three country pairs—the influence of the United States on Canada, the influence of the United States on the United Kingdom, and the influence of France on Belgium. The first bivariate pair is a typical neighbor pattern in North America, while the third one is such a pair in Europe. The second represents a cross-continent spillover—that is, the influence of a takeoff in the United States on the takeoff in the United Kingdom. Figure 3 includes only the cross-country effects of foreign takeoffs because the introduction effect is insignificant, and thus it shows how the conditional takeoff probability of a new product in the focal country would change given that takeoff occurs in a foreign country. On the horizontal axis of the graph, we provide the takeoff probability for a focal country, given that no foreign takeoff occurred. On the vertical axis, we provide the takeoff probability for that country, given that foreign takeoff occurred. The solid line indicates the baseline case of no cross-country spillover.
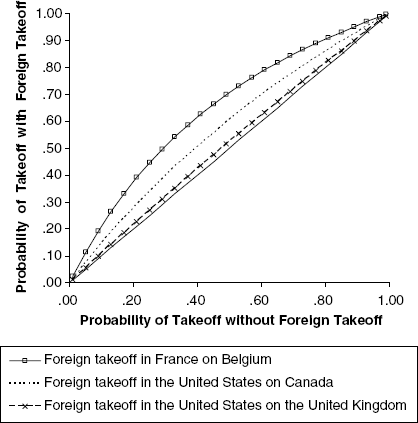
Visualization of the Effect of Foreign Takeoffs in Three Different Cases
Of the three examples in Figure 3, the effect size is largest for the European pair of countries. A takeoff in France triggers an increase of approximately 50% in the takeoff probability in Belgium, compared with when there was no such takeoff in France (evaluated at 45% probability of takeoff without a French takeoff). Belgium is a particularly noteworthy case because it shares borders with France, Germany, and the Netherlands and also shares languages at these borders (French in the south of Belgium, Dutch in the north, and German in the east). Our findings suggest that Belgium is mostly influenced by France rather than the Netherlands or Germany in new product takeoff (full results are available on request).
Figure 3 further shows the substantial influence of a takeoff in the United States on the takeoff probability in Canada. If the takeoff probability in Canada without takeoff in the United States is 45%, the probability when the United States has shown takeoff increases to 56%. Thus, a takeoff in the United States gives an increase in the takeoff probability in Canada of 24%, which is economically significant. In comparison, a takeoff in the United States increases the probability of takeoff in the United Kingdom only to 47%, when that probability without a U.S. takeoff is at 45%. Thus, a U.S. takeoff increases the probability of takeoff in the United Kingdom only 5%, which is a much smaller increase than its influence on a Canadian takeoff.
Discussion
Implications
This study has important implications for public policy administrators and managers. However, these implications should be interpreted with caution because our model is descriptive (correlations) rather than normative (causation). Moreover, the empirical results are conditional on the countries in our sample.
For public policy administrators, the comparisons between countries in (1) average time to takeoff (as a demand-side measure for innovativeness), (2) foreign susceptibility, and (3) foreign clout provide valuable input for regulation decisions on the stimulation of innovation adoption and international economic policy. For example, our takeoff statistics can be used as demand-side innovativeness measures in the same way the European Commission (2003) has used the results from Tellis, Stremersch, and Yin (2003). For example, in the context of its innovation stimulation policy, the EU might compare the European region with the United States or Asia, in addition to comparing European member states with one another.
Knowledge on the role of susceptibility, clout, and intercountry distance at the country level is valuable for national public policy administrators. If susceptibility is weak and public policy administrators want to stimulate takeoff of a new product, which is often the case with digital technologies (e.g., broadband), they should acknowledge that foreign takeoffs will not aid that much. They need to promote the new product more aggressively without depending on foreign influence. If foreign susceptibility is strong, showcasing foreign acceptance—preferably from a country strong on clout and close in terms of intercountry distance—of the new product may be highly effective in increasing acceptance.
For managers, our results also yield many useful insights. First, our results show dramatic differences in time to takeoff across regions and even across countries within those regions. The most innovative regions are Western Europe and North America, followed by Central and Eastern Europe. Within these regions, however, we also found large differences in time to takeoff. In Western Europe, for example, time to takeoff ranges on average from 1.5 years for Switzerland to 5.67 years for Belgium. For managers who want to follow the advice of Tellis, Stremersch, and Yin (2003) to first launch in the most innovative country and then trickle down to other countries with longer times to takeoff, our study aids in identifying “fast” and “slow” countries. The descriptives we generated on global takeoff may also inform managers on withdrawal or repositioning decisions, for example, when a product takes longer to take off than expected (given the patterns we found).
Second, we show the importance of accounting for cross-country spillover in estimating takeoff probability. Consequently, when launching a new product, international marketing managers cannot view the new product launch in individual countries as separate managerial decisions, but they should treat them as interdependent processes, in line with Putsis and colleagues' (1997) and Van Everdingen, Aghina, and Fok's (2005) arguments. This also means that the ideal introduction country would not only be fast in time to takeoff but also have a strong influence (clout) on other (susceptible) countries. Worldwide, Hong Kong and the United States are candidate countries to start launching a new product because both show a fast time to takeoff and, at the same time, rank high on foreign clout (the 2nd and 13th place, respectively). Given the market potential of these countries, which can be determined by the market size and the expected penetration ceiling (Van Everdingen, Aghina, and Fok 2005), the United States, because of its large population size, seems to be the most promising country to enter first. Note that New Zealand and Australia also show a fast time to takeoff at 2.0 and 2.8 years, respectively. However, these countries rank low in both foreign susceptibility and clout. New Zealand is also one of the smallest countries in our sample, implying a limited market potential.
In Europe, some countries to start the launch of a new product may be Germany, France, the United Kingdom, and Switzerland. On the one hand, Switzerland and the United Kingdom show a fast time to takeoff (1.5 and 2.0 years, respectively), but they have a modest influence on other countries (ranked 18th and 14th, respectively). On the other hand, Germany and France show somewhat longer time to takeoff (3.3 and 3.8 years, respectively) but are more influential on other countries (ranked 3rd and 6th, respectively). Except for Switzerland, which is one of the smallest countries in the data set, these countries also have large population sizes and thus are attractive as countries in which to launch a new product. Although the Scandinavian countries Norway, Finland, and Sweden—countries that Tellis, Stremersch, and Yin (2003) heavily emphasize for first launch decisions—show a fast takeoff, they show only modest foreign clout, implying a limited role in cross-country spillover. Thus, considering only time to takeoff without taking into account the distance between countries and their susceptibility and clout in cross-country spillover, as Tellis, Stremersch, and Yin do, leads to less detailed insights.
Countries characterized by a relatively long time to takeoff and limited foreign clout but high foreign susceptibility are good candidates for a late product launch. Examples are Singapore, Vietnam, India, Indonesia, Pakistan, and China. After these countries are penetrated, however, the market potential is huge, given their large population sizes, especially in the cases of India, Pakistan, and China.
Limitations
Given the complexity of the process and the parsimony we want to achieve in our model development, this study has several limitations that may trigger further research. First, we do not have data on marketing variables, such as advertising and pricing. Heavy advertising or lower prices may have a positive influence on the time to takeoff in particular countries. However, because of a lack of data, we were unable to assess the role of these variables in triggering takeoff, which also means that our model cannot distinguish between supply and demand factors. Thus, the cross-country spillover effects in takeoff we identify could be driven by both supply (e.g., suppliers in Country A mimicking suppliers in Country B) and demand (e.g., adopters in one country influencing adopters in another country) factors. Thus, our model is purely descriptive.
Second, we investigate only successful products (i.e., products that have taken off in a large enough number of countries). This may lead to a success bias in our estimates. Although it would be fruitful for further research to address this issue, it is a priori not clear how it would bias our findings, and data on failed products are extremely difficult to obtain on a global scale.
Third, because we control for introduction timing in the model through the influence of foreign introductions, there is a danger of endogeneity. For example, companies might choose their international entry timing according to expectations on the time to takeoff of the countries they want to enter. This danger is important in theory but perhaps of limited practical relevance in our case. Prior research has shown that introduction patterns in practice are not (yet) driven by expectations of time to takeoff (Tellis, Stremersch, and Yin 2003) or, in our experience, by cross-country spillover.
Fourth, as with all studies on international new product growth, our study cannot include all factors that may characterize a country. Thus, spurious correlation is always a possibility in these type of studies. However, in our study, the danger of spurious correlation in the spillover effects is limited. We include the direct effect of many country characteristics that may determine takeoff. Thus, for example, infrastructural differences or variation in regulatory regimes (Stremersch and Lemmens 2009) would be picked up by this direct effect vector and not by the cross-country effects. The number of variables we can pick up in the direct effects of country characteristics is limited (e.g., infrastructure in our model would be picked up by GDP), and thus there is a small risk that we omitted variables in the country characteristics, which should lead to caution in interpretation.
Most important, we illustrated how to specify a model that accounts for global spillover effects of introduction and takeoff on new product takeoff. We also found patterns and effects that are credible. Thus, our research provides a good first step toward the further exploration of this phenomenon.