
Abstract
The authors analyze a multimillion dollar, three-year field study sponsored by five firms to assess whether enabling skipping of advertisements using digital video recorders (DVRs) affects consumers’ shopping behavior for advertised and private label goods. A large sample of households received an offer for a free DVR and service, and close to 20% accepted. Each household's shopping history is observed for 48 consumer packaged goods categories during the 13 months before and the 26 months after the DVR offer. The authors fail to reject the null hypothesis of no DVR treatment effect on household spending on advertised branded or private label goods, either one or two years after the DVRs are shipped. The predicted DVR effect is tightly centered around 0, suggesting that the data have sufficient power to identify a true null effect. Using advertising exposure information for seven of the brands in the study, the authors offer suggestive evidence that ad skipping occurs for a relatively small fraction of the total television content viewed. The authors also discuss other potential explanations for the lack of a DVR effect.
TiVo pioneered the new digital video recorder (DVR) devices used to record and play back television content. Since its debut in March of 1999, the DVR market has grown quickly. 1 The advent of digital television has led many cable and telephone companies to offer DVRs as part of their service, and adoption rates are expected to rise to 35% by 2012. According to Jupiter Media (aquired by Forrester Research in 2008) (see Greene 2007), 19% of U.S. households with televisions had DVRs by 2007. Enders Analysis similarly forecasted DVR penetration in the United Kingdom to increase to a remarkable 80% by 2012 (Andrews 2008). In response to the diffusion of DVRs, Jupiter Media (Greene 2007) predicted in 2004 that households would be watching 15% fewer commercials by 2007 (The Economist 2004). Indeed, a Jupiter Media (Greene 2007) report found that 47% of surveyed DVR users indicated skipping commercials “most of the time.” Crain's New York Business recently declared that the television advertising “industry is in deep doo doo,” citing a precipitous decline in advertising viewing as a result of DVRs (Block 2008), and the Wall Street Journal declared that “traditional TV advertising is losing luster as viewers get savier about skipping commercials” (Worden 2009).
In some international markets, these devices are called personal video recorders, or PVRs.
Advertisers have been scrambling to respond to these changes. A 2006 survey by the Association of National Advertisers found that 60% of advertisers intended to decrease television advertising budgets in response to DVRs and that 70% believed that DVRs and video on demand would reduce or destroy the effectiveness of the 30-second television advertising spot. Similarly, a 2004 survey conducted by the Advertising Research Foundation found that 76% of advertisers believed that DVRs would change the advertising marketplace (see Maddox 2006). These dire predictions have led the popular press to question the future of U.S. network television advertising revenues, an industry in which the six top English-language national broadcast networks (CBS, ABC, FOX, NBC, UPN, and WB) 2 garnered more than $2.5 billion in 2006 (Trombino 2006). On the basis of its survey, Jupiter Media (Greene 2007) concluded that “ad skipping by DVR users poses a significant threat to advertising spending. In response, advertisers and television programmers must devise new strategies for combating the potentially disastrous effects of ad skipping.” Industry experts have partially blamed DVR-enabled ad skipping for the decline in television advertising in the United States between 2006 and 2007, with network television falling 1.5% and spot television decreasing 5.1% (Glaser 2008; Nielsen Media Research 2008). In short, the conventional wisdom seems to be that DVRs present a formidable threat to the television advertising model.
UPN and WB have since merged to form the CW network.
Surprisingly, other than self-reports, there is no hard evidence that DVRs have generated a decline in actual advertising viewing, nor is there any evidence that DVRs have had any material impact on the actual sales performance of advertising-heavy consumer branded goods or the product categories in which they sell (Wilbur 2008). Accordingly, our goal is to analyze household panel shopping data to test for a DVR effect on actual purchase behavior for goods supported by television advertising. We begin with the conventional wisdom of the consumer goods industry and network television that a DVR's ad-skipping functionality reduces a household's exposure to advertising. Under the maintained assumption that advertising stimulates demand, DVRs would therefore reduce demand for advertised goods, all else being equal. In turn, DVR usage would reduce the relative share of advertised versus unadvertised brands.
Our data arise from a multimillion dollar field study conducted in conjunction with Information Resources Inc. (IRI), TiVo, and a consortium of major consumer packaged goods (CPG) manufacturers. A total of 13,946 households in four of IRI's BehaviorScan sample markets were offered a free DVR and subscription to TiVo. Of these, 1588 households accepted the offer, a number sufficiently small to offset any practical concerns about competitive reactions in the marketplace by CPG manufacturers or retailers (i.e., we do not expect adjustments to prices and/or promotions in response to the incremental DVR usage). The DVR usage data were then matched with each household's shopping behavior from 47 CPG categories for 13 months before the DVR offer and 26 months after. These data differ markedly from the self-report surveys used in previous DVR studies because they reflect actual ad-skipping behaviors collected in an unobtrusive manner. To assess whether a household skipped advertisements, we supplemented the DVR usage data with a complete network advertising schedule for seven of the brands in our sample during the posttreatment period. For these seven brands, we can determine the frequency with which households were exposed to advertisements and, conditional on exposure, the frequency with which households skipped advertisements.
We focus on two household outcome variables. First, we consider expenditures on private label products. If a DVR truly moderates the effectiveness of advertising, we would expect an increase in expenditures on unbranded alternatives as consumers shift their purchasing away from advertising-supported (i.e., branded) goods. Second, we analyze the expenditures on the most heavily advertised brands in each category. Here, we expect a decline in sales under the null hypothesis that DVRs enhance consumers’ ability to avoid the advertisements for such products. Third, we explore consumer expenditures on new products. Prior research has routinely documented positive and statistically significant advertising effects on demand for new goods (Ackerberg 2001). Again, we would expect expenditures on new products to decline under the null of a moderating effect of TiVo.
Surprisingly, we find no statistical evidence for a TiVo effect on purchase behavior during the year following the issuance of DVRs. Our difference-in-differences estimate of the TiVo treatment effect is statistically insignificant for all outcome variables. This finding is robust to controls for self-selection based on time-varying unobservables and to self-selection based on time-varying observables. Although we are unable to test for a specific cause of the lack of a DVR effect, we provide evidence that households watch relatively little recorded television content and that, conditional on watching recorded content, they exhibit modest skipping levels.
We organize the remainder of the article as follows: In the next section, we describe the nature of the DVR market and its immediate implications for a household's ability to skip advertisements. Then, we describe the design and implementation of the field study, after which we outline our analysis and report our findings. Next, we provide an overview of the potential reasons for the lack of a TiVo effect and provide some evidence that the actual level of ad skipping is lower than that reported in many self-report surveys. Finally, we conclude.
Field Study Design
The data for this field study were collected by IRI and TiVo, under an initiative sponsored by three major CPG firms. The study was conducted in four of IRI's BehaviorScan markets (http://usa.infores.com): Eau Claire, Wis.; Pittsfield, Mass.; Cedar Rapids, Iowa; and Midlands, Tex. Information Resources Inc. first constructed a subsample of 13,946 households deemed to be “potential DVR purchasers.” The conditions for the sample were twofold: A panelist must not already own a DVR (information obtained from pretreatment surveys), and a panelist must agree to remain an active member of the IRI panel.
The initial objective was to construct the treatment and control conditions through randomization. In September 2004, IRI randomly assigned each of the sample households to intention-to-treat (3064) and control (10,882) conditions. The intention-to-treat condition consisted of an offer to receive a free DVR from TiVo and a subscription to TiVo's service. The DVRs were scheduled to be delivered to households that accepted the offer at the beginning of 2005. 3 Initial acceptance was low and generated too small a treatment group to obtain any statistical power. In October 2004, IRI extended the offer to all eligible BehaviorScan households, eliminating the randomization and, consequently, abandoning the experimental design of the data. After this subsequent solicitation, 1587 panelists (11.4% of the sample) accepted the offer. In our subsequent analysis, we outline how we work around the self-selection of households into TiVo treatment and non-TiVo control conditions.
Hereinafter, we refer to the period from 2005 onward as the treatment period and the period before 2005 as the pretreatment period.
A technology ownership survey was also issued to each household to determine whether a household owned a DVR and to assess its ownership of various other consumer technologies, such as cell phones and DVD players. A total of 8786 households (63% of the sample) responded to the survey. Of these survey respondents, 1222 were in the TiVo treatment condition (conditional response rate of 77%), and 7564 were in the non-TiVo, or control, condition (conditional response rate of 61%). For our analysis, we exclude the 1282 (17%) control households that reported already owning a DVR.
Finally, the survey data were matched with demographic files and panelist shopping histories for the CPG products in 48 categories over the 55 weeks (14 four-week periods) before treatment and the 112 weeks (28 four-week periods) after treatment. These purchase records were subsequently limited to three markets after the 28th four-week period (the 14th four-week period after treatment) because data collection in the Midlands, Tex., market ceased. In total, the resultant interlaced sample size comprises 819 TiVo treated households and 4059 control households across the 48 categories excluding the Midlands, Tex., market and 968 treatment households and 5453 households inclusive of the Midlands, Tex., market.
Data Description
As we noted in the preceding section, the data for this study comprise several files: (1) IRI BehaviorScan panel data containing household-level purchase information, (2) TiVo log files summarizing each treated household's TiVo usage, (3) TNS advertising data regarding the annual advertising expenditure of each brand in our sample in each of the four geographic markets, (4) survey data on household demographics and technology usage, and (5) the network advertising schedule for nine of the brands in our sample. We summarize the use of each data set in Table 1 and provide a more detailed discussion in the following subsections.
Overview Of Data

Iri BehaviorScan Household Panel Data
The IRI panel data contain the entire purchase history for each of the households in the treatment and control groups across 48 different CPG categories in four IRI markets. The data span the period from the last month of 2003 to the end of the first quarter of 2007, yielding a 112-week posttreatment period and a 55-week pretreatment period. For each market m, category c, and household i, we compute the following two measures for each observed shopping trip in the panel data: (1) the total dollar sales of the top three advertised brands in the category, S3mci, and (2) the total dollar sales of the private label brands, PLmci.
4
We then time-aggregate these measures by household and category into three periods. The first period consists of the 55-week pretreatment period, (
We describe the advertising data used to determine the largest selling brands in advertising data subsection. We also considered two other measures: total category sales and sales of discounted products. The former measure captures any potential effects on primary demand. The latter measure may reflect effects on changes in consumer price response and/or increased brand switching (Bucklin, Russell, and Srinivasan 1998). We find no effect of DVR on either of these measures well. To conserve space, we do not report these outcomes in our subsequent analyses.
We also measure a household's expenditures on new products (
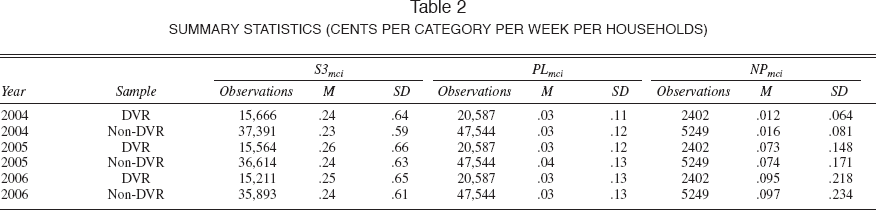
Summary Statistics (Cents Per Category Per Week Per Households)
Advertising Data
To determine which products in the IRI panel data are supported by television advertising, we use TNS AdSpender data for 2004 and 2005. This service records dollar expenditures for a wide array of brands, including CPGs. Matching the TNS and IRI data is complicated by the lack of consistency in the way each company identifies a brand. Owing to different categorization and naming conventions for brands and items, merging needed to be done manually, and for this reason, we focus on the top three brands (based on their share of category expenditures) that advertise in each category. Because total category advertising expenditures are typically highly concentrated among these top three brands, we do not expect our analysis to be sensitive to this truncation at the top three brands.
TiVo Log Files
TiVo log files track each TiVo-treated household's moment-by-moment usage of the DVR. For each machine, these files are sent nightly to a central server where they are stored. We can match each IRI panelist's machine identification number, and thus log file, with his or her purchase data. The TiVo log files are available from July 1, 2005, through July 4, 2007, though the actual distribution of DVRs to households began at the beginning of 2005.
The TiVo log files record all television content viewed on the TiVo, including live, “near-live,” and recorded content from the TiVo's hard drive. Near-live content pertains to live shows that were paused and, possibly, followed by accelerated viewing. The log files also contain the Tribune Media Services identifier of each show that was watched and the channel on which it aired. The DVR records the time of the viewing and the offset into the show in which the view started, but it does not explicitly indicate when a viewing ended. In addition, we observe all keystrokes, such as fast-forwarding and pausing, and the time these keystrokes were entered. From these data, we can infer the fraction of a treated household's total television content that is viewed live versus recorded, how often the DVR is used (as defined by keystrokes), the amount of fast-forwarding done by a household, and the specific time a fast-forward occurred into a show and its duration.
For each household, we construct the following two variables that summarize the usage of the DVR: the total number of keystrokes executed by a household i, KSi, and the number of fast-forwards, FFi. The former captures the intensity with which a DVR is used. The latter pertains to the amount of ad skipping, but it is confounded with fast-forwarding through nonadvertising content. To determine the relative degree of fast-forwarding behavior, we compute the ratio of fast-forwards to total keystrokes, FFi/KSi. This ratio controls for the possibility that people who fast-forward also happen to watch television more often and therefore are exposed to more advertisements. The average number of keystrokes per DVR is 119,092 (SD = 127,115), and the average number of forwards is 15,899 (SD = 24,121).
The DVR log files do not contain descriptive information pertaining to advertisements broadcast during a show. However, in the “Brand Advertising Broadcast Data” subsection, we discuss the seven brands for which we observe a complete advertising schedule and, thus, for which we can assess actual household-level advertisement exposures. Merging the fast-forwards with these exposures enables us to infer the degree of actual ad skipping by panelists for these seven brands.
Survey Data
The survey data were initially collected to screen out households that already own a DVR. However, we use the additional survey information about technology ownership to construct an instrument to resolve the self-selectivity of households into the TiVo treatment condition. The underlying intuition is that households that already own other media-related technology are more likely to accept the offer for a free DVR and TiVo service. We assume that these historic adoption decisions are independent of current unobserved innovations to the household expenditure variables we defined previously. The survey provides information regarding the ownership of 17 devices, such as DVD players, personal digital assistants, and satellite radio. We construct a technology ownership index by computing the fraction of surveyed devices each household owns. For the TiVo households, the mean index value is 34% (SD = .14), and the corresponding mean for the non-TiVo households is 21% (SD = .14). Thus, households that voluntarily accept the TiVo offer are more prone to be adopters of technology. We discuss the implications of this difference further in the first two analysis subsections. In addition, we use a separate survey to assess household demographics. We also present statistics for these data in these sections.
Brand Advertising Broadcast Data
In theory, the treatment effect of TiVo on brand buying behavior is based on the extent to which TiVo users skip advertisements. We attempt to ascertain whether the self-reported ad-skipping rates of nearly 50% by the Jupiter Media study (see Greene 2007) are consistent with actual behavior. If the rates are smaller (larger) than people self-report, it stands to reason that the TiVo effect might be smaller (larger) than industry experts believe. Unfortunately, TiVo log files do not provide information on actual ad skipping, because TiVo does not track the specific advertisements broadcast during a show.
We supplement the TiVo log file data with the network advertising schedule for nine advertising campaigns across seven brands in our sample. In principle, advertising exposure could be studied simply by matching the time stamps on a household's DVR log file with the calendar of precontracted times during which each advertisement was scheduled to air. Such data are problematic because many advertisements are switched across pods, meaning that the advertisements are not broadcast at the prescheduled times. Instead, IRI manually collected the complete television advertising broadcast schedule for eight of the brands in the sample for the four BehaviorScan markets during the period from April 16, 2005, to June 30, 2006. The IRI staffers audited playlists provided by the networks and cable channels. In total, advertisements for the eight brands were aired in our test markets 2661 times. Because of the labor-intensive method for data collection, our advertisement sample is limited to seven brands, which could reduce the “representativeness” of the sample. These brands comprise primarily household cleaning and personal grooming products. As such, the shows they target are not likely to be a representative sample of all shows. For example, these nine goods were rarely advertised during sporting events. A different sample of advertisements could yield different viewing rates.
By matching these data with the TiVo log files, we can determine whether advertisements for these eight brands were aired during a household's viewing time and whether the household used the fast-forwarding function during the time of these advertisements. Consequently, we can measure the extent of ad skipping for the nine brands.
The Representativeness of Free DVR Usage
A potential concern with the issuance of a free DVR is that a household may not use it the same way as a household that purchases a DVR. For example, Arkes and Blumer (1985) find that users who pay nothing tend to underuse a product. We take several steps to verify that the TiVo households exhibit similar DVR usage as typical DVR buyers. First, we contrast various aspects of DVR usage in our treatment group to aggregate usage measures provided by TiVo from its national sample of users during 2005. On average, the national sample watched 5:24 hours of television per day during the first six quarters of the posttreatment period, while the IRI panel watched 5:29 hours per day, a difference of only five minutes. Thus, television usage appears to be similar. However, we notice some differences in the TiVo usage for the IRI panel, as might be expected, because they are novices with regard to using the technology. During the first quarter of 2005, 4 months after the issuance of DVRs, the treated households spent 11% of their viewing time watching recorded content. In contrast, the national TiVo sample spent 25% of their viewing time watching recorded content. We also observe an evolution in the treatment group's usage of the DVRs over time. By the second quarter of 2006, 18 months after the issuance of DVRs, the treated households spent 15% of their viewing time watching recorded content. In contrast, the national TiVo sample spent 22% of their viewing time watching recorded content. We observe a similar evolution in the use of the fast-forwarding function. In the field study TiVo sample, the use of fast-forwards increased from 8.9 per day in the first quarter of 2005 to 11.3 per day in the second quarter of 2006. Over those same periods, the national TiVo panel's use of fast-forwards was 15.3 per day and 14.6 per day, respectively. Despite some differences in viewership patterns between our experimental sample and the actual national TiVo sample early on, we observe a trend toward convergence in usage over time. Despite the convergence over time, we note an important initial “learning” period for our TiVo sample. Therefore, in our analysis, we analyze separately the effect of TiVo on expenditures in the short run (first 12 months) and in the long run (second 12 months).
Analysis
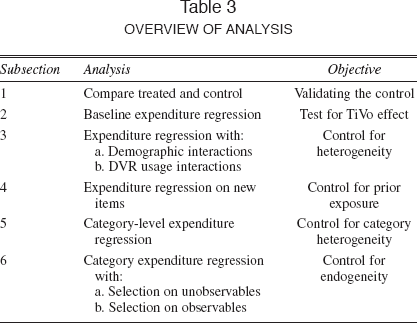
In this section, we report the findings from our analysis. The identification of the average treatment effect of DVRs on a household's spending behavior is complicated by the lack of a randomized assignment of participants into treatment and control conditions. To offset the endogeneity associated with self-selection of our sample into the TiVo treatment group, we resort to several quasi-experimental approaches. Our baseline case consists of exploiting the panel structure of our data to obtain a difference-in-differences estimate of the average treatment effect. We use a year of pretreatment data to assess the quasi-experimental validity of first differencing. Our goal is to show that the distribution of expenditures in the treatment and control groups is the same after taking differences and netting out persistent heterogeneity. We conduct several robustness checks to control for heterogeneity in the treatment effect across both consumers and product categories. In addition, we check the robustness of our baseline difference-in-differences estimates to any remaining, time-varying sources of self-selection into the treatment group. In general, we fail to detect a statistically significant TiVo effect in any of these analyses. Moreover, our point estimates are tightly distributed around zero, which suggests that TiVo does not have a qualitatively important impact on shopping behavior. Table 3 highlights our analytical strategy in the remainder of this section.
Overview Of Analysis
Validating the Control Sample
We first compare the two subsamples of households—those that adopt the DVR offer and those that do not. Of particular interest is whether we can use the nonadopters as a valid control sample for measuring the counterfactual expenditures of the TiVo households had they not adopted TiVo. To the extent that these groups are similar, the likelihood that exogenous unobserved differences between groups explain potential differences in behavior across the groups is mitigated. To eliminate any confounds pertaining to TiVo, we use only the pretreatment period, 2004, to assess potential differences across the groups.
In Table 4, we report the demographic composition of the two groups. Several notable differences between the two groups emerge. The TiVo households are more likely to have children, earn more than $45,000 per year, and hold white-collar jobs. In contrast, the non-TiVo households are more likely to be couples over the age of 45 and retired. Moreover, the TiVo adopters have higher average technology ownership scores, meaning that they own more consumer household electronics.
Demographics For The Tivo Versus Non-Tivo Households
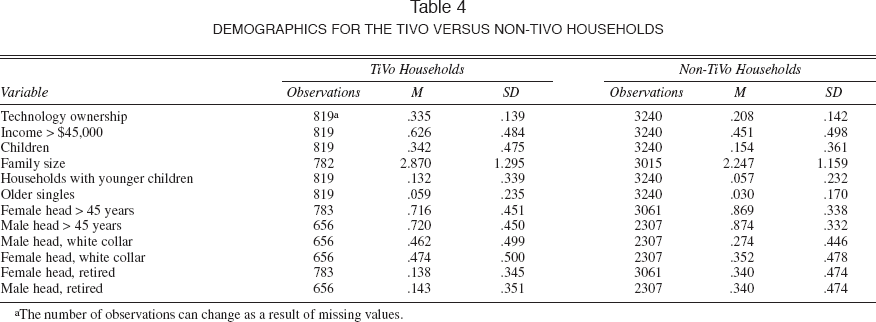
The number of observations can change as a result of missing values.
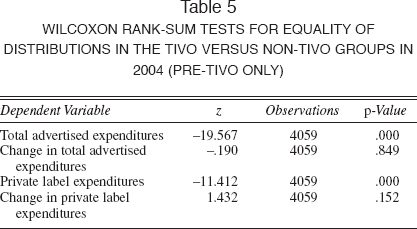
In light of these demographic differences, we compare actual shopping behavior for CPG products to assess potential differences across the two populations that might affect our analysis. We begin by testing for differences in the distribution of annual household expenditures in each of the two groups. We focus on each group's total 2004 spending on advertised and private label CPG products in the 48 categories. Recall from Table 2 that the mean expenditure level before the TiVo treatment is higher in the treatment group than in the control group, a potentially worrisome difference between the groups. Our approach consists of testing for a difference in the distribution across households for the treated group versus that of the control group. We use the Wilcoxon rank-sum test, which is a nonparametric test for assessing whether two samples of observations come from the same distribution (Mann and Whitney 1947; Wilcoxon 1945).
Table 5 reports the results from the Wilcoxon rank-sum test on several expenditure variables aggregated across categories. The test rejects the null of equal distributions for expenditure levels both on highly advertised brands and on private labels. The finding of different distributions for treatment and control households, respectively, suggests that we cannot infer the treatment effect of DVRs by comparing expenditure levels across the two groups. However, by exploiting the panel structure of the data and differencing each panelist's expenditures over time, we can control for unobserved fixed-effects differences in group compositions. We break the pre-TiVo (2004) data into two equal time intervals and construct the cross-time difference in expenditure for each panelist. We fail to reject the null of equal distributions for the cross-time differences in expenditure levels, even with our relatively large sample size. Therefore, for the remainder of our TiVo analysis, we work with the first differences in expenditures as our dependent measure.
Wilcoxon Rank-Sum Tests For Equality Of Distributions In The Tivo Versus Non-Tivo Groups In 2004 (Pre-Tivo Only)
Results for the Baseline Expenditure Model
We briefly outline our estimation scheme for the DVR treatment effect. We index the households by i = 1, …, I; the categories by c = 1, …, C; the markets by m = 1, …, 3; and the time by t ∈ {2004, 2005, 2006}. We denote a household's outcome variable (i.e., expenditure in category c by household i living in market m during year t) as Yimct. We begin with the following baseline model:

where DVRi indicates whether household i is in the DVR treatment group. The parameter τ2004 = 0 by design of the field study. In Equation 1, γ measures how the treated sample differs from the untreated sample, and τ measures the treatment effect during years t = 2005, 2006 of receiving a DVR unit at the start of 2005. Because no DVR is distributed in the pretreatment period, it follows that τ2004 = 0. In the model in Equation 1, we assume the DVR effect to be constant across categories.
To obtain a consistent estimate of τ that controls for household heterogeneity, we “difference out” the household-specific intercepts, αicm. That is, we run the following two regressions in first differences to estimate the DVR treatment effect:

where Δ is the difference operator across adjacent years. In our subsequent analysis, we study both the difference between 2005 and 2004, ΔYimc,2005 = Yimc,2005 – Yimc,2004, and the difference between 2006 and 2005, ΔYimc,2006 = Yimc,2006, – Yimc,2005. The parameter τ2005 captures the DVR treatment effect on sales in 2005, and the parameter Δτ2006 captures the change in the DVR treatment from 2005 to 2006. The latter parameter enables us to test for potential “learning” such that the usage of DVRs evolves over time. Trends in expenditures are captured by Δαmt for market m and by Δαct for category c. The latter term ensures that our estimates of the average DVR treatment effects are robust to time-varying demand shocks that are common across groups.
The model in Equation 2 differences out the nuisance parameters, αicm. Although we do not estimate these parameters, they are nevertheless implied by the model. In light of this, differencing accomplishes two goals. First, it removes any persistent household-specific effects from the data that, if ignored, could introduce endogeneity bias due to the self-selection of a household into the DVR treatment condition. As we show in the “Validating the Control Sample” subsection, differencing restores the equality of the treatment and control groups. Second, first differencing corrects the standard errors for the heteroskedasticity associated with potential heterogeneity.
We report the regression results in Table 6, omitting the category and market fixed effects to conserve space. In addition to reporting the treatment effect from 2005 relative to 2004, τ2005, we report the change in the treatment effect between 2005 and 2006, Δτ2006. We report the results for differences in expenditures on advertised goods and for differences in expenditures on private label brands. In each case, we normalize the data to a dollar-per-week basis (e.g., average dollar sales per week). The results indicate a statistically insignificant TiVo treatment effect on sales in 2005 and a statistically insignificant change in the effect of TiVo on sales between 2005 and 2006. That is, even two years after participants received a DVR and learned how to use it, we do not detect a statistically significant difference between the change in sales of treated versus untreated households. Note that if we compute the 2006 treatment effect, τ2005 + Δτ2006, we have a small and insignificant total effect for both advertised goods and private labels. 5
Regressing Yimc,2006 – Yimc,2004 on the DVR variable and controlling for market and category fixed effects provides a direct statistical test for τ2005 + Δτ2006, or the 2006 treatment effect. Consistent with the findings in Table 6, we find no effect. To conserve space and because this test offers limited additional insight, we refrain from reporting this contrast in our subsequent analyses.
Difference-In-Differences Regressions

Although statistical insignificance alone is not conclusive of a “no-TiVo effect,” it is striking that the point estimates are also tightly distributed around zero. If we account for uncertainty, the 95% confidence region of the 2005 DVR effect lies roughly between –$.06 and $.06 for both advertised goods expenditures and private label goods expenditures. Referring back to Table 2, the average weekly expenditures on advertised goods across categories in 2005 are approximately $.25. Thus, the average treatment effect of a DVR on a given household's advertised good expenditures is (in absolute value) within the range of −2.5% to 2.5% of expenditures. Given that only 17% of our sample households adopted the DVR (i.e., 819 of 4878 households), these results imply that total expenditures in a given category are influenced by roughly between –.4% and .4%, amounts that are economically small and of little managerial significance. Similarly, the average weekly expenditures on private labels are approximately $.03, and thus the total DVR treatment effect on total private label expenditures is roughly between −3% and 3%. Finally, we observe a small confidence interval for the changes in the TiVo effect for 2006. The data appear to have sufficient power to conclude that not only is the TiVo effect statistically insignificant, but it may also be marginally different from zero.
Observed Household Heterogeneity in the Treatment Effect
Given the small and insignificant effects reported thus far, we next assess whether heterogeneity in the treatment effect might be a factor. Because our estimation sample consists of a single cross-section of expenditure differences for each household, we cannot identify unobserved heterogeneity in the treatment effect. Instead, we explore two forms of observed heterogeneity. First, we examine whether the TiVo effect varies with the degree of fast-forwarding, a measure of the intensity of usage of the technology. Second, we examine whether the TiVo effect varies with observable household characteristics.
To ascertain the role of fast-forwarding behavior on our dependent measures, we specify and estimate the following regression:

where KSi is the number of keystrokes and FFi is the number of fast-forwards (we also consider key strokes a measure of DVR usage and obtain similar insights). Because we observe skipping behavior only for households that accept the DVR offer, we use the treated households for estimation. Thus, the DVR effect is subsumed into the market and category fixed effects in Equation 3.
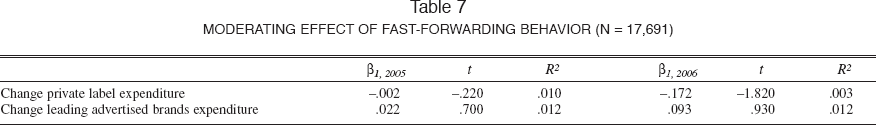
Table 7 reports the results for the fast-forwarding effect, β1, on expenditures for advertised brands and private labels in 2005 and 2006. Again, we omit the category and market fixed effects from the table to conserve space. We fail to detect a statistically significant effect of fast-forwarding behavior on purchase behavior for the TiVo households. Thus, we do not find any evidence of systematic differences in shopping behavior based on the intensity of DVR usage.
Moderating Effect Of Fast-Forwarding Behavior (N = 17,691)
Next, we estimate a model in which we interact the TiVo effect with various household demographic variables to check for heterogeneity in the treatment. In particular, we interact the TiVo treatment effect with a household's technology ownership index, a household's income, and a primary household shopper's education and age. Table 8 presents the estimates of the TiVo treatment effect, τ, and the interactions with household characteristics.
Moderating Effect Of Household Characteristics

As Table 8 shows, the TiVo treatment effect and interactions are small and statistically insignificant. The change in the treatment effect between 2005 and 2006 is insignificant for private labels and marginally significant for advertised goods among the highest-income households. Note that the 2006 TiVo treatment effect, τ2005 + Δτ2006, is small and insignificant for both advertised goods and private labels.
DVRs and New Products
In a large-scale set of split-sample television advertising field experiments, Lodish and colleagues (1995) find the largest advertising effects among recently launched brands. Recently launched branded goods should constitute an ideal context in which to test for a DVR treatment effect on product trials. Unfortunately, this test would constitute an inherently between-subjects comparison of trial levels, and thus the treatment effect of a DVR in this context is not identified. Therefore, we use our difference-in-differences estimator to recover the change in treatment effect of a DVR on the change in new brand sales from 2005 to 2006. A change in treatment effect implies that the DVR's effect on new brand sales differs between the first year of brand launch and the second year. This might arise if advertising effects are greater in the first year of a brand's life cycle than in the second year. 6
Ackerberg (2001) finds that the marginal effect of advertising on demand falls considerably after the first trial of a newly launched product.
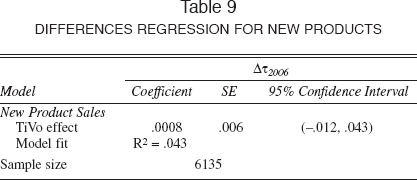
Table 9 reports the change in treatment effect for newly launched brands, omitting fixed category and market effects to conserve space. As in the previous sections, the change in DVR treatment effect is statistically insignificant. However, because of the smaller sample of new brands, our estimate of the change in treatment effect is less precise. The ordinary least squares 95% confidence interval ranges from –$.01 to $.04. Given that average weekly expenditures for new brands are only approximately $.15 in 2006, we cannot rule out that the change in DVR treatment effect might be as large as 27% in absolute value.
Differences Regression For New Products
Heterogeneity in the Treatment Effect across Categories
We also examine the distribution of TiVo treatment effects on a category-by-category basis to explore the sensitivity of our findings to any potential aggregation bias across categories. We estimate the same difference-in-differences regressions as specified previously, but we estimate them separately for each category. Consistent with the pooled regressions, the category-specific TiVo treatment effects for expenditure on advertised brands are insignificant in all but one category in 2005, and the change in treatment effect is not significant in all but two categories in 2006. Similarly, category-specific TiVo treatment effects for the private label expenditures are significant at 5% in only three categories in 2005 and in none of the categories in 2006. We would expect similar outcomes by chance. Thus, we conclude that our findings from the pooled analysis extend to the category-by-category regressions.
Results for DVR Selection Model
In this subsection, we check the robustness of the results from our baseline first-differences regression (in the “Results for the Baseline Expenditure Model” subsection) to any potential remaining biases from self-selection into the treatment group. The difference-in-differences estimator removes any self-selection associated with a persistent unobserved household effect. In that subsection, we established that the distribution of expenditures for treated households becomes statistically indistinguishable from the distribution for untreated households after taking first differences. However, we still want to control for the possibility that self-selection might arise because of time-varying unobserved household effects. For example, if the growth in expenditures for households that adopt DVRs is systematically higher than that for households that do not adopt, the net effect of a DVR could appear to be zero, even if the true treatment effect is negative. We control for this form of self-selection in two ways: selection on observables and selection on unobservables.
Selection on observables
We first consider the case of selection on observables, assuming that we can control for any time-varying sources of self-selection using observed household variables. We use propensity score matching (Rosenbaum and Rubin 1983). In the first stage, we estimate each household's probability, or “propensity,” of receiving the TiVo treatment as a function of observed variables:

where Zi is a vector of observed household-specific characteristics and ηi is distributed Type I extreme value. The latter assumption implies that the probability of treatment has the logit formulation.
In the second stage, we construct a matching estimator that matches households with similar propensities. In particular, we matched each treated household with the five most similar nontreated households in terms of propensity. 7
We refer readers to Leuven and Sianesi (2003) for details on how we implement this estimator in STATA.
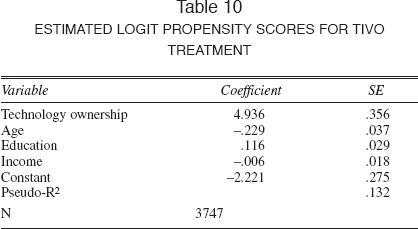
The results for the first-stage logit propensity score model appear in Table 10. As expected, we find a positive, significant effect of technology ownership and female household head education on TiVo adoption. We also find a negative, significant effect of female household head age on adoption.
Estimated Logit Propensity Scores For Tivo Treatment
We applied the propensity score estimator to household-level differences in expenditures for a design of 48 (categories) × 2 (variables: expenditures on advertised goods, expenditures on private labels) × 2 (years: 2005, 2006). As for the category-specific difference-in-differences estimator, the TiVo treatment effect is small and statistically insignificant in almost every category, for both variables and both periods. Only four of the categories generate a statistically significant DVR treatment effect of 2 × 48 for expenditures on advertised goods. None of the categories generate a statistically significant treatment effect for expenditures on private labels. This small number of insignificant effects is consistent with chance.
Selection on unobservables
In general, it is unlikely that our observed household characteristics completely capture all forms of self-selection. To control for selection on unobservables, we follow the convention in the treatment effects literature and cast our estimation problem as a linear latent index model (Heckman and Robb 1985). We effectively run an instrumental variables regression that controls for the binary nature of our potentially endogenous treatment variable. Note that none of the households have a zero probability of receiving the treatment (i.e., of self-selecting into the TiVo condition), and thus we can only identify a local average treatment effect after controlling for self-selection in this manner (e.g., Imbens and Angrist 1994).
As in the previous section, we model the decision of household i to participate in the DVR program as the latent index:

where Zi is a vector of household-specific characteristics and cov(η, Δ∊) = σ. This participation index can be thought of as capturing the household's expected net present value of utility from accepting the DVR offer. The observed treatment indicator, DVRi, is related to this index as follows:

The main effects of the variables Zi on Yi are automatically differenced out of our estimation model (Equation 2). Note that such time-invariant household characteristics would be implicitly subsumed into the household fixed effects αi. Thus, Zi act as exogenous instruments for DVRi. Note that we are also implicitly assuming that Zi are uncorrelated with Δ∊t, the unobserved component of a household's change in expenditures between a year t and a year t – 1. Thus, Zi acts as an instrument that contains exogenous variation in DVRi. We carry out the estimation using a two-step approach (Heckman 1979).
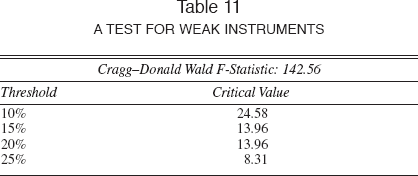
We begin with the results from the first-stage DVR adoption model (Equation 4). Our instruments consist of technology ownership and household demographics (age, education, and income): Zi = [Techi,Agei,Edui,Inci]. To assess the quality of these instruments, we use a test based on the “relative bias” of a two-stage least squares estimator versus that of ordinary least squares. Cragg and Donald (1993) derive an F-statistic that characterizes this relative bias in terms of the power of the instruments themselves. We can then test whether this relative bias exceeds some threshold (e.g., 10%) and use the critical values Stock and Yogo (2004) provide. We report the results of this test for weak instruments in Table 11 and easily reject the hypothesis of weak instruments for several threshold values.
A Test For Weak Instruments
We compute the results for the second-stage outcome equation, corrected for selection, for each category. Again, we summarize the estimations by reporting the number of categories in which we found a significant treatment effect. Beginning with the estimated covariance parameter between the selection model and the outcome equation regressions, σ, we find only mild evidence of selection. In most categories, σ is small, and in 90% of cases, it is insignificant. Similarly, we find that the estimates of σ is small and, in most categories, insignificant for expenditures on private labels. Thus, we conclude that there is little evidence for selection.
We now turn to our estimates of τ, the DVR effect on expenditures. Given the general lack of evidence of selection, it is not surprising that our point estimates for the DVR effect on the change in private label expenditures and on the change in advertised goods expenditures are similar to the regression results in the baseline model subsection, albeit “noisier.” For private label good expenditures, only three categories generate a statistically significant treatment effect in 2005 and only two categories in 2006. For advertised goods expenditures, only six categories generate a statistically significant treatment effect in 2005 and only four categories in 2006. In short, even after controlling for selection, we are unable to detect a statistically significant effect of DVRs on expenditures.
Discussion OF THE DVR NULL EFFECT
In contrast to widespread conjecture in the trade press about the adverse effects of DVRs on sales and the belief by 70% of manufacturers that DVRs reduce or destroy the effectiveness of television commercials, in our analysis, we consistently find no statistical support for a TiVo treatment effect on expenditures. In this section, we discuss potential explanations for this outcome, including (1) a low overall rate of ad skipping; (2) the potential that advertising has no effect on sales to begin with, meaning that there would also be no adverse effect of DVRs on sales; (3) a positive effect of DVRs on television consumption that, in part, might offset the effects on ad skipping; (4) the facility with which non-DVR users can also avoid advertisements; and (5) the idea that advertising fast-forwards may still have some value in terms of advertising exposure.
Ad Skipping
One potential explanation for the lack of a DVR effect is that advertisements are not skipped as often as is commonly believed. Two factors influence the number of potential skips. First, an advertisement must be recorded to be forwarded. Second, conditioned on recording, a user must decide to skip.
In self-reports, ad-skipping behavior appears to be prevalent. An ABC network survey found that 71% of surveyed people self-reported fast-forwarding through advertisements (Loughney 2007). In an ethnographic study of people observed during their viewing of recorded television, Pearson and Barwise (2007) report fast-forwarding rates of 68% during recorded television content. Similarly, Nielsen Media Research (see Guthrie 2007) reports that DVR users skipped only 60% of the commercials in a usage study spanning one week. In short, skip rates are approximately 60%–70%.
Even with high skip rates, the opportunities to fast-forward advertisements will be limited if households do not watch a high proportion of recorded television content. Several prior studies document the relatively low viewing of recorded, as opposed to live, television content, with numbers ranging from 13.8% (Wearn 2007) to less than 10% (Zigmond et al. 2009) of total viewing time. Coupling the 10% recording rate with a 70% forwarding rate implies that there is only a 7% reduction in total exposures as a result of DVRs. If so, the small reduction in advertising viewing would yield a correspondingly small DVR effect.
Using our advertising exposure data and TiVo log files, we measure skip rates and the recorded television viewing rates for our sample. For this analysis, we broke the advertising viewership into a series of conditional decisions, which we depict graphically in Figure 1.
Watch. We first observe whether a household watches any portion of a show during which the advertisement was broadcast. If all households watched each show in which our 2661 advertisements were aired once, we would observe 4,036,592 shows viewed. In our data, we observe 70,839 total actual shows watched, or 1.7% of these potential views.
Record. In general, shows must be recorded for an advertisement to be skipped. The log files we obtained explicitly denote a recorded viewing. As a caveat, it is possible to watch nonrecorded shows to the extent that live viewing is paused and viewed in a phase-delayed way without being explicitly recorded. More recently, DVR log files account for near-live views as recorded, but our data do not enable us to determine this explicitly. We find that 3486 of the 70,389 shows watched (5%) were viewed after being recorded. This statistic is important because it begins to suggest that fast-forwarding is not as endemic as advertisers expect or as reported in previous surveys. 8
In our data, recorded viewing is defined as views that are stored on the DVR. This does not include paused and delayed viewing. Thus, the total number of delayed views might be somewhat higher than the total number of recorded views, as Figure 1 indicates. It is also possible that recorded views are longer in duration than live views. Despite this, overall delayed or recorded viewing rates remain low.
Expose. Although a show is watched, a household might switch channels during advertisements, leading to no exposure. We infer an exposure whenever the advertisement appears after a person began watching a show in which the advertisement was embedded and either (1) the person watched until the end of the show or (2) the person tuned to another show before the advertisement. We find that 94% of recorded shows led to an advertising exposure, and 65% of live or near-live shows led to an exposure. This is likely the result of increased channel surfing in the context of live viewership.
Skip. We infer a skip of an advertisement if we observe a fast-forward during the interval in which an advertisement is aired. Given that many advertisements are only 15 seconds, it is especially critical to audit advertisement placements. According to IRI, advertisements are often shifted within and across pods relative to the published broadcast schedules provided by the network; thus, such data are of limited value in inferring skipping behavior. We find that 2353 advertisements are forwarded in the recorded condition (71%), and 681 are forwarded in the near-live condition (2%). The 71% statistic is remarkably close to the 68% statistic recorded by Pearson and Barwise (2007), thus showing high face validity.
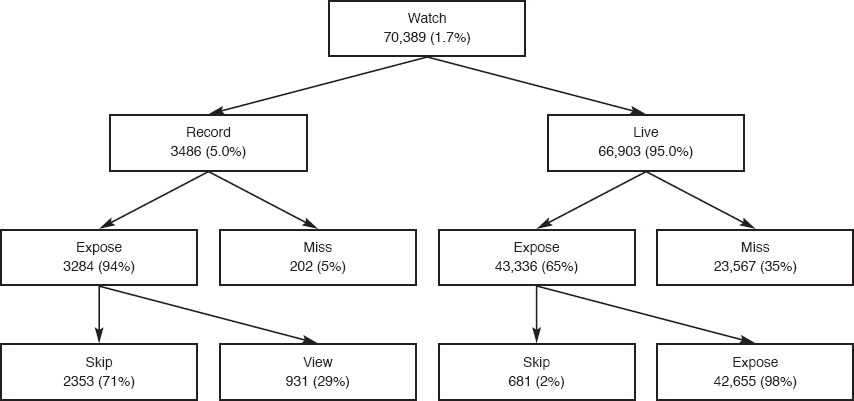
Fast-Forwarding Behavior
Figure 1 summarizes the previously discussed skipping behavior. Of the 46,620 total exposures, only 3034 advertisements are fast-forwarded (6.5%), considerably lower than the 47% self-reported skipping rate in the Jupiter Media survey (Greene 2007). These results are consistent with the 7% skipping rate reported in the DISH network data (Zigmond et al. 2009). It is possible that the low skipping rates contribute to the lack of a DVR effect.
Other Literature
The prior literature on DVRs posits several additional reasons that might underpin our DVR null effect. First, the small magnitude of the marginal effect of advertising on sales may require a very large sample to identify empirically. For example, Lewis and Reiley (2009) estimate the effect of Internet display advertisements on sales using a sample of more than one million Web users. However, we find a positive correlation between changes in advertising and changes in sales for two of the seven brands for which we observe advertising campaign data. 9 This fraction is consistent with Assmus, Farley, and Lehmann (1984) and Lodish and colleagues (1995), who also find that one in three brands has positive advertising elasticities. To the extent that our findings generalize across brands, the lack of a DVR treatment effect may not merely reflect ineffective advertising.
Specifically, we combine our advertising campaign data with the DVR log files to measure the ad exposures for seven brands in 2005 and 2006. We then compute the correlation between changes in brands’ advertising exposures and changes in brands’ expenditures. These results are available on request.
Second, and contrary to the expectations of industry experts, DVRs could enhance the advertising effectiveness by allowing viewers to match their favorite television content with their leisure time, resulting in greater television consumption. According to our personal communications with IRI, total television viewership is 6% higher in DVR households than non-DVR households. Furthermore, the chief researcher of CBS noted the following in November 2009:
The best preseason estimate for [the lift in ad view ratings due to DVRs in] the current season … was about a 1 percent increase from playback over the live program for the networks combined. Instead, many are in the range of 7 to 12 percent, with some shows having increases of more than 20 percent when DVR ratings are added. The four networks together are averaging a 10 percent increase. It's the magnitude that's really surprising us. (Carter 2009)
This increase in viewership could increase advertising exposures and further offset any potential adverse DVR effects. In our data, we observe a few instances in which a household watches the same recorded content repeatedly, increasing potential ad exposures even further.
A third factor that might mitigate the DVR treatment effect is the facility with which non-DVR households can also avoid advertisements. For example, households can readily skip advertisements by channel surfing (Zufryden, Pedrick, and Sankaralingam 1993). Zigmond and colleagues (2009) find that 15% of households with non-DVR set-top boxes switch channels. Non-DVR households can also avoid advertisements by leaving the room. Survey research by ABC finds that 48% of non-DVR users report leaving the room or ignoring the commercials (Loughney 2007). In contrast, only 13% of DVR users report leaving the room or ignoring commercials during recorded advertising breaks. These forms of advertising avoidance by non-DVR households could constitute another explanation for the lack of a DVR effect.
Finally, several studies have shown that DVR users can be more attentive to advertisements when fast-forwarding through them (Brasel and Gips 2008; Du Plessis 2007; Goode 2007; Mandese 2004; Siefert et al. 2008). For example, Mandese (2004) finds that two-thirds of DVR viewers notice the advertisements they forward. Furthermore, Brasel and Gips (2008) and Goode (2007) find that advertisements are more effective in some cases when they are viewed at an accelerated rate. Recall that our previous discussion of the log file analysis of exposures on sales also showed no coincident effect of fast-forwards on sales. This result might be related to the notion that forwarded exposures are not equivalent to a nonexposures.
Conclusions
In summary, we are unable to detect statistical evidence of a TiVo effect on CPG purchase behavior across a variety of measures, including demand for large advertised goods, private labels, and new brands. Even for households with the highest TiVo usage, we find no effects. That most of our point estimates are economically small with fairly tight confidence intervals around zero implies that there may not be a TiVo effect on CPG shopping behavior. These findings suggest that, contrary to conventional wisdom, DVRs do not present a threat to network advertising in the short run or medium run (two years). Exploratory analyses of our data indicate that only a modicum of advertisements are actually forwarded in our data and that even when they are, they do not have an adverse effect on sales. These findings expand on some previous research that suggests similar outcomes. In light of the negligible effect of DVRs on sales, it is interesting to speculate whether the DVR effect could even increase sales if the technology enhances advertisers’ ability to target their message more finely (Ansari and Mela 2003; Gal-Or et al. 2006).
We view this research as a first step toward assessing the role of TiVo on the efficacy of television advertising. Several open issues remain. First, our analysis is a field study, not an experiment, and thus is prone to self-selection issues. We use first differencing to control for potential sources of endogeneity due to correlation between TiVo adoption and persistent unobserved differences between households shopping. We also construct an instrument to control for any additional endogeneity due to correlation between TiVo adoption and differences in the evolution of unobserved shopping behavior. Ideally, future work would try to run a field experiment to obtain cleaner data that do not require econometric methods to tease out the treatment effect.
A second potential limitation is that we have only two years of post-TiVo treatment data. This may be an insufficient duration for people to learn TiVo use or for brand images to be adversely affected by a decrease in advertising. However, we offer evidence that our panel is not too discrepant from a national panel of TiVo households, and in a separate analysis (available on request), we decompose the post-TiVo treatment data into two consecutive nine-month periods and find little difference between these periods. Third, our analysis is limited to packaged goods, and therefore we cannot make definitive conclusions about the role of TiVo in other categories.
There are several avenues for further research. For example, it might be useful to understand how DVRs can be used to target advertisements (i.e., contextual advertising) more effectively and how networks should price such advertisements to firms. The attendant implications for consumer welfare are also of interest. Given the increasing ubiquity of DVR technology and its potential to reshape the advertising landscape, we hope that this article helps lay the groundwork for future studies.