
Abstract
This study shows how advertisers can leverage emotion and attention to engage consumers in watching Internet video advertisements. In a controlled experiment, the authors assessed joy and surprise through automated facial expression detection for a sample of advertisements. They assessed concentration of attention through eye tracking and viewer retention by recording zapping behavior. This allows tests of predictions about the interplay of these emotions and interperson attention differences at each point in time during exposure. Surprise and joy effectively concentrate attention and retain viewers. However, importantly, the level rather than the velocity of surprise affects attention concentration most, whereas the velocity rather than the level of joy affects viewer retention most. The effect of joy is asymmetric, with higher gains for increases than losses for decreases. Using these findings, the authors develop representative emotion trajectories to support ad design and testing.
Keywords
Ad avoidance is a major concern for advertisers and broadcasters. Certain demographics avoid up to 80% of television commercials to which they are exposed, and 87% of digital video recorder owners often actively skip past advertisements (Grover and Fine 2006). Internet video advertising is therefore increasingly seen as an opportunity. With more and more video advertisements migrating to the web, they now appear as in-page video advertisements, or before, during, or after streaming, animation, or gaming content (Elkin 2010). Yet along with the steady growth to more than $700 million in 2008, concern over avoidance of these video advertisements has grown as well (Interactive Advertising Bureau 2009). In terms of industry economics, when targeted viewers zap, skip, zip, or click past video advertisements, the firm's brand loses the opportunity to communicate, the broadcaster loses viewers, and the website loses exposure.
Evoking positive emotional responses is considered a potent strategy to engage consumers from moment to moment in video advertisements, that is, to attract their attention and retain them from start to finish. Such emotion-induced engagement of viewers increases the likelihood of obtaining desired downstream communication effects (Vakratsas and Ambler 1999). But how do marketers engage consumers emotionally, and how do the resulting emotions influence avoidance decisions from moment to moment in video advertisements? These questions motivated the current study.
Psychology has made great strides in understanding attention effects of negative emotions, such as fear and anxiety (Yiend 2010), but less is known about the positive emotions that are dominant in consumer advertising. In turn, advertising research has focused on emotions such as joy and surprise “to engineer positive environments for consumers” (Griskevicius, Shiota, and Nowlis 2010, p. 238). Yet it has mostly examined downstream rather than immediate effects such as zapping, and it has emphasized valence and activation dimensions rather than specific emotions such as joy and surprise (Baumgartner, Sujan, and Padgett 1997; Olney, Holbrook, and Batra 1991). The dynamic effects that specific positive emotions have on consumer engagement with advertising are thus still largely unexplored. Moreover, research about the moment-to-moment interplay between emotions and attention is scarce in both advertising and psychology (Fredrickson and Branigan 2005; Yiend 2010).
Studying attention and the emotions consumers experience from moment to moment may reveal the potential of joint emotion and attention tracking in pretesting advertising and indicate how advertisers can engage viewers in video and television advertisements. A recent study has found that television advertisements that concentrate viewers' visual attention in a small region of the screen, from moment to moment, rather than allow their attention to freely wander and disperse across the screen, retained viewers longer and were zapped less (Teixeira, Wedel, and Pieters 2010). However, that study did not investigate the antecedents of attention concentration and, specifically, whether and how the emotions evoked by advertisements accomplish this. This is the focus of the current study. It examines the influence that joy and surprise, two related emotions, have on moment-to-moment engagement of consumers in video advertisements. These two emotions are among the most commonly targeted emotions in advertising, as prior studies (Derbaix 1995) and a content analysis of online video advertisements reveal. For that content analysis, ten trained coders identified the targeted emotions (intended to be evoked) in a sample of 106 randomly selected online video advertisements (July 2010). Joy/happy was targeted most frequently (38%), followed by surprise (26%), and lagged by disgust (6%), with the other emotions (anger, fear, sadness) trailing even more and 18% of advertisements having no clear target emotion.
We use moment-to-moment measures of emotions and attention evoked by video advertisements on a website to predict the dynamics of consumers' avoidance decisions. We assess joy and surprise using automated facial expression detection, attention concentration using infrared tracking of eye movements, and viewer retention by recording consumers' decisions to continue watching or zap the advertisements. We let viewers freely decide what to watch and what to avoid by zapping a video advertisement at any time. This self-controlled exposure enables emotional reactions to have the same behavioral effects as in real-life situations, which is of importance for diagnostic purposes (Derbaix 1995). We collect data on emotions, attention, and zapping behavior at 250-millisecond intervals, across 28 video advertisements for 50 viewers. This results in 145,000 frames of data, which we augment with control variables known to independently influence zapping. We test our predictions using a simultaneous Bayesian frailty model, estimated with Markov chain Monte Carlo, accounting for observed and unobserved temporal, individual, and stimulus sources of heterogeneity.
Companies such as Procter & Gamble, Unilever, and GfK have recently begun to collect high-frequency data on emotions from facial expressions to understand their influence on consumer behavior. This has been enabled by soft-ware developments that automate the collection of this unique type of data, such as by eMotion (University of Amsterdam), FaceReader (Noldus), and OKAO (Omron Corporation). However, a challenge has been to develop appropriate methods that can extract diagnostic information from the resulting massive and noisy data streams and relate this information to the dependent variables of interest, such as zapping. To the best of our knowledge, our study is the first to develop such a statistical approach to eye and facial expression tracking in advertising.
Emotional Engagement with Video Advertisements
People experience emotions when their personal interests are at stake. Over the course of evolution, a set of basic emotions has developed, each with its own eliciting conditions, experiential content, facial expressions, and behavioral tendencies (Plutchik 1980). Facial expressions serve to communicate emotions to both self and others. Researchers have found distinct and cross-culturally universal facial expressions for the emotions of joy, surprise, sadness, disgust, anger, and fear, among others (Ekman 1999). Facial expressions of emotions, such as joy and surprise, differ and can be measured continuously and nonintrusively (Derbaix 1995; Wehrle et al. 2000). This offers advantages over self-report measures that may lack this sensitivity, are slow and difficult to assess continuously, and may lead to mere measurement effects, all of which threaten their validity.
Ever since Darwin (1872) reported a strong link between experienced emotions and facial expressions, there has been a keen interest in developing methodologies to accurately and efficiently assess them. The Facial Actions Coding System (FACS; Ekman and Friesen 1978), an effort to identify basic emotions from facial expressions, has proven useful in marketing contexts, though it relies on manual coding of video footage (Lemmink and Mattsson 1998). For example, Derbaix (1995) used ten human coders to measure FACS reactions to 13 advertisements in intervals of one second. However, manual coding is error prone, laborious, and difficult at the high frequencies at which emotions such as joy and surprise unfold, preventing its wide-scale use in marketing.
For these reasons, we use computer-aided emotion detection from facial expressions. Bartlett et al. (1999) show that these detection algorithms outperform nonexpert coders and were approximately as accurate as expert coders. Moreover, computer-aided emotion detection can now be done, in real time, at a rate of 4Hz (every 250 milliseconds), which is much faster than that achievable by human coders (Cohen et al. 2003). It provides the temporal resolution needed to identify the fast-acting effects of emotions on visual attention and behaviors such as zapping, which can occur well within one second (Nummenmaa, Hyönä, and Calvo 2009).
Dynamics of Emotions
We build on the “modal model” of emotion regulation (Gross and Thomson 2007) to understand the dynamics of the emotional response to video commercials (shown schematically in Figure 1). Emotion regulation refers to the processes by which people regulate either positive or negative emotions over time, either automatically and unconsciously or in a controlled, conscious manner. The emotional responses generated by the appraisal of the video commercial include fast-acting facial expressions.

Gross and Thomson'S (2007) Model of Emotion Regulation
The purpose of emotion regulation is to reduce, maintain, or intensify the emotional experience resulting from exposure to the stimulus. The modal model specifies a recursive relationship between the stimulus and three key components: emotion, attention, and behavior. While there are several ways to regulate emotions, we focus here on attention deployment and stimulus selection. Attention deployment refers to how people direct their attention to a stimulus to regulate their emotions. Distraction and concentration are two major attention strategies in response to emotionally salient aspects of the stimulus (Gross and Thomson 2007). Whereas concentration focuses attention on these emotionally salient aspects, distraction directs attention away from them. Stimulus selection is the most forward-looking approach; it involves approach/avoidance reactions to the emotion-eliciting stimulus, such as when watching/zapping a video commercial. Emotion regulation is a dynamic process, involving feedback from the emotion to attention and behavioral responses to the stimulus (Figure 1). Thus, exposure to a stimulus elicits an emotion. To the extent that people share the emotion, they will similarly focus attention on (away from) and engage in (avoid) the stimulus to abate, maintain, or intensify the emotion. This generates a new emotional experience, which must be abated, maintained, or intensified, and so on. Avoidance (zapping) ends the stream of emotional stimulation. This dynamic regulation process implies that emotions affect attention, emotions and attention will affect zapping, and the magnitude of these effects changes during exposure to a video advertisement. Our dynamic statistical model, described in the “Model” section, captures such effects.
Effects of Joy and Surprise
Emotions serve to organize perception and action to attain specific goals (Plutchik 1980). Negative emotions prompt tendencies to avoid or reject the affective stimulus, and positive emotions prompt tendencies to approach or retain it. Surprise and joy are the focus of the current study, and we derive predictions about their effects on consumer engagement with advertisements.
Joy and other positive emotions have been widely recognized to activate tendencies to broaden attention (Frederick-son 1998). As a case in point, Fredrickson and Branigan (2005) find that positive emotions induced through short film clips led to more visual exploration, as measured through self-report and facial muscle electromyography. However, recently, researchers have recognized that this broadening effect of positive emotions holds only when people have attained their current goals, in low-motivation conditions. Positive emotions then spur consideration of other (internal) goals or (external) stimuli in the environment.
However, researchers have shown that before current goals have been attained, positive emotions such as joy increase attentional focus in high-approach-motivation conditions to further successful goal pursuit (Gable and Harmon-Jones 2008). According to emotion regulation theory (Gross and Thomson 2007; Figure 1), such conditions would involve both attention concentration and stimulus selection as key regulation strategies. We believe that exposure to video advertisements presents such a condition. The experience of a positive emotion in a video advertisement informs the person that the advertisement is beneficial and activates a goal to continue exposure (Plutchik 1980). This goal encourages an increase in attentional focus, which assists in attaining the goal and promotes action tendencies to continue or maintain goal pursuit (Gable and Harmon-Jones 2008, p. 481). Thus, during exposure to video advertisements, joy will not only increase attentional focus but also induce action tendencies to continue watching the advertisement. This is consistent with the prior finding that the moment-to-moment pleasantness of television advertisements reduces zapping (Woltman-Elpers, Wedel, and Pieters 2003). For emotional pictures, related effects on psychophysiological measures (Hajcak and Olvet 2008) and eye movements (Calvo and Lang 2004) have been reported.
Eye movements comprise sequences of fixations, when the eye is still and information is acquired, and saccades, or fast jumps to direct the focus of attention to another area of interest from which information is acquired. Increased attentional focus would express itself in fixation patterns that are less variable across people because idiosyncratic differences in interest are reduced so that people tend to focus attention similarly. This interperson concentration of attention should not be confounded with intraperson concentration, the concept that has been measured in most prior research (e.g., Gable and Harmon-Jones 2008; Germeys and d'Ydewalle 2007). The basic idea is that when people are following the advertisement as its designer has intended, most will look at approximately the same thing on the screen. People who are losing interest will be distracted by other aspects of the advertisement and therefore will differ in their fixation location from the rest at that point in time. Thus, we predict that the emotion of joy leads to more focused attention patterns (i.e., people looking more at the point of focal interest in the advertisement) at each point in time. We also expect that, independent of its visual attention effects, joy stimulates viewer retention by reducing the probability to stop watching video advertisements.
Surprise arises when outcomes are unexpected. It is characterized as hedonically neutral or as positive or negative and is related to feelings of interest, curiosity, wonder, and joy (Frederickson 1998). The latter are all positive emotions. Surprise informs the person that prior expectations are disconfirmed. This leads to the interruption of ongoing information processing and reorientation to the possibly significant event (Meyer, Reisenzein, and Schützwohl 1997). The emotion of surprise developed to catch people's attention quickly and motivate them to engage in specific action (Plutchik 1980). Thus, we expect surprise to stimulate orientation to the source of unexpectedness, which would be reflected in patterns of attention across participants that are concentrated on the source rather than dispersed. Because of its vigilant nature, we expect the concentrating effect of surprise on attention to be stronger that of joy.
Because it requires time to resolve the expectation disconfirmation and raises interest, surprise should stimulate viewer retention as well. However, because the experience of surprise often is hedonically neutral or negative, the urge to prolong exposure falls rapidly after expectation disconfirmation is resolved. Therefore, we expect the effect of surprise on viewer retention to be less strong than the effect of joy. In summary, we test the following:
H1: (a) Joy and surprise increase the concentration of attention across viewers on the same visual locations in video advertisements, and (b) the effects of surprise are stronger.
H2: (a) Joy and surprise increase viewer retention in video advertisements, and (b) the effects of joy are stronger.
Attention concentration (dispersion) is the extent to which a viewer focuses (diverges) attention on (away from) a single location, at each point in time. The assumption is that at each time frame in the advertisement, there is a single location of intended focus and that this location corresponds with the consensus region on which participants fixate. Over time, the intended locus of attention may shift, or new ones may appear. Thus, our hypotheses make predictions about the extent to which the individual fixation points conform to those of the crowd, at each point in time, reflecting focus of attention. As such, the relevant comparison is across people within each time frame because the intended attentional locus changes over time. Both H1 and H2 refer to the downstream effects of the felt emotions on individual attentional focus.
We predict that there will be less zapping when advertisements minimize heterogeneity among people with regard to what they focus on, regardless of what the object is—that is, when they “bind” attention. If Teixeira, Wedel, and Pieters's (2010) findings hold up for the current study, attention concentration prolongs viewer retention by decreasing zapping. Then, support for both hypotheses would imply that surprise improves viewer retention directly by weakly decreasing zapping probabilities and indirectly by strongly concentrating attention, which in turn also decreases zapping probabilities. It would also imply that joy improves viewer retention directly by strongly decreasing zapping and that it indirectly improves viewer retention by weakly concentrating attention, which decreases zapping. Thus, joy and surprise would both improve engagement with video advertisements directly and indirectly, but in different ways. To test these predictions, we examine both the level and the velocity of each emotion as separate features of their moment-to-moment traces during ad exposure. The level of an emotion is its intensity at a given moment during ad exposure. The velocity (change) of an emotion is indicated by the first-order derivative of the emotion trace. There is evidence that both measures are important from studies on satisfaction with gambles (Hsee and Abelson 1991), influence of moment-to-moment overall feelings on ad evaluations (Baumgartner, Sujan, and Padgett 1997), and how the pleasantness of television advertisements influences zapping (Woltman-Elpers, Wedel, and Pieters 2003). Therefore, it is reasonable to predict that the level and velocity of joy and surprise separately influence moment-to-moment attention and zapping decisions. However, because this is not a previously studied topic, we cannot make specific predictions about the relative magnitude of the level versus velocity effects. That said, we believe empirical findings on velocity (change) of joy and surprise may provide key insights and help further theorizing.
Data
Participants and Stimuli
Fifty-eight paid students and staff members (mean age = 22 years, range = 18–49 years; 53% male) of a major northeastern American university participated in a controlled experiment on online browsing behavior. Participants were in the target audience for the video advertisements. They were exposed to 28 video advertisements, 14 emotional and 14 neutral, in an online setting. The neutral advertisements were interspersed between emotional advertisements as buffers to reduce the mental load on participants. We expected emotional advertisements to evoke joy or surprise at some point (on the basis of a pretest with 14 other participants and 21 video advertisements, from which we chose the 14 target advertisements). We embedded advertisements individually in identical web pages in the form of post-rolls (sequence of advertisements, each of which automatically played upon page loading after the video content). We selected half the target advertisements to evoke joy (e.g., smile, laughter) or surprise (e.g., elevation of eyebrows, mouth open) or both, as confirmed in the pretest. Table 1 presents the final list of advertisements chosen, with the average emotion intensity across time and participants, the average intensity of positive surprise, and the number of participants that expressed each emotion for at least one second. The ad elements that evoked emotions in our data vary (e.g., jokes, specific images, scenes) and are not the focus of this research. Advertisements were for various categories (e.g., beverages, consumer packaged goods, telecom, cleaning supplies, financial services) for well-known (e.g., Budweiser, Nivea, Dell) and lesser-known brands (e.g., Lincoln Insurance, Mercator, Rockstar energy drink). We counterbalanced the ad sequence to reduce order effects. Because advertisements were not randomly chosen, our analysis aims to discover emotion's potential, not its estimate based on a representative sample of advertisements in the marketplace.
Ads and Emotions

Notes: Average intensity is the classification accuracy (0%–100%) of the facial expression; average positive intensity is only calculated for nonzero instances.
Data Collection
Participants' visual attention, facial emotion expressions, and zapping decisions during exposure to video advertisements were simultaneously assessed. Participants were seated in a quiet room in front of a 17-inch eye-tracker monitor, with a separate camera affixed to the top of the monitor for facial expression recording. To relax them and increase realism, participants first saw a short four-minute humorous sitcom clip followed by the video advertisements. 1 Participants were instructed that they could watch each advertisement until the end, zap to the next one by pressing the space bar, or click on the link provided at the bottom of the page with a mouse to go to the advertised brand's web page. The web pages containing advertisements were identical, apart from the videos themselves; a click on the link sent participants to a one-page mock-up site specific for that brand and provided additional brand information, but not so much that participants would stay too long at the brand's site. The link at the end of this web page brought them to the next video advertisement in the sequence. Participants were asked to keep one hand over the space bar and the other over the mouse at all times. Showing advertisements on web pages with links increases realism and supports that the study was indeed on online browsing behavior, maximizing the opportunity for regular facial expressions to show up. No further analysis was done to understand clicking behavior. At the end, all participants were informed of the true aims of the experiment.
The low average reported levels of stress (1.43), nervousness (1.51), feeling of being observed (1.51), and abnormal viewing behavior (1.60) on a five-point scale support the success of this.
A Tobii 1750 infrared eye tracker unobtrusively (no head or chin gear) measured eye movements using infrared cameras at the rate of 50 Hz with spatial resolution of less than .5 degrees of visual angle. Participants had complete freedom of head movement. Facial expression footage from each participant was collected by means of a MiniDV camera coupled to the eye tracker and aimed at the participant's face. The continuous video images served as input to the emotion detection software, which works by fitting a virtual face mask to the video image of the face. This face mask adjusts to the form of the face (eyes, eyebrows, nose, face, and mouth delimiters) to capture 64 deviations in the line segments that relate to Ekman's FACS. These measures were processed online at the rate of 4 Hz using a Bayesian Neural Network Classifier calibrated on the images of the Cohn-Kanade database, a well-known benchmark (Cohen et al. 2003) with 500 images from 100 people. If a participant smiles, for example, some of the deviations in line segments will increase, such as the one linking both corners of the lips, while others will decrease, such as the ones linking corners of the lips to the cheekbones or to the eyes. The output of the classifier is the probability that the viewer exhibits the emotion or a neutral state. We use the probability measures for joy and surprise. Hit rates of 86% and 94%, respectively, were assessed using cross-validation for a test subset of the Cohn-Kanade database (Cohen et al. 2003). After participants had been exposed to the complete reel of advertisements, each participant was taken to a computer in another room to answer questions about the advertisements and themselves. The experiment lasted approximately 45 minutes.
Measures
Ad avoidance
The criterion for ad avoidance is the instant of the zapping decision, if taken—that is, when a participant stops watching a particular commercial by pushing the space bar (coded as 1 for avoid and 0 if otherwise). Because this event can occur only once for a participant–advertisement combination, zapping at a time frame is always conditional on not zapping previously. This dependent variable represents a binary cross-sectional (participants) unbalanced repeated measures (advertisements) time series of zapping decisions (for summary statistics of measures, see Table 2).
Data Description

Notes: Zapping statistics are for the complete, nontruncated data regardless of viewing termination time. Emotion measures are summary statistics of the intensity of the facial expression on a 0%–100% scale across advertisement, time, and people.
Emotions
The output of the emotions detection algorithm is a classification accuracy measure, ranging from 0 to 1 for each time frame for joy and surprise. Higher values indicate a higher likelihood that a viewer experiences the respective emotion at each 250-millisecond instant. Because accuracy is related to intensity, this measure also serves as a proxy for emotional intensity (for summary statistics of measures, see Table 2).
Attention dispersion
Attention is concentrated when for a particular frame in the advertisement, multiple eye fixations of participants cluster on a small spatial region in the advertisement, reflecting a consensus region of attentional focus, and it is dispersed when multiple eye fixations land on a large spatial region. Following Teixeira, Wedel, and Pieters (2010), we calculate two measures of (lack of) attention concentration: individual (IAD) and aggregate attention dispersion (AAD) using the x- and y-coordinates of focal eye positions detected by the eye tracker. As a function of the x and y focal position vector, fict, for individual i, advertisement c, and time frame t, IAD and AAD (for all Nt participants who have not zapped at t) are as follows:

We calculated IAD as a squared Euclidian distance from the moment-to-moment centroid, which we computed as the average of the fixation locations of all participants, for each advertisement c at each instant t. To measure interperson attention concentration, we used IAD (smaller values reflecting higher concentration), and we used AAD as a control variable. Because IAD is a relative (to the average focal point across all participants at each point in time) measure of individual attention dispersion, it has the desirable property of not requiring any content analysis of specific locations and thus can be used at high temporal resolutions. Lower attention concentration expresses lack of momentary ad engagement. We included the interaction between IAD and AAD to capture the effect of attention concentration by a participant when most other viewers have dispersed attention (for summary statistics of measures, see Table 2).
Control variables
We controlled for other characteristics of video advertisements and viewers that may influence attention and zapping decisions independent of emotions (Teixeira, Wedel, and Pieters 2010; Woltman-Elpers, Wedel, and Pieters 2003), namely, branding (presence of logo, brand name) and visual complexity of all video ad frames, as well as age, gender, and familiarity of the participants with the video advertisement and brand (Table 2).
Data Aggregation and Development of Measures
We aggregated eye movement, facial expression, and stimulus frame data to a 250-millisecond time frame. This time frame is within the average fixation duration for dynamic stimuli and presents a lower bound for visually based response latencies (Mihaylova, Stomonyakov, and Vassilev 1999). We used a two-step procedure to determine the key measures in the time courses of the two emotional expressions. First, we applied functional data analysis (FDA; Ramsay, Hooker, and Graves 2009) using the S+FDA package (Clarkson et al. 2005) to identify instances of joy and surprise from the raw software output while controlling for individual differences and measurement error. We chose third-degree polynomial B-splines as basis functions and set the FDA smoothing parameter to be equal to λ = 102 (Hsee and Abelson 1991; Ramsay, Hooker, and Graves 2009). Second, we clustered the functional curves of viewers separately for each advertisement and type of emotion using Wards' method with Tibshirani, Walther, and Hastie's (2001) gap procedure, which provides an optimal number of clusters (see Web Appendix A at http://www.marketingpower.com/jmr_webappendix). We used the resulting traces to determine the level and velocity (first derivative) of joy and surprise at each time frame during ad exposure. 2 Because positive velocities in joy had different effects than negative ones, we obtained both the velocities and absolute velocities. Previous research has shown some evidence for emotional change asymmetries in the context of advertising (Olsen and Pracejus 2004). 3
We also tested velocity changes (acceleration) but found no evidence for cross-cluster differences of this measure.
Future work could unify the smoothing and clustering steps with the model estimation into a single, and more elegant, method. We thank one of the reviewers for pointing this out.
Model
We develop a model for the moment-to-moment zapping decisions and attention concentration, linking them to the emotions and control variables as specified by the modal model of emotional regulation (Gross and Thomson 2007). Our model is a bivariate mixed-outcome dynamic frailty model. We assume that the probability that individual i decides to avoid advertisement c at time frame t, given parameters Θt, is P(yict = 1|Θt) = πict, where yict = 1 if participant i zaps commercial c at time t and yict = 0 if otherwise. We assume additive separability of strictly individual, commercial, and time-specific baseline avoidance rates. Models with additive separable individual and trial (here, advertisements) random effects are known as frailty models and are widely used due to their parsimony. In our study, this formulation causes a reduction of the ict-specific fixed and random effects parameters from more than 300,000 to 318. Our model allows emotions to have time-dependent effects on decisions such as zapping (Kahneman 2000).
We formulate a binary probit duration model (Sueyoshi 1995), with the exogenous influence of individual and stimuli-specific regressors and time-varying coefficients, as follows:

Here, Φ(·) is the normal cumulative distribution function. The right-hand side of the zapping equation contains the individual, ad, and temporal baseline zapping rates, followed by the aggregate effects, linearly associated to the expectation of the dependent variable through the probit link. The term X(1) is made up of the emotion variables, allowed to have time-varying effects Θt, and Z(1) includes attention dispersion, visual complexity, and brand placement covariates. Because of collinearity between some of the latter, we incorporate only brand (logo or name) presence, its duration, and cardinality of the order of appearance. In addition, as we detail in the next section, we used lagged effects of some of the variables to accommodate delays in consumer responses and the dynamics of emotion regulation.
To measure the extent to which the emotions affect moment-to-moment ad zapping decisions, beyond the direct effect in Equation 2, we estimate the indirect, mediating role of attention dispersion as well (see Figure 1). Given that IAD is a squared Euclidian distance (positive and skewed), we model it with a log-linear frailty model:

where, similar to the zapping model, the right-hand side incorporates demographics and individual advertisement and X(2) captures the emotions and other covariates as before.
To incorporate the covariation in zapping and IAD, we jointly estimate the effect of emotions, attention, and control variables on zapping and the effect of emotions and control variables on attention (see Figure 1). Stacking the error terms into εict, and letting *Z(1) be Z(1) less the attention dispersion variables, we can write the simultaneous model as follows:

Equation 4 describes a bivariate mixed outcome dynamic frailty model, where μi and αc are individual and ad specific, respectively, and are a linear function of demographics Xi(3) containing age and gender and with associated parameters Λ) and individual ad characteristics (Xi(4) containing ad duration, ad familiarity, and brand familiarity, with associated parameters K). Moreover, we allow the time-specific baselines θt to evolve stochastically according to a random walk to capture nonmonotonic behaviors (Gustafson and Siddarth 2007).
In summary, the probit model describes zapping on a moment-to-moment basis and as a direct and indirect function of emotions, as well as attention measures and other covariates that capture individual, stimulus, and temporal heterogeneity. The log-linear model does the same for attention concentration (IAD). The joint model provides a dynamic representation of zapping and attention consistent with Gross and Thompson's (2007) model of attention regulation to establish the influence that joy and surprise have on consumers' momentary decisions to engage with advertisements.
Specification of Lags
Eye movements, facial expression of emotions, and zapping have different response latencies and thus do not occur simultaneously. Coordinated motor actions (zapping) are slower than facial expressions, which are slower than the eyes (Hansen and Hansen 1994). Therefore, two pertinent questions are when emotions influence IAD and zapping, and whether IAD also influences emotions. We summarize the results of auxiliary analyses to answer the questions and to correctly specify lagged effects in X(1) and X(2) in Equation 4 (see Web Appendix B at http://www.marketingpower.com/jmr_webappendix).
We regressed surprise and joy on IAD, and all three of them on zapping, including control variables, for lags of 0 (effect occurs within 250 milliseconds) to 5 frames (within 1500 milliseconds). The direction of causality between IAD and emotions is deduced from their correlation and temporal precedence. The results with guidelines for specification of lags were as follows:
Levels of surprise and joy affect zapping with a lag of two frames (500–750 milliseconds),
Velocities of surprise and joy have an instantaneous effect on IAD (0–250 milliseconds),
IAD (and AAD) affect zapping with a lag of two frames (500–750 milliseconds), and
IAD has no direct effect on surprise and joy.
These findings are consistent with our theory (Figure 1) and with prior research on the emotion–attention relationship. Finding 2 is in line with evidence that emotionally salient content causes eyes to orient both reflexively and voluntarily, between 160 milliseconds and 320 milliseconds (one frame) (Nummenmaa, Hyönä, and Calvo 2009). Findings 3 and 4 are in line with theories of saccadic latencies and a separate reaction time experiment (not reported here due to space constraints). Detailing point 4, it states that attention dispersion, by itself, has no direct effect on surprise or joy. This is reasonable because there is no physiological reason deviations of the eyes from what others are viewing, as captured by IAD, should by themselves induce an emotion within a 250-millisecond time window of the data. Thus, theory and empirical evidence jointly point to emotion directing attention in the current context.
Model Estimation
Because of the frailty and hierarchical structure of the model, we estimated it using Bayesian methodology with data augmentation for the probit model. We used the forward filtering backward sampling algorithm (Frühwirth-Schnatter 1994) to estimate Θt, after which ω is straightforward to sample. Moreover, we used separate conditional Bayesian shrinking steps for μi and αc, and a simple Bayesian linear regression step for ψ(1), ψ(2), ψ1, ψ2, and ψ3. Elements of the variance–covariance matrix of εict were obtained through postprocessing. All priors are standard conjugate diffuse priors. The Markov chain Monte Carlo was run for 50,000 iterations on a total of 145,000 observations. The posterior distributions of the parameters of 2000 draws were extracted, thinning 1 in 10 draws, after a burn-in period of 30,000. Starting values were from the maximum likelihood parameter estimates from independent homogeneous probit and log-linear models. We checked convergence through Geweke's (1992) z-score, which, at −.18 (p = .42), did not reject stationarity. As for the individual regression parameters, 60% of the 582 estimates had z-cores within the ±1.96 interval. The other 40% seem stable on a visual check of the trace plots.
Results
Model Diagnostics and Specification
Duration of the advertisements ranged from 15 seconds to 102 seconds (60 frames to 408 frames) in our data set. The number of advertisements watched by at least one person drops to less than ten after 120 frames (30 seconds) and to less than five after 200 frames. Because this makes model estimation for durations longer than 30 seconds unstable, we truncated the data at 120 frames. This leads to using 81.2% of the total data and provides stable estimates and good convergence of the Markov chain Monte Carlo iterations from different starting values. Furthermore, the frame-by-frame correlation between joy velocity and absolute velocity and that between surprise level and velocity was high, above .60. This hampered stable estimation. Our solution was to estimate only time-varying intercepts and parameters for the levels of emotions, letting the velocity and absolute velocity parameters have time-invariant effects. Consequently, collinearity is not a major problem in the final model because no pair of included variables had a correlation higher than .5. Condition numbers were 3.09 for the zapping model and 2.87 for the attention model.
Table 3 gives the explained variance of individual, ad, and temporal heterogeneity effects and the sets of explanatory variables, GPR2 (Gelman and Pardoe 2006), the equivalent of adjusted R2 for multilevel models. It requires fitting only the full model, which is convenient given that our proposed model takes more than 300 hours to converge using 120 frames (about four times longer for 240 frames) on a grid server. We estimated the GPR2 at each level of the hierarchy for the full model in Equation 2. The GPR2 for the first level of the full model is 63% and confirms that the sets of variables jointly explain a significant portion of the variance in observed zapping. The GPR2 of 94% for the time-varying component of the model shows the importance of taking temporal heterogeneity of parameters into consideration. The GPR2 of 19% and 2% for ad and individual heterogeneity, respectively, further shows the importance of the former. In other words, the video advertisements are fairly different from one another, and viewer demographics have a very low explanatory power in this study (adding interactions between demographics did not improve this). Table 3 shows that ad familiarity is an important predictor of increased avoidance with 18% of relative explained variance. Emotions capture a massive 72% of the relative explanatory power, with all other variables explaining the remaining 10%.
Model Comparison and Importance of Variables in Zapping Model

Notes: Covariates: video brand, audio brand, size, duration, cardinality, and visual complexity.
We estimated alternative models with additional emotional measures to assess whether important emotional features or interactions between them were left out, and we tested whether other lag effects that had emerged from the auxiliary analyses would improve the model. This was not the case. Before the final analyses, we standardized all independent variables to facilitate comparison of parameter estimates.
Emotional Consequences on Attention and Zapping
Table 4 summarizes the posterior distributions of the parameters. It shows that high levels of joy increase attention concentration (−.032) but that the velocity and absolute velocity of joy are not significant. This supports H1: In this situation of high approach motivation, joy prompts concentration of attention rather than exploration. In further support of H1, higher levels of surprise also induce attention concentration, in line with its theoretical “halt then reorient” function. Also in support for H1, surprise has a stronger influence on attention than joy has (three times more: −.105 vs. −.032). The positive velocity effect of surprise on IAD (.006) indicates that fast changes in surprise somewhat attenuate the attention concentration effect due to higher levels of surprise. However, the net effect of surprise level on IAD dominates. These results demonstrate the rapid concentration of attention due to surprise.
Effects of Joy and Surprise on Attention and Zapping

Indicates parameters averaged over time for zapping model.
Notes: Estimates in boldface have one-sided 95% posterior confidence intervals that do not contain zero. To reduce skewness of IAD (a squared Euclidian distance), we used the Euclidian distance.
In support of H2, both emotions also directly reduced zapping, even when we control for attention concentration (IAD). As H2 predicted, the effects of joy on zapping are larger than the effects of surprise (level: −.398 vs. −.164; velocity: −1.818 vs. −.168). Notably, beyond these effects, joy has an asymmetric effect on zapping: Positive changes in joy reduce zapping more than negative changes in joy increase it, with 98% probability. These findings provide strong support our hypotheses.
Figure 2 shows the time-varying intercepts of attention dispersion and zapping. These capture inherent dynamics in the time series—those not accounted for by the predictors but caused by unobserved aspects of the advertisements. The zapping baseline evolves over time, starting from lower zapping rates in the beginning of the advertisements. The attention dispersion baseline drops over time from initially higher levels, to rise again after about 20 seconds. As for the dynamic influences of the emotions predicted by emotion regulation theory, joy reduces zapping progressively across exposure: Viewers are less likely to zap in the later portion of video advertisements than in the beginning when experiencing joy. The first few seconds are critical for advertisements to captivate viewers' attention: Early surprise more strongly reduces zapping than surprise later on. However, these findings may also be caused by a selection effect: Toward the end of the advertisement, people who do not enjoy it have already zapped away.

Moment-to-Moment Baseline Attention Dispersion and Zapping Rate (TOP) and Emotion Effects on Zapping (Bottom)
As we predicted, attention concentration (lower IAD) reduced zapping. Because the two emotions influence attention (IAD) and zapping, this effect reveals the dual route that emotions take to influence zapping directly and indirectly. Table 3 shows the impact of the emotions on zapping and attention dispersion: Although 72% of the variation in zapping is explained by the emotion measures (58% by changes in joy alone), the level of surprise is the largest predictor of attention concentration, with 29% of all 14 variables. The effect of visual complexity squared (mean-centered U-shaped effect) on zapping indicates that both lower and higher levels of visual complexity of the advertisement increase zapping relative to medium levels, independent of all other factors. The influences of the control variables are consistent with expectations.
Optimal Emotion-Induced Engagement in Video Advertisements
Advertisers want their target customers to view video advertisements fully and pay concentrated attention. Our model and findings can help assess the extent to which online advertisements achieve these objectives. Although ad development is a multifaceted creative process that is difficult to formalize, control, and measure quantitatively, awareness of empirical regularities can support creative ad development. Similar in spirit to the creative templates of quality print advertisements that focus on rhetorical techniques in ad messages (Goldenberg, Mazursky, and Solomon 1999), we describe trajectories of emotions that increase engagement in video advertisements. Rather than making specific recommendations about the content of video advertisements, our approach more modestly aims to evaluate the intensity and timing of emotions to engage viewers longer and more attentively. The specific rhetorical and other ad message and design techniques to evoke the emotions are outside our scope. We aim to illustrate how the creative process can be supported by knowing the influence that typical sequences of joy and surprise emotions over the course of advertisements have on concentrating attention and retaining viewers, using our model and data.
First, we assess how the current set of advertisements performs to identify “best-in-class” patterns of emotions. To do this, we establish the average emotional trajectory of each video advertisement and plug it into Equation 4, keeping all other ad attributes fixed. This provides scores for attention dispersion and zapping for that video advertisement. The inverse of these measures reflect estimated attention concentration on screen and retention of that advertisement. Figure 3 (Panel A) gives a plot of these two measures for the 28 advertisements in our data set. The positive association between attention concentration (vertical axis) and viewer retention (horizontal axis) reflects the impact of the emotions. Four advertisements (black dots) stand out because of their higher predicted attention concentration and viewer retention. These advertisements apparently induce effective emotion trajectories. To illustrate, Figure 3 (Panel B) shows the trajectories of joy for the two best performers: Apple Mac and Bud Light.
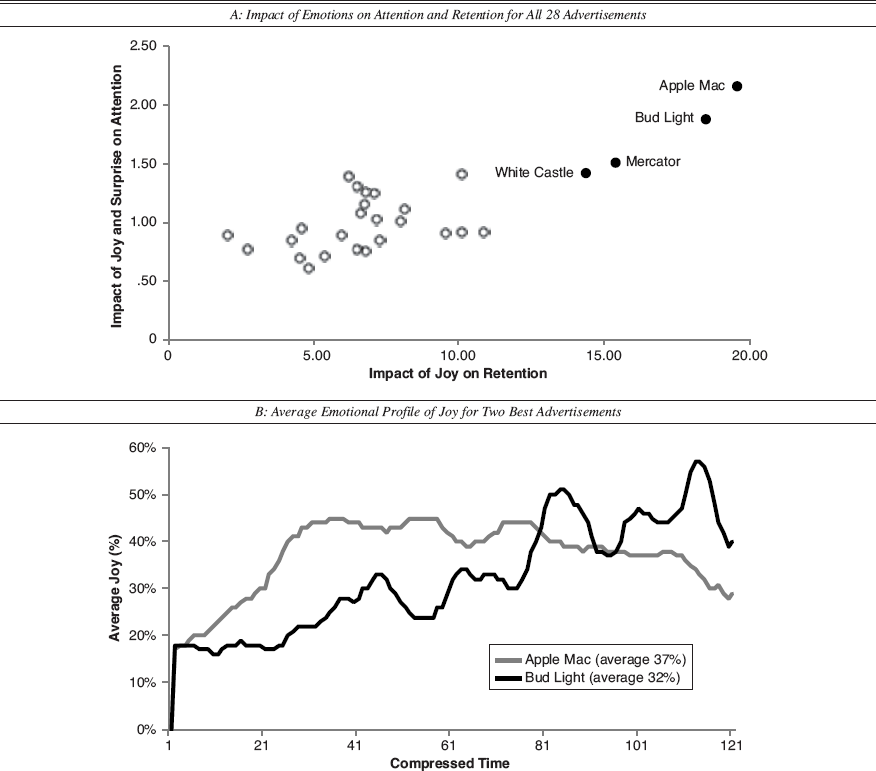
Impact of Emotions on Attention and Retention for all 28 Advertisements and Average Emotional Profile of joy for two Best Advertisements
Combining this observed emotion trajectory with the parameter estimates (Table 4) indicates that the effectiveness of the Bud Light advertisement is due to the larger impact of positive changes than negative ones, an increasing trend, and a high end-peak of joy. The Apple Mac advertisement does well for different reasons: It has a higher average level of emotion (37% vs. 32%) than Bud Light and a better ability to concentrate attention through stable and high levels of joy. This reveals how different emotion trajectories can lead to comparably high performance of video advertisements either directly, as explained by the zapping model, or indirectly, as is evident from the IAD model.
The Appendix provides the analysis and intuition behind optimal emotion trajectories. Using this information, we derive five emotion trajectories, the first two of which are optimal. A peak-valley-peak repetition of joy leads to the highest expected retention of viewers. 4 Peak-and-stable is an optimal nondecreasing trajectory. The Apple Mac advertisement is an exemplar of the latter trajectory. As a basis of comparison, we identified three other trajectories from emotion timing studies (Baumgartner, Sujan, and Padgett 1997; Wehrle et al. 2000; Woltman-Elpers, Wedel, and Pieters 2003). A stable-and-peak trajectory is typical for certain mystery advertisements that present the key emotional scene at the finale. It targets classical conditioning of attitudes through emotional reinforcement at the end. A linear increasing trajectory is based on the idea that people prefer upward-sloping emotional sequences more generally. Last, because it may be a stretch to assume or desire that advertisements induce maximal peaks and valleys in emotions at each point in time during a 30-second video advertisement, we also estimate a milder version of peak-valley-peak. In this template, which we call “increasing peak-valley-peak,” changes are not as abrupt, and there is a positive trend over time, finishing at the highest level. The Bud Light advertisement is an exemplar of this approach.
To make the benchmarks comparable to the advertisements, we imposed a limit on the peak height separately for joy and surprise according to the maximum average emotion observed in our data set: 12% for surprise and 48% for joy.
We estimate the attention concentration and retention levels of the five emotion trajectories from the parameter estimates and compare them with the observed trajectories of the advertisements in our data, after normalizing their effects relative to those of the linear increasing trajectory (see Figure 4). For example, Bud Light performs approximately 50% better on retention and about 20% better on attention concentration than the linear increasing type. Figure 4 also shows how the four best advertisements (shown as black dots) compare with the others (white dots) and the five emotion trajectories (grey diamonds). Optimal trajectories are the peak-and-stable, which is best overall in concentrating attention, and the peak-valley-peak pattern, which is best in retaining viewers.
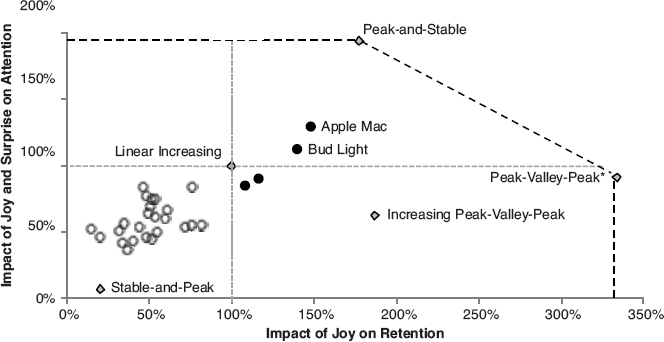
Performance of the Advertisements Relative to Emotion Trajectories
A novel insight is that the emotional rollercoaster caused by the ups and downs of the peak-valley-peak and increasing peak-valley-peak trajectories reduce attention concentration (compared with peak-and-stable), despite ultimately resulting in more viewer retention. Furthermore, because there is no positive effect of decreases in emotion (the asymmetry effect) on attention concentration, attempts to use emotions to increase attention concentration over that of the peak-valley-peak profile will result in lower retention rates. Similarly, any gains in retention beyond that of the peak-and-stable type will result in lower attention concentration. The other three trajectories are dominated on at least one of the two dimensions by the peak-valley-peak and peak-and-stable patterns, with the end-peak performing worst on both dimensions.
It is noteworthy that most advertisements in our sample can, in theory, be improved in terms of attention concentration, retention, or both, by mimicking one of the four prototypical benchmark profiles (but not stable-and-peak). Yet when it comes to improving the time course of emotions for the four best advertisements, major gains in viewer retention can be attained only by compromising attention concentration, and vice versa. Our analysis pinpointed this trade-off between attention concentration and viewer retention, at the high end of the attention–retention spectrum (Figure 4). Although it is challenging to induce the optimal emotion trajectories, there is value in using them as a template in creative ad design. Having identified these emotion trajectories can also inform pretesting practices of video advertisements. It focuses advertisers and agencies on which specific emotions and emotion aspects of video advertisements need improvement and what the likely gains of potential improvement are.
Discussion
Avoidance of television advertising has become a major problem for the advertising industry. This is one reason advertisers are migrating to the Internet. However, viewers exhibit avoidance behaviors online as well, either through lack of attention concentration or simply by various forms of zapping, clicking, or scrolling the advertisements. Advertisers are using emotionally engaging video advertisements to capture and retain target viewers' attention and keep them from zapping. Yet insights into the effectiveness of emotions in attaining these goals—in particular, from moment to moment during advertising—are limited. To date, few guidelines exist on when to evoke which specific emotions in advertisements, and no benchmarks exist to evaluate what works well and what does not.
We offer the first study, to our knowledge, to examine multiple moment-to-moment emotions through automated facial expression detection and to disentangle the influence of two frequently used emotions, joy and surprise, which are targeted in approximately two-thirds of online advertisements. The proposed dynamic model yields diagnostic information about the specific moments that trigger consumers to lose concentration and/or to zap. Using the model, we derive optimal emotion trajectories and compare them with observed trajectories in our data.
With companies such as Procter & Gamble and Unilever leading the way by investing in high-frequency facial emotion tracking of consumers, we believe that our proposed method can be of newfound value to the endeavor of these and other companies and to the developers of software for automatic emotion recognition from facial expressions, such as eMotion (University of Amsterdam), which is used in this research; FaceReader (Noldus); and OKAO (Omron Corporation). This is a promising technology not only for advertising (GfK's frequency facial emotions measurement lab) but also for the field of human–computer interaction (e.g., the Sony Cyber-shot line of cameras, which have a “smile shutter” to automatically trigger a snapshot when people smile). The challenge in these applications is to make sense out of the massive amount of data and use it appropriately to predict behavior. Our proposed method provides a first step.
Novel Findings and Implications
We found evidence that, from moment to moment during ad exposure, the emotions joy and surprise influence viewer retention directly and indirectly through their influence of attention concentration, which in turn affects viewer retention. Both joy and surprise led to concentration of attention, which reflects the attention-gaining power of advertisements at those moments. The attention concentration effects of surprise were much stronger than those of joy. The finding that joy led to attention concentration is counter to predictions based on the broaden-and-build model (Frederick-son 1998) but fits with recent findings in psychology. The source of the positive emotion is typically outside (exogenous) the focal task in prior work on the broaden-and-build model. However, Gable and Harmon-Jones (2008) find that (approach-motivated) positive emotions actually focused attention on the source that led to the emotion (i.e., when the positive emotion is endogenous). We speculate that the attention concentration effect of joy in our study arises because the experience of joy concentrates attention on the source of the emotion, which is in the video advertisement.
We also found that attention concentration by itself reduced the likelihood of zapping video advertisements from moment to moment, supporting previous findings (Teixeira, Wedel, and Pieters 2010). It suggests that television advertisements with the ability to concentrate consumers' visual attention on specific locations in the advertisement, and thereby reduce heterogeneity in attention, are able to retain consumers effectively. This study uses interperson measures of attention concentration at a quarter-second rate. While these are easy to compute and effective, analog measures of intraperson attention concentration that assess the extent to which the same person focuses on a stimulus over time would be worthwhile to develop and test in further research.
Moreover, we found that surprise improved attention concentration more than joy did, and joy improved viewer retention more than surprise did, revealing the dual routes to ad effectiveness that these two related but distinct emotions play. These findings provide guidelines for advertisers interested in grabbing and retaining their target customers' attention at specific moments during an advertisement and in aiming to retain their customers.
Furthermore, the velocity of both emotions influenced viewer retention; for joy, the effect was even larger than that of its level. This is evidence of the importance of momentary changes in emotions on attention and decisions, which have not been previously documented. We view our study as a first step and hope that future work will further establish a firm empirical and theoretical basis for these effects.
The emotion trajectories this study identified may serve as guides in ad development. A peak-and-stable trajectory seems particularly useful for advertisements whose aim is to maximize attention concentration; a peak-valley-peak trajectory is effective when maximizing viewer retention is the goal. Improving advertisements in the marketplace may eventually be a trade-off between further increases of attention concentration or of viewer retention. Our prototypical emotional profiles are useful in particular for advertisements in which editing and scene permutation in the stages of creative design can effectively be used to change the location of emotional scenes without compromising on other important holistic attributes (e.g., narrative, aesthetics, persuasive argumentation). One such case is movie trailer advertisements, in which multiple snippets of the movie are put together to generate attention. Our approach can be of newfound value in such cases and potentially others. 5
Movie trailers are popular on the Internet. In 2010 estimates of 10 billion videos watched online, movie trailers rank third, after news and user-generated content (Wikipedia 2011).
TiVo president Tom Rogers emphasized that “we are already processing a billion pieces of second-by-second data a day that demonstrates exactly what commercials are seen and which are not” (Myers 2008). The current study demonstrates that our model, calibrated on zapping data at even higher temporal frequency and supplemented with facial expression and attention data, provides the required insights to help improve the predictions of which video advertisements consumers will see.
Footnotes
Analysis and Intuition behind Optimal Emotion Trajectories
To assess the optimal time course of emotions, we break down the emotion trajectories into their units, namely, peak (increase), valley (decrease), or stable (flat) moments. We focus on joy for simplicity of exposure. We discretize exposure time and emotional intensity to one unit. We can now calculate all possible trajectories from the origin (0) to the end (T = 120), where we assume the emotion is absent at t = 0. From Figure A1, there are two possible trajectories: an upward increase, denoted by p (for peak), or a flat trajectory, denoted by s (for stable). Using the model parameters, we calculate the estimated utility from each option as follows:
Clearly, the peak trajectory is preferred. This analysis eliminates a null emotional trajectory as a potential optimal solution.
We now compare trajectories for a case of two discrete times and two emotional levels. Again, such a situation may occur in practice if the creative process has yielded two joy-evoking events that need to be placed in the video advertisement. As previously, a null trajectory need not be considered, as well as any trajectory that does not end at the highest terminal level (T, 1), because this is the last opportunity in the advertisement to collect utility from higher joy levels. This leaves three potential trajectories combining peak or stable segments, as we show in Figure A1, Panel B. Here, the assumption is that the emotion is absent at t = 0, and it is possible to reach maximal emotion level in half the ad time. As previously, using the parameter estimates of the retention model, we calculate the estimated contributions to utility of each trajectory as follows:
Because change parameters do not vary over time, after canceling terms, it is evident that the trajectory with highest predicted retention, p-s, benefits uniquely from a higher parameter for the level of joy at T/2. Discretizing the space of possible trajectories to three time periods and three emotion levels, an analogous analysis permits ten paths with only up or flat segments, beginning at (0, 0) and ending at (T, 1).
For examples, see Figure A1, Panel C. Again, these examples may have practical relevance if the creative process has identified three emotional events that must be placed in the advertisement. Now a series of trajectories with decreases (v for valley) in emotion levels becomes feasible, all of which are contained with the convex hull of the p-s-s and s-s-p profiles. We calculate utilities of all trajectories, the most important ones being the following:
The nondecreasing path with the highest predicted viewer retention is, similar to the previous cases, the trajectory with the quickest increase in joy and subsequent stable delivery until the end (p-s-s). However, the optimal trajectory has the fastest increase of joy, followed by the fastest decrease to zero and then increasing again (p-v-p in Figure A1, Panel C). Comparing all alternatives demonstrates this. The p-s-s path leads to less retention than the optimal p-v-p path as long as the inequality abs. velocityΘ > levelΘ2T/3/2 holds. In essence, the benefit comes from the asymmetry of the change in joy, which induces greater utility through positive changes than that due to subsequent decrease in the emotion. However, practical and executional considerations may cause the creative to adopt the nondecreasing emotional path.
When we increase the number of discrete times and emotion levels, p-s-s and p-v-p type trajectories are still the non-decreasing, unconstrained optimal trajectories, because of the Markovian property of the model. Generalizing these multiple emotion levels and multiple time periods, these trajectories correspond to the vectors (0, 1, 1, 1, …) and (0, 1, 0, 1, …), respectively. The former corresponds to a pure maximal delivery of emotion through an initial peak and stable delivery at the maximum level. The latter corresponds to the path with highest variation in the emotion delivery with an up-down-up repetition. It is an example of the peak-and-end rule for the relationship between moment-to-moment affective evaluations and retrospective evaluation of an episode. There, the peak-and-end rule applies to evaluations of the past being disproportionally influenced by two singular moments. In our context of self-exposure, the evidence shows the importance of providing emotional changes that momentarily increase viewing retention, and under the reasonable assumption that viewers might be integrating past moments, this is consistent with a high evaluation due to the peak-and-end rule.
References
Supplementary Material
Please find the following supplemental material available below.
For Open Access articles published under a Creative Commons License, all supplemental material carries the same license as the article it is associated with.
For non-Open Access articles published, all supplemental material carries a non-exclusive license, and permission requests for re-use of supplemental material or any part of supplemental material shall be sent directly to the copyright owner as specified in the copyright notice associated with the article.