
Abstract
Many service firms acquire customers by offering free-trial promotions. However, a crucial challenge is to retain the customers acquired with these free trials. To address this challenge, firms need to understand how free-trial customers differ from regular customers in terms of their decisions to retain the service. This article conceptualizes how marketing communication and usage behavior drive customers’ retention decisions and develops hypotheses about the impact of free-trial acquisition on this process. To test the hypotheses, the authors model a customer's retention and usage decisions, distinguishing usage of a flat-rate service and usage of a pay-per-use service. The model allows for unobserved heterogeneity and corrects for selection effects and endogeneity. Using household panel data from a digital television service, the authors find systematic behavioral differences that cause the average customer lifetime value of free-trial customers to be 59% lower than that of regular customers. However, free-trial customers are more responsive to marketing communication and usage rates, which offers opportunities to target marketing efforts and enhance retention rates, customer lifetime value, and customer equity.
A popular way to acquire new customers, especially among service providers, is to offer free-trial promotions. Customers on a free trial are allowed to try the service for a limited amount of time at no charge. Well-known examples are the free trials offered by mobile telephone operators (e.g., AT&T in the United States), video streaming websites (e.g., Netflix), and digital television providers (e.g., Sky News in New Zealand). Although these free trials may be popular with consumers, a crucial challenge for firms is to retain customers who have been acquired with a free trial. To address this challenge, firms need to understand whether customers attracted with free trials are systematically different from other customers. In this article, we argue that free-trial acquisition may affect the nature of a customer's relationship with the service provider and, as a consequence, influence usage and retention behavior, consumers’ responsiveness to marketing activities, and—ultimately—customer lifetime value (CLV).
An emerging body of research has shown that the conditions under which customers are acquired have implications for subsequent consumer behavior (e.g., Reinartz, Thomas, and Kumar 2005; Schweidel, Fader, and Bradlow 2008). The first group of studies documents the role of the sales channel through which customers are attracted (e.g., Steffes, Murthi, and Rao 2011). For example, Verhoef and Donkers (2005) find that acquisition through the Internet leads to higher retention rates than acquisition through direct mail or direct-response commercials. The second set of articles addresses the impact of customer referral (Chan, Wu, and Xie 2011; Schmitt, Skiera, and Van den Bulte 2011). Villanueva, Yoo, and Hanssens (2008), for example, show that customers acquired through word-of-mouth referral have longer lifetimes with the firm.
The third stream of research, in which we position our own work, examines the effects of the price structure or promotional conditions under which customers are acquired. Iyengar et al. (2011) find that customers of a telecommunication company who were acquired under a two-part tariff structure have lower usage and retention rates than customers charged on a pay-per-use basis. 1 Lewis (2006) shows that acquisition discounts lead to lower retention rates, while Anderson and Simester's (2004) results indicate that promotionally acquired customers choose cheaper products but buy more. Table 1 summarizes the relevant research.
Comparison Of This Article With Existing Studies On The Relationship Between Acquisition Mode And Customer Behavior

Customers are randomly assigned to one of two pricing structures.
According to economic theory, the lower marginal consumption cost of a two-part (as opposed to pay-per-use) tariff structure should lead to higher usage rates. Iyengar et al. (2011) explain their counterintuitive finding by pointing out that partitioned prices draw consumers’ attention and make them more price sensitive.
This article contributes to the literature in three ways. First, whereas previous work has examined the impact of promotional customer acquisition on subsequent behavior, the effects of free-trial promotion have remained largely unaddressed. A free trial involves a distinct type of sales promotion that enables consumers to start using a service without a financial obligation and to revise their initial adoption decision if they are not satisfied. A free trial thus allows consumers to engage in a low-commitment relationship with the firm (Dwyer, Schurr, and Oh 1987). Relying on buyer–seller relationship theory, we argue that this type of sales promotion may lead to systematic differences in behavior between free-trial and regular customers.
Although some studies have examined the effects of free trials and sampling, most focus on aggregate sales (e.g., Heiman et al. 2001; Jain, Mahajan, and Muller 1995; Pauwels and Weiss 2008) or immediate purchase effects (Scott 1976). Gedenk and Neslin (1999), who do study individual customer behavior, find that sampling in the mineral water category reinforces choice probabilities after the promotion. However, they do not examine retention, because this is not relevant for fast-moving consumer goods. Bawa and Shoemaker (2004) show that free samples attract new buyers who may remain customers in subsequent periods. Yet it is unclear whether the retention rates of customers attracted with a sample differ from those of regular customers.
As a second contribution, we extend insights on the role of usage behavior in the customer value generation process. Specifically, usage intensity can be an important driver of retention because it reminds customers about the personal value of the service (e.g., Bolton and Lemon 1999; Prins, Verhoef, and Franses 2009). This article adds to these insights by examining how free-trial acquisition influences the relationship between usage and retention. In particular, if this relationship turns out to be particularly strong for customers acquired through free trial, it is in the firm's interest to encourage usage among these customers. An important consideration in this respect is that many services involve two types of usage: flat-rate usage (e.g., a regular television subscription) and pay-per-use consumption (e.g., video on demand [VOD]). Although both types of usage drive retention, a pay-per-use service is also a direct source of revenues (e.g., Danaher 2002; Iyengar et al. 2011). Therefore, we distinguish between flat-rate and pay-per-use service components and examine the role of usage not only as an antecedent of retention but also as a direct component of CLV.
Third, a crucial yet unexplored question is whether acquisition mode affects customers’ responsiveness to the firm's marketing communication efforts. Therefore, we evaluate the differences in marketing responsiveness between free-trial and regular customers. Specifically, we consider customers’ reactions to direct marketing and traditional advertising because of the increased interest in marketing communication as a way to actively manage customers’ tenure (e.g., Polo, Sese, and Verhoef 2011; Reinartz, Thomas, and Kumar 2005). If free-trial and regular customers respond differently to direct marketing and advertising, firms may decide to target retention efforts to the most receptive group to reduce churn.
In summary, we investigate whether free-trial acquisition influences retention behavior and CLV and explore how it moderates the extent to which retention is driven by service usage (flat-rate and pay-per-use) and marketing communication. We develop econometric models for customers’ usage and retention decisions, accounting for unobserved heterogeneity and endogenous marketing instruments. Importantly, because we are interested in the impact of free-trial acquisition on a customer's behavior, we correct for selection effects. In particular, free trials may attract consumers with a priori lower valuations of the service (e.g., Lewis 2006). Whereas previous research on the role of acquisition mode typically has ignored selection effects (see Table 1), we consider two approaches to address these effects: explicit modeling of the selection process (e.g., Thomas 2001) and matching (e.g., Gensler, Leeflang, and Skiera 2012).
Using household panel data for more than 16,000 customers of a large European digital television provider, we find that free-trial customers have lower retention rates and use the firm's flat-rate service less intensively than regular customers. As a result, their CLV is, on average, 59% lower than that of regular customers. However, free-trial customers are more responsive to marketing communication and more likely to rely on their usage behavior when deciding whether to retain the service. These findings offer managers opportunities to better target their marketing efforts and improve retention rates, CLV, and customer equity (CE).
Conceptual Framework and Hypotheses
Figure 1 presents the conceptual framework for this research. The core consists of a customer's usage and retention decisions, which are influenced by the acquisition mode (i.e., free-trial vs. regular acquisition).

Conceptual Framework
Core Decision Process
The core decision process involves two types of periodic (e.g., monthly) decisions. Every period, consumers decide (1) how intensively to use the service and (2) whether to retain it.
Service usage
We distinguish two types of service usage that are common for subscription services: (1) usage of a flat-rate service, which is included in the subscription charges, and (2) usage of a pay-per-use service, for which consumers pay per unit of consumption. Although both types of usage may foster retention, consumption of the pay-per-use service also directly generates revenue.
Service retention
Every period, consumers decide whether to retain the service. We differentiate two sets of drivers for this decision. First, consumers rely on their usage intensity for the flat-rate and pay-per-use component to assess the utility of retaining the service (Bolton and Lemon 1999). As a result, a high usage intensity will stimulate retention, whereas a low usage rate may lead to disadoption (Lemon, White, and Winer 2002). Note that, compared with the pay-per-use service, flat-rate usage may be more consequential for customers’ evaluation of the service subscription because it is included in the fixed periodical fee (Bolton and Lemon 1999). Second, marketing communications also influence a consumer's retention decision (e.g., Blattberg, Malthouse, and Neslin 2009). Specifically, direct marketing and advertising remind customers of the benefits of the service or directly persuade them to retain it.
If consumers retain the service in the current period, they go through the same usage and retention decision process in the following period. As the dashed lines in Figure 1 indicate, this repeated decision process drives CLV. In particular, the periodic retention decisions generate a stream of fixed subscription fees (which cover flat-rate usage), whereas usage of the pay-per-use service generates additional revenue.
Differences between Free-Trial and Regular Customers
Central to our study is the expectation that the decision process to use and retain the service differs between free-trial and regular customers. Our hypotheses build on buyer–seller relationship theory, which posits that customer behavior depends on the nature of the relationship between customer and firm (Dwyer, Schurr, and Oh 1987; Johnson and Selnes 2004).
Baseline retention
Drawing on relationship theory, we expect free-trial customers to churn sooner than regular customers. Whereas the anticipated longevity of a regular contract encourages customers to immediately commit to the firm, subscription to a free trial resembles a discrete transaction that merely increases a consumer's awareness of the firm and facilitates relationship exploration (Dwyer, Schurr, and Oh 1987; Johnson and Selnes 2004). According to self-perception theory, free-trial customers may make post hoc inferences about the reasons for their behavior and thus attribute their adoption decision to the availability of a free trial rather than to a strong commitment to the company (e.g., Dodson, Tybout, and Sternthal 1978; Gedenk and Neslin 1999). In other words, a free trial decelerates the relationship formation process (Palmatier et al. 2013). Importantly, even after the free-trial period has expired, the firm's relationship with free-trial customers likely remains more fragile than that with regular customers. In particular, research by Gilbert and Ebert (2002) and Gilbert et al. (1998) indicates that consumers who receive the opportunity to first evaluate a product or service are more critical than when they immediately commit to the firm, a tendency that persists after the evaluation period. That is, the critical reflections generated during exploration of a relationship remain active even when the customer moves to a closer relationship level. Thus, we hypothesize the following:
Free-trial customers have a lower retention rate than regular customers even after the free trial expires.
Impact of usage on retention
Because customers attracted with a free trial arguably have a less developed relationship with the firm than regular customers, they may be more uncertain about the service benefits (Johnson and Selnes 2004). A major factor that informs consumers about the personal value of the service and thus helps resolve the uncertainty is their own usage behavior (e.g., Bolton and Lemon 1999). A customer may wonder, “Do I use the service enough to stay subscribed?” We expect that, to overcome their uncertainty, free-trial customers are more inclined than regular customers to assess the service's value on the basis of their flat-rate and pay-per-use consumption. Regular customers, who are more committed to the firm, are less likely to base their retention decision on usage intensity. Thus, we expect the following:
The impact of usage of a flat-rate service on retention is greater for free-trial customers than for regular customers.
The impact of usage of a pay-per-use service on retention is greater for free-trial customers than for regular customers.
Impact of marketing communication on retention
We also argue that the firm's marketing communication, in the form of direct marketing and advertising, will be more important to free-trial customers than to regular customers. Marketing communication provides free-trial customers with information that can compensate for their relatively high uncertainty (Mitchell and Olson 1981). Regular customers, in contrast, may be less susceptible to external information because of confidence in their level of expertise (Brucks 1985; Hoch and Deighton 1989). In line with these principles, Johnson and Selnes (2004) postulate that it is easier to boost commitment among customers in a lower-level relationship with the firm than among already dedicated customers. As a result, we expect that free-trial customers are more responsive to the firm's direct-marketing and advertising efforts than regular customers:
The impact of direct marketing on retention is greater for free-trial customers than for regular customers.
The impact of advertising on retention is greater for free-trial customers than for regular customers.
Baseline usage
Free-trial acquisition may also affect customers’ usage intensity. On the one hand, free-trial customers are less committed to the firm and less convinced of the service benefits, so they may have lower usage rates than regular customers. Indeed, usage is one of the most tangible reflections of engagement with the firm (Van Doorn et al. 2010). This holds true in particular for usage of the flat-rate service, which is the main object of the contractual relationship (Bolton and Lemon 1999). On the other hand, exactly because free-trial customers’ relationship with the firm is more exploratory (Dwyer, Schurr, and Oh 1987; Gilbert et al. 1998), they may use the service more frequently to become more certain about its benefits. These opposing principles do not allow us to develop unidirectional expectations regarding the impact of free-trial acquisition on usage of the flat-rate and pay-per-use services.
Data
Study Context
We test the hypotheses using a household panel data set from a large European interactive TV (iTV) provider. The iTV technology enables customers to interact with their television, for example, by browsing an electronic program guide or watching VOD. Furthermore, iTV offers enhanced image quality over regular television. To use the iTV service, customers need a broadband digital subscriber line Internet connection from the same company and a set-top box that decodes the digital signal. The focal company is the only provider of digital television through a digital subscriber line; at the end of the observation period, it had a market share of 31% in the digital television market. Its main competitor, which offers digital television through cable, had a market share of 40%. 2
The remaining 29% is captured by smaller players operating through satellite or cable.
Under regular conditions, the company's customers formally commit to a 12-month subscription period. They can opt to cancel the service earlier, in which case they pay a penalty (€50, plus €6 for every remaining month until the end of the contractual period). After the first 12 months, the contract is automatically renewed but can be terminated each month without penalty. Customers are charged a onetime setup fee for hardware and activation (on average, €16.24) and pay for service usage according to a two-part tariff structure (e.g., Ascarza, Lambrecht, and Vilcassim 2012; Iyengar et al. 2011). Specifically, the fixed monthly subscription fee of €15.95 covers unlimited usage of the basic iTV service (€9.95) and rent of the set-top box (€6). In addition, customers can make use of a VOD service, for which they are charged on a pay-per-use basis. They can select VODs from an electronic catalog containing movies, live concerts, and soccer games. Rental of VOD for 24 hours costs approximately €3, with some limited variation in price due to differences in genre and length.
The company's acquisition strategy offers a unique setting in which to study the impact of free-trial acquisition. For a period of 10 months (months 10–19 after launch of the service), the company offered free trials parallel to its regular subscriptions. Adoption of the free trial (as opposed to the regular subscription) is largely driven by consumers’ awareness of the ongoing free-trial promotion, which was mainly promoted through direct marketing. Customers acquired with a free trial did not pay setup costs and were not charged monthly subscription fees for the usage of the flat-rate service during a three-month period. However, VOD usage was not free of charge. Free-trial customers could revise their adoption decision by returning the set-top box to one of the company stores before the end of the trial period without paying a penalty. If the product was not returned by the end of the three-month trial period, the subscription was converted into a paid one such that the next nine months were considered part of a regular contract.
Data Set
From the initial sample of approximately 21,000 customers who adopted iTV when both the free trial and regular subscription were available, we retained a subset on the basis of several criteria. Specifically, we eliminated customers who had missing sociodemographic information, were employees of the focal company, or did not speak the local language (and thus could not understand the advertising and direct-marketing messages). We thus retained 16,512 customers, of which 12,612 (76%) were acquired with free trials and the remaining 3,900 (24%) signed a regular contract.
We observed customers’ retention and usage behavior until two years after launch of the service. Of the free-trial customers, 6,079 (48%) churned before the end of the observation period, whereas only 1,327 (34%) of the regular customers did so. Furthermore, the data set includes two types of usage: (1) flat-rate usage of the basic iTV service, which is measured by a customer's monthly number of “channel zaps” (i.e., how often a customer switches channels), 3 and (2) usage of the VOD service, for which we use the monthly number of VODs the customer has watched. Compared with regular customers, free-trial customers’ average usage intensity is 11 % lower for the flat-rate service (169 vs. 189 zaps per month) but 26% higher for the VOD service (.73 vs. .58 VODs per month). However, these average retention and usage measures are merely indicative of the actual differences because they do not account for selection effects or the impact of marketing activities.
We measure a customer's active use of the flat-rate service by using monthly channel zaps. We also have a partially observed measure of a customer's passive use. Specifically, for a period of just six months, we observe the variable hours, capturing the monthly number of hours that the set-top box was switched on. However, this number may not be an accurate indication of the time that the customer actively watched television: it was technically possible to switch off the television while leaving the set-top box switched on, making this variable less than ideal. For the months in which we have both zaps and hours, we find a significant positive correlation of .66 (p < .01).
The company uses two types of marketing communication: direct marketing and mass advertising. We operationalize direct marketing as the monthly number of direct-marketing contacts with a given customer (through phone, e-mail, or regular mail). On average, free-trial and regular customers are contacted .34 and .16 times per month, respectively. In the analyses, we account for these systematic differences in contact frequency. In addition, the data set includes a measure for the company's spending on mass advertising (through television, print media, radio, and the Internet). In particular, this variable quantifies the company's advertising expenditures for a given region in a given month relative to the total advertising spending for the same region and month by the company and its main competitor. This share-of-voice advertising measure varies between 0 and 1 and has an average of .74 for free-trial and .79 for regular customers. Table 2 lists summary statistics of the variables in the data set, and Web Appendix A reports the correlations between the independent variables. We provide more details on the control variables and sociodemographic variables when we discuss the model.
Descriptive Statistics For Free-Trial And Regular Customers

Model
We specify a set of equations that incorporates the interrelationships between customers’ usage (flat-rate and pay-per-use) and retention decisions. We account for unobserved customer heterogeneity, the endogeneity of marketing communication, and selection effects.
Retention
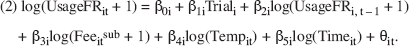
The probability of retention is modeled with a binomial probit model. Each customer i decides at the end of every month t after acquisition whether to retain the service (rit = 1) or disadopt (rit = 0). We express the utility vit of retaining the service as follows:

Thus, the utility of retaining the service at the end of month t is influenced by the dummy Triali (1 if customer i was acquired with a free trial; 0 otherwise). This enables us to test whether free-trial acquisition increases a customer's churn rate (H1). Other drivers include the customer's usage of the flat-rate (UsageFRit, measured in monthly channel zaps divided by 100) and pay-per-use (UsagePPUit, measured in number of VODs) services in month t. Retention also depends on the company's monthly direct-marketing efforts (DMit, the number of direct-marketing contacts received by customer i) and advertising intensity (Advit, the company's share of voice in customer i's region). 4 Equation 1 also includes the interactions between Triali and the usage and marketing communication variables to test H2a–b and H3a–b, which posit that the impact of usage and marketing communication is stronger for free-trial than for regular customers.
We also estimate a retention model with lagged effects of DM and Adv, leaving model fit virtually unaffected (ΔHit probability = .0002, ΔTopdecile lift = -.0418, ΔGini = .0016). We thus opt for the more parsimonious Model 1.
Finally, the equation includes a set of control variables. The model accounts for a general pattern of high defection rates during the first four months of a customer's tenure through the dummy variable Initialit. The subscription fee for customer i in month t, Feeitsub, captures the influence of price on a customer's retention decision (Ascarza, Lambrecht, and Vilcassim 2012). Variation in Feeitsub is due to temporary price reductions and the zero-price in the beginning of a free-trial customer's tenure. Moreover, we include the variable Penaltyit to account for the fact that customers were able to cancel their 12-month subscription by paying an early-termination fee. We assume that customers trade off the termination fee against future subscription fees within the current contractual period. Thus, Penaltyit equals the termination fee for immediate disadoption minus the sum of all future subscription fees that the customer would have to pay during the remaining months of the contractual period. The higher Penaltyit, the more likely it is that the customer retains the service.
Importantly, the variables Feeitsub and Penaltyit control for the systematically higher defection rates of free-trial customers compared with regular customers during the free-trial period. In this period, free-trial customers face zero subscription and cancelation fees compared with nonzero subscription and cancelation fees for regular customers. Thus, these control variables enable us to obtain a clean test of H1 through the trial dummy in Equation 1, which equals 1 for a free-trial customer even after the free-trial period is over.
We include the monthly average temperature (Tempit) to control for seasonality, 5 and the log of time since adoption (Timeit) to accommodate fluctuations in the baseline retention probability (Prins, Verhoef, and Franses 2009). The model coefficients α0i, …, α14,i are customer specific and normally distributed. Finally, the probit error term ξit is normally distributed, with a standard deviation set equal to 1 for identification purposes.
To account for differences in the length of each month and the occurrence of holidays, we also estimate retention and usage models with monthly dummy variables. However, the results are very similar and model fit hardly changes (ΔHit probability = .0004, ΔTop-decile lift = -.0748, ΔGini = .0009, ΔρFlat rate = .0242, ΔρPay per use = .0031). In addition, the model becomes cumbersome to estimate with 66 seasonality parameters (11 heterogeneous month coefficients in three equations). We therefore remain with the more parsimonious in which Tempit captures seasonality.
Usage of the Flat-Rate Service
We model flat-rate usage (UsageFRit) as a log-log regression to account for the skewed nature of this variable (Iyengar et al. 2011):
The free-trial acquisition dummy Triali captures differences in flat-rate usage between free-trial and regular customers. The lagged dependent variable UsageFRi,t–1 accounts for persistence in usage behavior. We also include the control variables subscription fee, average temperature, and time since adoption. 6 Before taking the logarithm, we add 1 to all variables for which zeros occur (e.g., Iyengar et al. 2011). β0i, …, β5i are normally distributed customer-specific coefficients, and θit is an error term following a normal distribution, N(0, σ2).
We also estimate models in which we allow direct marketing and advertising to affect service usage, but this does not lead to a notable improvement in model performance (ΔρFlat rate = -.0020, ΔρPay per use = .0137).
Usage of the Pay-per-Use Service
We model usage of the pay-per-use component (i.e., a consumer's monthly number of VODs) with a zero-inflated Poisson model, in which the zero inflation accommodates the spike at zero in the VOD usage variable:


Similar to the model for flat-rate usage, the expected number of videos watched is a function of acquisition mode (Triali), a customer's prior usage (UsagePPUi,t–1), and the variables Feeitsub, Tempit, and log(Timeit). Creditit is the VOD credit for customer i in month t (measured in euros). This VOD credit is granted by the company for a maximum period of four months to stimulate service usage. γ0i, …, γ6i are normally distributed customer-specific coefficients.
Customer Heterogeneity
We include customer heterogeneity by modeling all response parameters (intercepts and slope coefficients) as normally distributed across customers. To incorporate interdependence between the different model components, we allow for correlations between the intercepts. 7 The expected values of the retention and usage intercepts α0i, β0i, and γ0i are functions of the concomitant customer characteristics age, household size, income (e.g., Rust and Verhoef 2005), and time to adoption (Prins, Verhoef, and Franses 2009; Schweidel, Fader, and Bradlow 2008):
To determine whether we should structurally account for any correlation between the slope coefficients, we inspected the correlations between the consumer-specific posterior slopes (Train 2009) and found the mean absolute correlation to be very small (.0084). Furthermore, the low correlation between the residuals of the usage models (.0970) suggests that, after controlling for cross-sectional correlation, there is not much interdependency between the error terms left.

where Agei is the age of customer i (in years, shortly after service launch), Hhsizei is the size of customer i's household (in number of people), Incomei is the average income in the census block to which customer i belongs (in €10,000), and Adopttimei is the time-to-adoption of customer i (measured in months following the launch of the iTV service).
Correction for Endogeneity of Marketing Instruments
Endogeneity due to temporal correlation
The first type of endogeneity we address involves temporal correlation of DMit and Advit with the error term of the retention equation. For example, the company may counteract expected increases in the churn rate by boosting its marketing efforts. Following Park and Gupta (2012) and Schweidel and Knox (2013), we use Gaussian copulas to model the correlation between marketing and the error term. Whereas classical methods to correct for endogeneity rely on instrumental variables to partial out the exogenous variation in the endogenous regressors, copulas do not require instrumental variables (Park and Gupta 2012; Schweidel and Knox 2013). In line with Park and Gupta (2012, p. 573), we add the following regressors to Equation 1:
Following Park and Gupta (2012, footnote 3 and expression 10), we use empirical instead of estimated densities to generate
Endogeneity due to cross-sectional correlation
Second, endogeneity may arise from cross-sectional correlation of the marketing activities with the random intercept. Specifically, the company may target its direct-marketing efforts on the basis of consumer characteristics (unobserved to the researcher) that correlate with customers’ churn rates. To address this type of endogeneity, we follow Mundlak (1978) and include the average number of direct-marketing contacts per customer,
In the models in which we correct for both temporal and cross-sectional correlation, we compute
Correction for Selection
Selection model
We use two alternative approaches to correct for selection effects: a selection model and matching. The selection model approach estimates the retention and usage models jointly with an additional model for consumers’ selection into the free-trial or regular customer group. By allowing for correlation between the error of the selection equation and the random intercepts of the usage and retention models, we account for selection effects due to unobserved variables (Thomas 2001). Because the selection is a single event (sign up as a free-trial or regular customer), we need to allow for correlations with the random intercepts in retention and usage rather than with the time-varying error terms. To model whether a customer was acquired with a free trial (Triali = 1) or not (Triali = 0), we use a binary probit structure and write the underlying utility of free-trial acquisition as follows:

The drivers include age, household size, income, time to adoption, and three marketing variables. DMi* represents the average number of direct-marketing contacts received by customer i in the three months before signing up. Because the free trial was often promoted in direct-marketing contacts (e.g., in outbound telephone calls), DMi* likely has a positive impact on consumers’ awareness of the trial offer. Adv*i is the average share of voice for customer i in the three months before signing up. Because advertising usually promoted the regular offer, we expect Adv*i to decrease the probability that a customer was acquired through a free trial. Feei* refers to the total fees for a regular 12-month subscription at the time of customer i's sign-up. Higher fees for the regular subscription may lead consumers to search longer for a special deal or push harder when in touch with a customer service agent such that Feei* should have a positive effect on the probability of free-trial acquisition. Finally, ζi is a standard-normal error term.
Matching procedure
As an alternative to jointly estimating the selection, retention, and usage models, we apply a matching procedure that pairs free-trial customers with the most comparable regular customers. We estimate the models on this matched data set such that differences in retention and usage behavior can be attributed to the acquisition mode rather than to differences in sample composition (Gensler, Leeflang, and Skiera 2012, 2013). To match customers, we first estimate Equation 7 to compute their propensities of adopting the service on a free trial. Following Gensler, Leeflang, and Skiera (2013), we apply a hybrid procedure that combines customers on the basis of not only their propensity scores but also drivers of the selection process (i.e., the variables DMi*, Advi*, and Feei*). Next, we compute the Mahalanobis distances among consumers on the basis of their propensity scores and these three variables. 10 Finally, we use the one-nearest neighbor algorithm to identify 12,610 pairs of free-trial customers and their most comparable regular customers (Gensler, Leeflang, and Skiera 2012).
From the 12,612 free-trial customers in the data set, we eliminated two customers because their propensity scores did not lie within the region of common support, a region defined as the overlap between the propensity score distributions of the two customer groups (Gensler, Leeflang, and Skiera 2012).
Empirical Results
We use simulated maximum likelihood with Halton draws to calibrate the usage and retention models. Before discussing parameter estimates, we check model performance and the robustness of the results across alternative approaches of addressing endogeneity and selection. We then evaluate model fit for the selected approach in detail and discuss the estimation results.
Robustness Checks and Model Selection
We compare two ways to correct for marketing endogeneity (copula and Mundlak terms versus a more parsimonious approach with just the copula terms) and two ways to address selection effects (the selection model vs. matching). We discuss model performance and the robustness of the results across all four combinations. To assess model performance, we evaluate the retention model's in- and out-of-sample fit (cross-sectional and longitudinal) on three fit measures: hit probability (Gilbride, Allenby, and Brazell 2006), top-decile lift, and Gini coefficient (Lemmens and Croux 2006). Although in- and out-of-sample fit measures are not suited to compare models with and without endogeneity correction, they can be used to validate different approaches that all correct for endogeneity (Ebbes, Papies, and Van Heerde 2011). Table 3 shows that, using matched samples and including both copula and Mundlak terms, model M1 outperforms the other models for seven of nine fit criteria. Therefore, the remainder of our discussion focuses on model M1. Note, however, that the four models yield comparable outcomes for the hypothesis tests, underscoring the robustness of the results.
Selection Of Model For Retention Decision

p < .10.
p < .05.
p < .01.
We highlight the best model fit in boldface. To compute out-of-sample fit measures, we reestimate the model on a random cross-section of 70% of the customers or on the first 70% of the longitudinal observations and compute model fit for the holdout sample.
Notes: In the table, we use one-sided tests of significance. UsageFR = customer usage of the flat-rate service; UsagePPU = customer usage of the pay-peruse service; DM = direct marketing; Adv = advertising.
Estimation Results
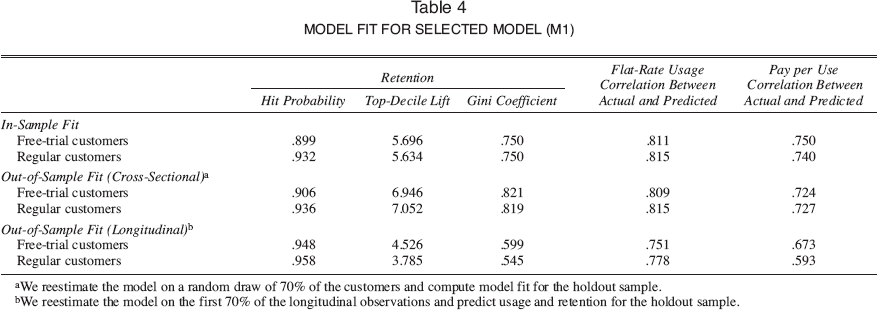
Table 4 reports in- and out-of-sample fit measures for the selected model M1 in more detail. In addition to the measures for the retention model, we use the correlation between actual and predicted values as a fit measure for usage of the flat-rate and pay-per-use services. Overall, the different measures suggest a good in- and out-of-sample model fit for both free-trial and regular customers. The fit of the auxiliary propensity model (Equation 7) is adequate (hit probability: 66.71%), and the parameter estimates, reported in Web Appendix B, are face-valid.
Model Fit For Selected Model (M1)
We reestimate the model on a random draw of 70% of the customers and compute model fit for the holdout sample.
We reestimate the model on the first 70% of the longitudinal observations and predict usage and retention for the holdout sample.
Table 5 presents the parameter estimates for the focal models. For the heterogeneous parameters, we focus on the population means. We first discuss the relationships of the conceptual framework and then address the effects of the control variables. Hypothesis tests are one-sided, and the remaining tests are two-sided.
Estimation Results

p < .10.
p < .05.
p < .01.
Notes: Log-likelihood = −310,958; N = 196,251; Bayesian information criterion = 622,892; Akaike information criterion = 622,077. In the table, we report two-sided tests of significance.
Core decision process
The results confirm the expectations for the core retention decision process. Retention is positively affected by flat-rate usage and usage of the pay-per-use service (α2 = .728, p < .001 and α3 = .039, p < .001, respectively). Usage drives retention because, to the consumer, it is an indication of the personal value of the service (e.g., Lemon, White, and Winer 2002). The impact of both direct marketing (α4 = 1.565, p < .001) and advertising (α5 = .310, p < .001) on retention is positive, which is consistent with previous findings that marketing communication creates interest in the service and increases retention (e.g., Polo, Sese, and Verhoef 2011). The significant coefficients of the copula and Mundlak terms suggest that correcting for marketing endogeneity is indeed required (α15 = -.596, p < .001; α16 = -.017, p < .001; α17 = −2.111, p < .001).
Differences between free-trial and regular customers
In support of H1, acquisition through free trials has a direct negative impact on retention (α1 = -.278, p < .001), even after controlling for higher churn during the free-trial period. 11 This finding is in line with the expectation that free-trial customers are less confident about retaining the service because they are in a tentative relationship with the firm and are likely to attribute their subscription to extrinsic incentives (i.e., the trial), resulting in lower commitment (Dwyer, Schurr, and Oh 1987).
Because free-trial customers may be particularly likely to churn in their first three months, we reestimate the model only with customers who “survived” the first three months. The results are robust to this alternative specification (α1 = -.040, z = −3.390, p < .001).
The positive interaction between the free-trial dummy and usage variables indicates that the usage effects are stronger for free-trial than for regular customers, which confirms H2a and H2b, (flat-rate service: α6 = .040, p < .001; pay-per-use service: α7 = .013, p < .001). This finding is in line with the notion that free-trial customers, because of their lower commitment, are more uncertain about the service's benefits and therefore rely more on their usage behavior when making retention decisions (Bolton and Lemon 1999).
In support of H3a and H3b, free-trial customers are more responsive to marketing communication instruments than regular customers (direct marketing: α8 = .133, p < .001; advertising: α9 = .154, p < .001). Similar to usage, advertising and direct marketing provide free-trial customers with cues that make them more secure about the service's value and assist them in their retention decision (Mitchell and Olson 1981). 12
We test whether the marketing response estimates are affected by the inclusion of customers who churned during the first months after acquisition. Excluding these customers yields comparable results (α8 = .046, z = 2.30, p < .05; α9 = .08, z = 5.11, p < .001; both one-tailed).
Free-trial customers use the flat-rate service less intensively than regular customers (β1 = -.269, p < .001). This finding is in line with the notion that free-trial customers are less committed to the service's benefits. Notably, however, they use the pay-per-use service more intensively than regular customers (γ1 = .113, p < .001). Because free-trial customers make less use of the flat-rate service, they may dedicate more time to exploring the paid add-on service (Schary 1971). In addition, they may perceive the free trial as a windfall gain, enticing them to spend more on the pay-peruse service (e.g., Heilman, Nakamoto, and Rao 2002).
Figure 2 shows plots of the average predicted and observed values for retention (Panel A), flat-rate usage (Panel B), and usage of the pay-per-use service (Panel C). The plots show that the model fits the retention and usage data well for both free-trial and regular customers. In Panel A, the predicted retention rates after the trial look very similar for free-trial and regular customers. However, the model reveals that these predicted retention rates are obtained very differently for these two customer groups. For free-trial customers, the baseline retention rate is lower because the main effect of Triali on retention utility is -.278. However, this lower baseline rate is compensated by free-trial customers’ stronger marketing responsiveness (see Table 5) and by the higher levels of direct marketing they received (see Table 2).
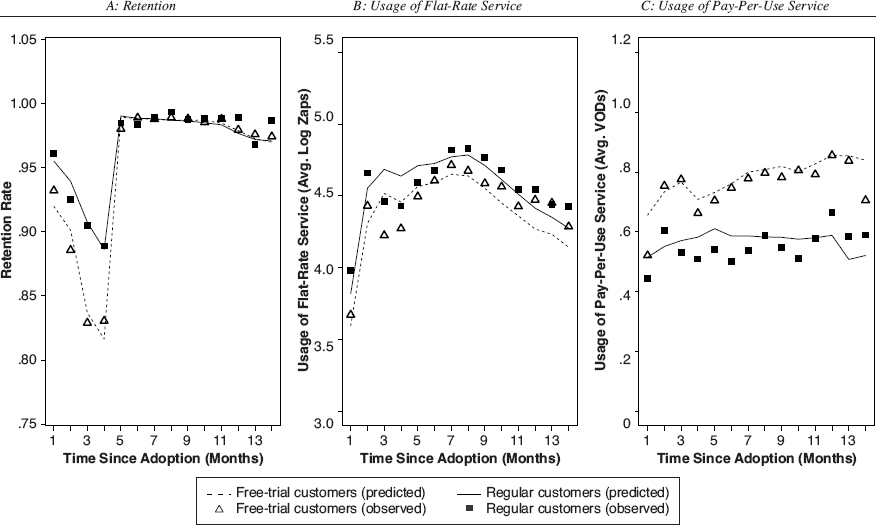
Model Fit
Control variables
The control variables have significant and face-valid effects. Television usage drops in warmer months for obvious reasons, and the VOD credit increases usage of the VOD service. In addition, we find positive carryover effects for both usage components (e.g., Bolton and Lemon 1999). 13 Higher subscription fees reduce a customer's probability to retain and use the service (e.g., higher fees reduce customers’ budgets and, as a result, decrease their paid VOD consumption). The concomitant consumer characteristics also play a significant role. For example, all else equal, larger families are likely to use the service more intensively (both the flat-rate service and pay-per-use component). Finally, the table in Web Appendix C indicates that there are significant correlations between the random intercepts of the retention and usage equations.
The carryover coefficients for the two usage components are not directly comparable because we use a log-log regression for flat-rate usage and a zero-inflated Poisson model for the pay-per-use service. Nonetheless, the relative magnitude of the coefficients suggests that the flat-rate service is characterized by higher state dependence than the pay-per-use service. This finding is consistent with the idea that consumers are accustomed to watching the same television shows or series (flat-rate usage) but irregularly consume unrelated content from the VOD service (pay per use).
Implications for CLV and CE
To examine how the estimated effects influence CLV, we compare the CLV of free-trial and regular customers and compute the elasticities of CLV with respect to changes in marketing communication efforts and customers’ usage intensities. Throughout the calculations, we use customer-specific posterior parameter distributions (Train 2009).
For maximum comparability between free-trial and regular customers, we use the same global means for the marketing variables. Furthermore, to avoid comparing the behavior of (relatively tentative) free-trial customers in their first three months with (relatively confident) regular customers, we only analyze those customers who survived the first three months, retaining 8,624 free-trial customers and 3,145 regular customers. In addition, in the simulations, we shock marketing or usage in the first month after the trial period (i.e., in month 4 of a customer's tenure). Next, we explain how we derive CLV from customers’ retention and usage behavior.
Calculating Net CLV
We simulate customers’ usage and retention behavior over a three-year time horizon. Previous research on other high-tech products and services has used the same simulation horizon, arguing that most of a customer's value is typically captured during these first three years (Kumar et al. 2008; Rust, Kumar, and Venkatesan 2011). We compute net CLV as the total revenue stemming from a customer's consecutive retention and usage decisions minus the costs to acquire and retain that customer. For a given month, revenue consists of the fixed subscription fee and the pay-per-use fees for watching VODs (corrected for content costs) if the customer retains the iTV service, or the early-termination fee if the customer disadopts. On the cost side, we distinguish direct-marketing and advertising expenditures to acquire and retain the customer. Other costs are not directly related to the number of customers or their usage intensity (e.g., the network infrastructure is owned by the company) and can thus be ignored in the computation of net CLV. To compute the present value of future cash flows, we use an annual discount rate of 8.5%, which is common in this industry (e.g., Cusick et al. 2014). 14 Web Appendix D provides the equations for the net CLV calculations.
The relative results remain the same when we vary the simulation horizon or discount rate.
Survival times
As a first step toward calculating net CLV, we investigate customers’ expected survival times during the three-year simulation period. Figure 3 shows that free-trial customers churn much earlier than regular customers. The survival times are also characterized by considerable consumer heterogeneity, especially for free-trial customers. Thus, we can expect substantial differences in net CLV between and within the two customer groups.

Distribution Of Expected Survival Times For Free-Trial And Regular Customers
Net CLV for free-trial and regular customers
Figure 4 presents the net CLV results. Panel A presents average revenues, average costs, and the resulting CLV for both groups. The major part of revenues comes from subscription fees. The pay-per-use service accounts for 13% (€36.82) of the total revenues from free-trial customers and 10% (€41.25) of the total revenues from regular customers. Regular customers, who cannot cancel the service for free during a trial period, pay a higher expected cancellation fee than free-trial customers (respectively, € 16.19 vs. €7.11). The costs for acquisition (€ 170.29 for free-trial and € 169.89 for regular customers) and retention (€ 10.79 for free-trial and € 14.01 for regular customers) are comparable. After taking into account all revenues and costs, the resulting net CLV is, on average, 59% lower for free-trial customers than for regular customers (respectively, € 101.25 vs. €244.62).

Net Clv For Free-Trial And Regular Customers
Figure 4, Panel B, shows that there is also considerable heterogeneity in net CLV within the free-trial and regular customer groups. Although free-trial customers, on average, have a lower net CLV, several of them generate a relatively high value, which becomes clear from the substantial overlap between the two distributions.
Marketing communication and usage elasticities
The parameter estimates suggest that free-trial customers are significantly more responsive to changes in marketing communication and usage levels than regular customers. To quantify whether these differences are also managerially relevant, we calculate elasticities of net CLV with respect to marketing communication and usage. We find these elasticities to be substantially higher for free-trial customers than for regular customers. As we show in Figure 5, Panels A and B, the average advertising and direct-marketing elasticities of free-trial customers are .26 and .41, respectively. For regular customers, however, we find average elasticities of only .02 and .08, respectively. 15

Responsiveness To Marketing Communication
We compute customer-specific arc elasticity on the basis of a 1% increase in the focal variable in the first period after the expiry of the free trial and apply a 95% Winsorization on estimated net CLV elasticities to ensure that the summary statistics are not driven by outliers (Luo, Raithel, and Wiles 2013). Differences in elasticities between free-trial and regular customers are higher than what perhaps could be expected on the basis of the estimated coefficients (e.g., .310 for regular customers and .310 + .154 for free-trial customers, in the case of advertising). However, due to differences in the net CLV base levels between the two customer groups, the same absolute lift in net CLV represents a much higher percentage lift for a free-trial customer than for a regular customer.
In a similar vein, we assess the extent to which net CLV changes in response to an increase in usage (see Figure 5, Panels C and D). For example, the iTV company could enhance usage by offering access to more channels (flat-rate service) or extending their VOD catalog (pay-per-use service). We find that the average flat-rate usage elasticity equals .75 for free-trial customers but only .17 for regular customers. Likewise, the average pay-per-use elasticity is .04 for free-trial customers yet only .02 for regular customers.
Should a Company Offer Free Trials?
A major finding of this research is that the expected value of customers attracted with free trials is less than the expected value of regular customers (E(CLVfree trial) = € 101.25 vs. E(CLVregular) = €244.62). Consequently, managers may wonder whether offering free trials is worth the effort. For a free trial to be beneficial, it should attract enough lower-value customers to at least keep the aggregated CLV, or CE, constant. But how many customers does the free trial need to attract?
To determine the necessary number of additional customers, we can use the results of the CLV calculations. According to the estimates, the 8,624 free-trial customers who survive the free-trial period generate a total expected CE of €873,180 (8,624 x E(CLVfree trial)). To generate the same equity without the free trial, the firm would have had to attract only 3,570 regular customers because 3,570 x E(CLVregular) = 8,624 x E(CLVfree trial) = €873,180. Thus, offering consumers a free trial rather than a regular contract should lead to κ = 8,624/3,570 = E(CLVregular)/E(CLVfree trial) = 2.42 times more customers to keep CE constant. If firm managers believe a free trial is able to attract more new customers than this threshold, we recommend offering the free trial rather than the regular contract because the expected expansion of the customer base will compensate for the customers’ lower CLVs; otherwise, the company should not offer the trial.
Importantly, κ is not a fixed number but depends, to some extent, on the company's marketing efforts. Specifically, the company can lower the threshold by increasing its marketing efforts after acquisition, making it easier for the free trial to break even in terms of CE. Indeed, the results indicate that higher marketing efforts lead to a smaller difference between E(CLVfree trial) and E(CLVregular) such that the threshold κ = E(CLVregular)/E(CLVfree trial) decreases. We illustrate this principle in Figure 6. For example, for direct-marketing (vs. advertising) efforts 20% above the observed average, κ drops from 2.42 to 2.26 (vs. 2.36). Thus, with increased direct-marketing (advertising) expenditures, it suffices if the trial is only 2.26 (2.36) times more successful at attracting customers than the regular offer. These insights help companies trade off acquisition and retention efforts (e.g., Reinartz, Thomas, and Kumar 2005). For example, a company may decide to boost retention expenditures when a trial's acquisition targets are not met. Conversely, a well-designed free-trial promotion may lead to a higher-than-expected increase in customers, which may justify lower retention efforts afterward.

Required Impact Of Free Trials On Customer Base Expansion For Different Levels Of Marketing
Improving Retention and CE after Acquisition
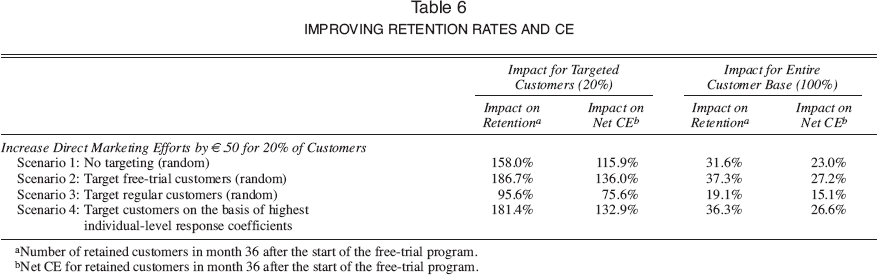
When a company has acquired customers with free trials and regular subscriptions, a key managerial question is how to improve consumers’ retention behavior and CE. Because free-trial customers are worth less than regular customers, some managers may decide to invest less in free-trial customers. However, their higher responsiveness to marketing communication actually suggests that this is not the best strategy. Therefore, we recommend that managers pay specific attention to free-trial customers. To illustrate this recommendation, we simulate the impact on retention and CE of alternative targeting strategies after customer acquisition (see Table 6).
Improving Retention Rates And Ce
Number of retained customers in month 36 after the start of the free-trial program.
Net CE for retained customers in month 36 after the start of the free-trial program.
Suppose a manager has an additional monthly direct-marketing budget that enables her to increase direct-marketing efforts by €.50 per customer for 20% of the customers. Given the company's total customer base of 160,000 customers at the end of the observation period, this corresponds to a substantial marketing investment of approximately €576,000 (160,000 × 20% x € .50 × 36 months). The question then becomes how to select the 20% target customers. Using the customers in the simulation data set, we consider different scenarios. In scenario 1, the manager simply selects customers from the company's database at random, yielding an increase in retention (158.0%) and net CE (115.9%) for the 20% targeted customers. The impact across the entire customer base is also substantial: 31.6% for retention, 23.0% for net CE.
Alternatively, bearing in mind our finding that acquisition mode influences customers’ response to marketing communication, a manager could follow scenario 2 and target a random subset of free-trial customers. Such a strategy would improve retention and net CE of the selected customers even more (186.7% for retention and 136.0% for net CE). These returns stand in sharp contrast to scenario 3, in which the manager invests only in a random selection of regular customers, leading to an increase of 95.6% for retention and 75.6% for net CE. Finally, a manager could opt for scenario 4, in which individual-level response coefficients are used to select customers with the highest responsiveness to direct marketing. This optimal strategy would improve retention and net CLV, respectively, by 181.4% and 132.9% for targeted customers and 36.3% and 26.6% for all customers. Note that targeting free-trial customers (scenario 2) leads to results that come close to the results for the selection based on responsiveness to direct marketing (scenario 4).
Discussion
Recent research has suggested that the way in which customers are acquired may have an enduring impact on their behavior, even long after adoption (e.g., Villanueva, Yoo, and Hanssens 2008). Whereas some studies have found differences between customers attracted with sales promotions and regular customers (Anderson and Simester 2004; Lewis 2006), the challenge of retaining customers acquired through free-trial promotions is not well understood. Crucial questions have remained unanswered: How do free-trial customers differ from regular customers in their retention rates, marketing responsiveness, and CLVs? Should free-trial customers be managed differently?
To answer these questions, we model a customer's decisions to use and retain the service—decisions that influence CLV — and examine how free-trial acquisition affects this decision process. We explicitly account for selection effects (i.e., customers attracted with free trials may differ intrinsically from other customers) and the endogeneity of marketing communication. We estimate the model on a unique panel data set, covering monthly usage (of flat-rate and pay-per-use services) and retention decisions for 16,512 customers of an interactive digital television service provider. We then use the parameter estimates to simulate CLV and quantify its sensitivity to changes in marketing communication and usage rates.
Throughout the analyses, we find strong evidence for systematic differences in behavior between free-trial and regular customers. In line with buyer-seller relationship theory, which suggests that free trials may decelerate the relationship formation process, free-trial promotions are associated with higher defection rates, even beyond the free-trial period. Similarly, flat-rate usage —an important driver of customers’ retention decisions — turns out to be lower among free-trial subscribers. Notably, however, free-trial customers have a higher pay-per-use consumption rate. Apparently, they readily reallocate the time they gain (due to their lower flat-rate consumption) and the money they save (due to the free trial) to the pay-per-use service. These results add to the growing understanding of the role of usage in the value generation process (e.g., Bolton and Lemon 1999; Iyengar et al. 2011).
Managerial Implications
Our study has several key managerial implications. Because of their higher churn rate, free-trial customers are worth considerably less than regular customers. Specifically, we find the net CLV of free-trial customers to be 59% lower than that of regular customers. Managers and business analysts may thus need to temper profit expectations if the customer base includes a substantial share of free-trial subscribers. At the same time, we find free-trial customers to be more “malleable” than regular customers. Because they have a less developed relationship with the firm, free-trial customers are more uncertain about the service benefits. As a result, they rely more on marketing communication and their own usage behavior when deciding whether to retain the service. We find that, compared with regular customers, the net CLV of free-trial customers is much more responsive to direct marketing, advertising, flat-rate usage, and pay-per-use usage.
Therefore, companies should target direct marketing and advertising more to free-trial than to regular customers. In these marketing communications, firms are advised to remind free-trial customers about their usage rates, especially when they are high, to make these customers even more likely to retain the service. For example, mobile phone providers could use direct marketing to communicate the number of minutes the customer has used the flat-rate service in the previous period, cementing the relevance of the service. Companies could also enhance actual usage of the service. For example, in the context of digital television, firms could enhance usage opportunities by offering recorded shows or providing apps to watch television on mobile devices.
Other service providers can estimate our retention and usage models to calculate the expected CLV for every customer, whether acquired by a free trial or not. They can then focus their marketing efforts on those customers with the highest expected return on marketing investment. If the estimation of the models is not feasible, our results suggest that managers can rely on usage intensity as an indicator of customer value and a criterion for marketing allocation decisions. This enables managers to distinguish (likely) high-and low-value customers, especially within the free-trial group, because this group is most responsive to usage levels.
Our analysis also offers insights on the factors that play a role when firms consider the launch of a free-trial campaign. We show how the company can obtain an indication of the free trial's required expansion effect on the customer base to compensate for free-trial customers’ lower CLV and thus make the free-trial campaign worthwhile. Specifically, relative to a situation with only the regular offer, the number of adopters should increase by a factor that can be calculated as the expected CLV of regular customers divided by the expected CLV of free-trial customers. If the company expects the free trial to attract more customers than this factor prescribes, the trial offer may be a viable strategy. Importantly, the company can lower this break-even factor through targeted retention efforts after acquisition.
Further Research
Our work is the first to investigate the effects of free-trial acquisition on customer behavior and CLV and therefore leaves several opportunities for further research. First, because this study is based on observational data, we need to control for selection effects—a challenge intrinsic to many studies examining the behavior of distinct customer groups (e.g., Gensler, Leeflang, and Skiera 2012). Alternatively, researchers may use controlled field experiments. One setting particularly suited for field experiments is online services, in which individual consumers can be randomly assigned to different offers, and the likelihood of consumers becoming aware of alternative offers is limited. At the same time, such an approach would still not guarantee full comparability of free-trial and regular customers because the researcher cannot force consumers to accept an offer.
Second, controlled experiments would also allow for the uncovering of the underlying psychological processes that are likely to play a role. One notable observation worthy of further attention is that free-trial customers are more heterogeneous than regular customers—for example, in terms of CLV and responsiveness to marketing and usage. We speculate that the segment of free-trial customers includes not only people who are truly doubtful about their commitment but also opportunistic consumers who would have adopted the service anyway and only subscribe to the trial to enjoy the free months. Future studies could further investigate the heterogeneity in the motivations of free-trial and regular consumers.
Third, further research could replicate this research in other contexts. Many Internet companies currently operate under a “freemium” model, in which customers can choose between a free service and a premium service that comes at a fee but provides enhanced functionality (Pauwels and Weiss 2008). For example, the on-demand streaming service Spotify offers temporary one-month free trials for its premium service in addition to its (permanently) free service.
Fourth, further research could give a more complete account of the profitability implications of free-trial and regular acquisition. For example, for a news site, usage may be a source of advertising revenues (e.g., the number of page views may determine advertising income). Furthermore, it might be worthwhile to also include other value-creating behaviors (Verhoef, Reinartz, and Krafft 2010). Notably, scholars could examine whether free-trial and regular customers differ in the extent to which they engage in word-of-mouth communication.
In summary, we uncover the implications of free-trial acquisition for customer retention and CLV. We show how service usage and marketing activities drive consumers’ retention decisions and CLVs and how free-trial acquisition moderates these relationships. Our findings offer managers new insights on how to retain customers acquired through free trials.
References
Supplementary Material
Please find the following supplemental material available below.
For Open Access articles published under a Creative Commons License, all supplemental material carries the same license as the article it is associated with.
For non-Open Access articles published, all supplemental material carries a non-exclusive license, and permission requests for re-use of supplemental material or any part of supplemental material shall be sent directly to the copyright owner as specified in the copyright notice associated with the article.