
Abstract
During retailer-initiated price wars (PWs), hundreds of brands are involved simultaneously, affecting brands’ and retailers’ positioning and ultimately making the performance outcome for individual brands difficult to predict. Likewise, the impact on brand performance after the PW, when prices are restored, is unclear. The authors use a natural-experiment approach to track brand sales and shares before, during, and after a long-lasting supermarket PW in the Dutch grocery market. They find that PWs are not truly revenue, sales, or share generators for most brands unless prices remain reduced permanently by the retailer. Only after the PW, when rivals’ prices are restored and the focal brand's reduced retail price is maintained, can substantial sales, revenues, and share gains be realized. Moreover, restoring prices without additional price promotion support can severely damage brands’ performance. Overall, national brands can gain share, sales, and revenue, but at the cost of not restoring regular prices, while private labels can benefit even when prices are restored after the PW ends.
In an effort to drive traffic, grocery retailers often initiate price wars (PWs) on national brands (NBs) (Heil and Helsen 2001). In general, supermarket PWs entail sustained reductions of regular prices 1 of hundreds of brands across categories and retailers, affecting several brand competitors within the same category. For example, in 2010, Wal-Mart started a “soda war” by reducing the preferred manufacturer price from $6 to $5 for a case of Coca-Cola, Pepsi, and other top brands, forcing grocery competitors to follow suit (Tuttle 2010). These reductions turned out to be beneficial for the involved brands; demand was so strong that suppliers could barely keep up. In the United Kingdom, Tesco, Sainsbury's, and Asda slashed prices storewide on thousands of items, again involving many brands (Grierson 2011). A Tesco executive noted that manufacturers should welcome these retailer-initiated cuts because they have the potential to boost brand volume at those retailers (Hegarty 2011). Still, in Australia, a PW between the two largest players in the market, Woolworth and Coles, reportedly has taken its toll on both local and international manufacturers, including Heinz and Unilever. Heinz even reported a sales drop of 13% in 2011 and proclaimed Australia to be its worst market (Maxwell 2011). Because of the mixed outcomes of PWs, brand manufacturers often feel trapped by retailers engaging in PWs and even try to avoid getting (further) involved. For example, in the Dutch PW that is the topic of the current research (see Van Heerde, Gijsbrechts, and Pauwels 2008), Campina, the market leader in most dairy categories, increased its wholesale prices in the hope of staying out of the PW (Van Aalst et al. 2005).
So far, no systematic evidence exists on how supermarket PWs alter the performance of brands trapped in these wars. Extant literature on PWs (e.g., Van Heerde, Gijsbrechts, and Pauwels 2008) has mainly focused on the outcomes for the initiators of the PW, which, in a grocery setting, means supermarket retailers. In this study, we shift the focus to the third parties involved in PWs—that is, the brands whose prices are used to fight the supermarket PW. On the one hand, brands can be beneficiaries of PWs because absolute price reductions stimulate demand at the retailers involved in those wars. If brands indeed thrive during PWs (as retailers claim), suppliers may be willing to embrace PWs. On the other hand, these volume boosts do not always materialize. Because a retailer reduces prices not for individual brands in a category but rather sometimes for a full set of direct competitors, relative prices could remain fairly stable, and absolute price reductions may not lead to the expected volume sales boost, thus resulting in lower revenue sales at that retailer. In summary, because the competitive position of individual brands may not improve, the outcome of PWs for individual brands 2 is difficult to predict.
Moreover, during PWs, supermarkets do not directly involve all brands in a category immediately or simultaneously. Usually, retailers announce storewide sustained price cuts for a substantial, though not fully exhaustive, set of brands in different categories. For example, in the Dutch PW, Albert Heijn, the market leader and initiator of the PW, did not begin reducing the price of some category leaders (e.g., Lay's chips, Heinz ketchup) until more than a year after the start of the PW. Thus, even when a brand's absolute price remains untouched, its relative price positioning within the category and store may deteriorate. In this article, we refer to a PW price drop (PW_PDrop) or a PW price constant (PW_PCst) setting, depending on whether the retailer decreased a brand's price and thus used the brand to fight the PW. Although a brand's absolute price level does not change in a PW_PCst setting, its relative price positioning is still affected. To correctly assess the impact of PWs, we acknowledge these differences between PW_PDrop and PW_PCst scenarios.
To complicate matters further, when PWs end, retailers are tempted to reverse the price cuts they initially announced as “permanent” during the PW. However, even less is known about brand performance when the PW ends, and thus retailers need to be cautious. For example, although Wal-Mart's soda war price cuts were beneficial initially, retailers realized that the ongoing cuts could undermine their efforts to restore prices over time (Tuttle 2010). Thus, can brand prices be reestablished easily to their pre-PW levels without negatively affecting performance? Previous research on temporary deal retraction (e.g., Kahn and Louie 1990; Wathieu, Muthukrishnan, and Bronnenberg 2004) suggests that when prices are restored, market shares can fall below their initial levels. To provide a complete picture of PW consequences, we examine the implications of brands’ involvement after the PW, when the retailer decides to increase brand prices again, a scenario we label the post-PW price lift setting (post-PW_PLift). We contrast this with a setting in which the retailer maintains prices at the PW level after the PW, a setting we refer to as the post-PW price constant scenario (post-PW_PCst).
In doing so, we also shed more light on which types of brands stand to lose or win more share, sales, and revenues at retailers involved in PWs. Previous work (e.g., Gupta and Cooper 1992) has demonstrated that consumers tend to amplify or discount (temporary) price changes depending on several brand- and retailer-related contextual cues. These effects may also occur when dealing with more sustained price changes, as in a PW setting. More specifically, the brand's ownership (NBs vs. private labels [PLs]) and positioning, its promotion and communication efforts, and the retailer's positioning can all interfere with the impact of PW involvement. Combined, insights into these moderating effects may afford deeper understanding of (1) what type of brands may stand to gain or lose more from involvement in a PW and (2) how brands can avoid potential downsides of retailer-initiated PWs.
In summary, this article aims to contribute to the existing literature by (1) investigating the impact of retailer-initiated PWs on brand performance; (2) distinguishing between brands whose prices are kept constant, decreased, and increased; (3) capturing the evolution of brand performance before, during, and after a PW; and (4) controlling for the moderating impact of brands’ and retailers’ positioning and actions. To illustrate the different PW scenarios, we turn to the soft drink category at a Dutch retailer during the PW between 2003 and 2005 (see Figure 1).

Overview of PW Scenarios
At the start of the PW, the retailer immediately reduced the price of both the leading NB (NB1) and its PL, leaving the price of the second NB (NB2) untouched. Thus, the PL and NB1 entered the PW_PDrop setting immediately, while NB2 remained in a PW_PCst scenario until the retailer reduced its price as well. During this PW_PCst scenario, NB2 faced a new, less favorable pricing position than NB1, and the price gap relative to the PL increased. When the PW ended, the retailer increased NB1's price and left the price of NB2 and the PL untouched. This move signaled the end of the PW in the category, and NB1 entered the post-PW_PLift setting, while NB2 and the PL entered the post-PW_PCst scenario. Finally, NB2 and the PL stayed in this post-PW_PCst stage until the retailer increased their prices as well. While the prices of the PL and NB2 stayed below their pre-PW level, NB1's price surpassed this level.
To examine the impact of these PW settings, we use a natural-experiment approach, in which we track brands before, during, and after a long-lasting supermarket PW. More specifically, we assess the performance of 162 brands in 25 categories at 5 national retailers in the Netherlands between 2002 and 2007. In this time span, a major PW started and ended.
Literature Review and Conceptual Framework
PW Literature
Extant literature has defined the PW phenomenon, examined its antecedents, and focused on the performance consequences for direct participants. Heil and Helsen (2001) were among the first to outline the criteria for ongoing competitive price interactions to qualify as PW behavior. 3 Furthermore, the PW literature provides insights into three main antecedents of PWs: (1) economic downturns (e.g., Green and Porter 1984) and expansions (e.g., Rotemberg and Saloner 1986), (2) competitive entry (e.g., Elzinga and Mills 1999; Milgrom and Roberts 1982), and (3) financial (e.g., Busse 2002) and market share (Griffith and Rust 1997; Leeflang and Wittink 1996) conditions. However, although the consequences for the initiators of PWs have been explored, the insights are often inconclusive: Some studies emphasize potential revenue losses (Brandenburger and Nalebuff 1996), while others identify conditions when participants may gain (Busse 2002; Elzinga and Mills 1999).
To the best of our knowledge, the only marketing study, other than Heil and Helsen's (2001), to investigate the consequences of PWs is that by Van Heerde, Gijsbrechts, and Pauwels (2008). The authors find that during supermarket PWs, price awareness and price sensitivity increase, and price becomes a more important purchase criterion driving consumers’ decisions of what and where to buy. They also provide evidence that as consumer basket sizes increase, retailers may still gain from a PW, though not every retailer stands to win or lose equally. The resulting increased price sensitivity mainly benefits traditional price fighters, while it harms more conventional retailers. Indeed, when price fighters participate in PWs, the boundaries of the options available to consumers along the price dimension may expand downward. In the eyes of consumers, these price fighters may become even cheaper than their competitors, and thus the perceived expensiveness of the traditional supermarkets may increase (see Cunha and Shulman 2011). Regular supermarkets that try to mimic price fighters with sustained price cuts may end up as suboptimal options, or decoys, further reinforcing the price fighters’ dominant position (Huber, Payne, and Puto 1982). In summary, the PW literature has (1) mainly focused on the causes leading to a PW, only partially covering consequences; (2) taken the point of view of the initiators, which in the case of supermarket PWs are retailers, not individual brands; and (3) identified moderating effects of price positioning (i.e., price fighters are the PW winners). Translating these insights to our third-party brand setting suggests that economy-priced brands could gain more from PWs.
Price Promotion Literature
The vast literature on price promotions has extensively detailed how temporary price cuts affect brand performance (for an overview, see Neslin and Van Heerde 2009). In this study, we borrow from this body of work to infer how consumers subjectively encode or interpret sustained price changes accompanying the different PW scenarios (Gupta and Cooper 1992; Winer 1986). Consumers evaluate and encode price information, and it is their perceptions of the information, not the information itself, that affect their behavior (Mazumdar, Raj, and Sinha 2005). In general, consumers’ perceptions of price are dependent not only on the actual price but also on their adaptation level of what that price should be (Monroe 1973). As such, consumers can either discount or amplify price reductions or increases (Gupta and Cooper 1992; Pauwels, Srinivasan, and Franses 2007). Price reductions or consumer gains may be discounted because consumers do not fully regard the new price as much lower than the benchmark and adjust the gain to more reasonable levels. By the same token, price increases or consumer losses may also be discounted because consumers try to rationalize buying products at a higher price. In contrast, both price reductions and increases can be encoded as more substantial than what is objectively true (Berkowitz and Walton 1980). The extent to which these discounting or amplification processes occur depends on the context in which consumers evaluate price changes (Thaler 1985). Research has identified the relative price positioning of both brands and retailers as major factors (e.g., Gupta and Cooper 1992; Mazumdar, Raj, and Sinha 2005).
Indeed, a substantial body of work has demonstrated that premium-priced brands stand to gain more from price discounts than economy-priced brands (e.g., Allenby and Rossi 1991; Bronnenberg and Wathieu 1996). In general, temporary price discounts by premium players (brands and/or retailers) that do not typically compete on price may be perceived as more substantial and important, subsequently influencing consumers’ purchase decisions (Wathieu, Muthukrishnan, and Bronnenberg 2004). Although previous research has focused considerably less on the effects of the subsequent price increases following price discounts (for notable exceptions, see Kahn and Louie 1990; Wathieu, Muthukrishnan, and Bronnenberg 2004), we can apply a similar reasoning to price increases, suggesting that price increases by premium players may also appear more substantial, as the initial price cut preceding the increase was more salient from the beginning (Wathieu, Muthukrishnan, and Bronnenberg 2004). Yet Campbell (1999) posits that brand reputation also comes into play, such that brands that rely on a higher reputation suffer less from the negative consequences of price increases. The question remains, however, of how these effects play out in contexts in which several price moves occur simultaneously (as is the case with PWs) rather than sequentially (as is the case in price promotion settings) (Kahn and Louie 1990). In summary, the price promotion literature has (1) assessed the impact of temporary price cuts extensively, but focused less on the subsequent effects of price increases; (2) suggested that price cuts are amplified or discounted depending on the positioning and reputation of the players; and (3) demonstrated that premium-priced players win when prices are cut. Translating these insights to our context of sustained price cuts suggests that premium-priced brands stand to gain the most during PWs but stand to lose more when PWs end.
Building on both the PW and price promotion literature, we conclude that the effects of PWs and post-PWs are conditional on the positioning of the brands included in the PW. Yet whereas the PW literature has suggested that economy-priced brands stand to gain most, the price promotion literature has declared premium-priced players the winners. In this article, we first reflect on the main effects of the different PW settings and then elaborate on the moderating impact of brand positioning and actions.
Impact of PW Scenarios on Brand Performance of Retailers Involved in the PW
As explained previously, we distinguish four PW scenarios: a PW_PDrop, a PW_PCst, a post-PW_PLift, and a post-PW_PCst setting. In the PW_PDrop and post-PW_PCst settings, a brand's absolute or relative price decreases, whereas in the PW_PCst and post-PW_PLift scenarios, the absolute or relative price increases. Basic economic reasoning predicts that absolute price changes result in demand changes. This may occur even more so in the PW context, in which the importance of price is amplified as price awareness and sensitivity increase (Van Heerde, Gijsbrechts, and Pauwels 2008). Moreover, even when a brand's absolute price is not altered, the brand's relative price positioning may change because willingness to pay often depends on the prices of rival products and brands (Reibstein and Wittink 2005). As such, we propose that when retailers reduce the regular prices of brands in a PW_PDrop setting, demand increases. However, demand may decrease when a brand is part of a PW_PCst setting because the retailer does not lower the focal brand's price while some of the rival brands’ prices are reduced. Although the absolute price level does not change, the focal brand's relative price deteriorates, which could lead consumers to switch from the focal brand. Post-PW_PLift settings entail absolute price increases, which should decrease demand for the brands involved in the direct post-PW. Still, in a post-PW_PCst scenario, the regular price is not (yet) restored, while rivals’ prices are increased, and thus a brand's relative price positioning improves. This case can result in brand switching in favor of the focal brand.
Moderating Role of Relative Brand Positioning
Relative brand price
Because price reductions for more expensive brands are more salient and bring the focal brand within reach of more budget-conscious consumers, enabling them to enjoy benefits they otherwise would not (e.g., Bronnenberg and Wathieu 1996; Chandon, Wansink, and Laurent 2000), the perceived gains in PW_PDrop and post-PW_PCst settings may be amplified. Still, when economy-priced brands are involved in PW_PDrop or post-PW_PCst scenarios, the range of prices available to consumers may be extended downward, making other brands appear relatively more “expensive” (Cunha and Shulman 2011), which suggests that price reductions will be discounted more for relatively more expensive brands. When prices are increased, however, consumers experience potential losses. These losses may also appear more substantial for premium brands because they were more salient from the beginning. Moreover, increasing the price of premium-priced brands may extend the price range upward, making rivals appear “cheaper” (Cunha and Shulman 2011). Therefore, premium-priced brands may stand to lose more when involved in post-PW_PLift and PW_PCst settings.
Brand ownership
Brand name is another important contextual cue that affects the impact of PW scenarios (Gupta and Cooper 1992). Because PLs typically rely less on a loyal consumer base (Sethuraman and Raju 2012) and PL prices are more difficult to compare across retailers (Vanhuele and Drèze 2002), consumers may have poorer price knowledge about PLs. Consequently, PL price moves are less salient, and the effect of PW_PDrop and post-PW_PCst scenarios may be noticed less. Still, because PLs are mostly perceived as price fighters, their downward price moves may turn all rivals relatively more expensive, thus implying that PLs stand to gain from PW_PDrop and post-PW_PCst settings. Price increases, however, may be less salient and do not extend the range of available price options. Therefore, PLs may be affected less negatively in post-PW_PLift and PW_PCst scenarios than NBs.
Moderating Role of Retailer Positioning
The perceived gains and losses attributed to a brand's price changes may vary by store (Berkowitz and Walton 1980), depending on the overall relative price position of the store (across a full basket of goods). Price reductions in premium-priced stores may be more salient and believable because consumers’ perceived value of price reductions may be higher when encountered in a store that does not consistently make price claims. Price reductions in discount-oriented store environments may therefore go less noticed (Gupta and Cooper 1992). Yet when price fighters engage in PW activities, rival “regular” retailers may appear disproportionally expensive, and their price cuts may be viewed as unsuccessful attempts to mimic the price fighters. Thus, engaging in PW_PDrop and post-PW_PCst settings may be less successful at premium-priced retailers (Van Heerde, Gijsbrechts, and Pauwels 2008), reducing the positive effects for brands sold there. In addition, when premium-priced retailers increase prices, such increases are further amplified because they extend the range of available price options, and rivals may seem less expensive. The negative effects of post-PW_PLift and PW_PCst settings are thus reinforced at premium-priced retailers.
Moderating Role of Marketing-Mix Actions
Feature and price promotions
These types of promotions lower consumers’ expected price levels (Alba et al. 1999; Kalwani and Yim 1992). As such, the reduced regular prices in PW_PDrop and post-PW_PCst settings may be less salient. Moreover, the effectiveness of sustained low price claims in PW_PDrop scenarios may be further weakened when products are offered on promotion because consumers may be waiting for even better deals (Mela, Gupta, and Lehmann 1997). Thus, the perceived gains following PW_PDrop and post-PW_PCst scenarios may be discounted when a brand is on promotion. In contrast, when prices are increased, price promotions and features feed a(n incorrect) lower perception of the regular price, thus reducing potential losses linked to post-PW_PLift and PW_PCst settings.
Brand advertising
In general, (nonprice) brand-oriented advertising strengthens brand image, causes greater awareness, differentiates products, and builds brand equity (Keller 1993). Advertising signals product quality, leading to an increase in brand equity (Kirmani and Wright 1989). Because brand-oriented advertising may increase product differentiation, it can make price elasticities less negative (Mitra and Lynch 1995). Consequently, the perceived gains of PW_PDrop and post-PW_PCst settings may be less substantial, while the potential losses of post-PW_PLift and PW_PCst settings may be reduced as well.
Data
Natural-Experiment Setting
We investigate the nationwide supermarket PW that took place in the Netherlands between 2003 and late 2005 (see also Van Heerde, Gijsbrechts, and Pauwels 2008) 4 to assess the impact of PWs on brand performance. On October 20, 2003, Albert Heijn, the market leader, announced price reductions for more than 1,000 products, which immediately triggered the PW: the main competing retailers reacted within the same week, matching or even exceeding Albert Heijn's price reductions. Over time, prices were lowered in a series of waves, involving different product categories and brands (NBs and PLs) in every new round. In total, 16 rounds of price reductions were announced in the media. Most of these rounds were initiated by the market leader and involved between 250 and 2,000 NBs and PLs each time, with an average decrease of 11% of the NB price levels. On average, 8 weeks elapsed between two rounds, with a minimum of 1 week at the start of the PW and a maximum of 20 weeks during the last two rounds. The PW ended on October 31, 2005 (Van Heerde, Gijsbrechts, and Pauwels 2008), when Albert Heijn's competitors did not follow its last round of price reductions.
Sample
We use Dutch GfK Benelux household panel data, which feature advertising, volume share, and volume and value sales series for all brands in each retailer–category combination, to construct weekly regular and promotion retail prices. We obtained weekly brand advertising spending information from Nielsen. The data cover a span of 309 weeks, from January 2002 to January 2008. Thus, the analysis includes 93 weeks before the start and 113 weeks after the last round of the PW. As such, we can examine the market before, during, and after the PW (Ailawadi, Lehmann, and Neslin 2001). We restrict the analysis to five leading national supermarket retailers: Albert Heijn, C1000, Edah, Plus, and Super de Boer. The retailers vary in price positioning, service level, and extent of promotional activities, with Albert Heijn scoring high on both price and service, Super de Boer and Plus scoring average on price and assortment, C1000 having lower prices and good service, and Edah having lower prices and lower service. 5 We screened up to five leading brands within each of 25 categories. 6 The 25 categories represent some of the most frequently purchased categories in the Netherlands. However, the five brands were not consistently available on the retailer shelves in all category–retailer combinations in the observation window. In total, we track 324 brand–category–retailer combinations (corresponding to 162 unique brands); we used 97,036 observations in our estimations (i.e., 79 brands at Albert Heijn × 309 weeks + 81 brands at C1000 × 309 weeks +44 brands at Edah × 239 weeks + 47 brands at Plus × 309 weeks + 73 brands at Super de Boer × 309 weeks).
Operationalization
Performance variables
We capture brand performance by volume shares, volume sales, and value sales. The first two metrics enable us to test our predictions, and the latter provides the required input for our discussion on how PW scenarios affect the brand's revenue at the retailer level. We capture each brand's market share in a brand–category–retailer combination as the ratio of the sales volume of all stockkeeping units (SKUs) of that brand in a category c at a specific retailer r to the total category sales volume at that retailer. The pattern of shares indicates that shares level off when brands are involved in a PW_PCst setting (−1.8% change relative to pre-PW setting) and gain momentum when they enter PW_PDrop (share: +5.9%) and post-PW_PCst (share: +6.4%) settings. Overall, increasing prices in the post-PW_PLift scenario negatively affects shares only marginally (−1.5%). The effects of the different PW stages on volume and value sales are less clear-cut. Although the descriptives indicate the average impact of PW stages on brand performance, they do not allow us to separate the shifts related to PW involvement from those induced by price, promotion, or other fluctuations. Assessing the true impact of the PW beyond these confounding effects calls for a formal model estimation.
PW scenarios
We distinguish four PW scenarios: a PW_PDrop scenario, a PW_PCst scenario, a post-PW_PLift scenario, and a post-PW_PCst scenario. We compare these settings with the pre-PW setting, which we use as a reference scenario. The scenarios are represented by a set of mutually exclusive step dummy variables that take the value of 1 when a brand is exposed to a particular setting and 0 otherwise. Using this classification enables us to gain explicit insights into potential asymmetries between scenarios in effects of price increases versus price decreases and relative versus absolute price changes. To that extent, our operationalization is in line with prior work that examines asymmetries in promotion effects that differentiate between losses and gains (e.g., Bronnenberg and Wathieu 1996; Sethuraman, Srinivasan, and Kim 1999). To classify a brand over time in the different scenarios, we track the regular retail price per volume of the brand's leading SKU (for a similar approach, see Bronnenberg, Mela, and Boulding 2006). 7 Because the price scenarios reflect retailers’ decisions to include brands in the PW to enhance their overall performance, we do not treat these PW variables as exogenous in the empirical model. We instrument the PW dummy variables using a set of variables that reflect the cost of doing business at the brand, category, and retailer levels. (We provide more details on this approach in the “Methodology” section.) Next, we explain how we assign brands to the different PW scenarios and then elaborate on the operationalization of the different brand and retailer contextual moderator variables. Web Appendices A and B provide information on the frequency of the individual PW scenarios and the different sequences of PW scenarios.
PW scenarios definition
A brand enters a PW_PDrop scenario when a particular retailer reduces its regular price permanently in a given category. In our sample, 87 of the brand–category–retailer cases were immediately involved in the PW and never experienced a PW_PCst setting. In total, 249 cases entered a PW_PDrop setting at some point, 66% of which entered in the first three months; only approximately 3% entered during the last wave of price reductions in 2005. For the PW_PCst scenario, the retailer does not reduce a brand's regular price in a given category. In total, 237 cases experienced a PW_PCst scenario. Brands that experienced a PW_PCst scenario remained, on average, for 57 weeks in that scenario and only 29 weeks if they also entered the PW_PDrop scenario. Overall, 73 cases stayed in the PW_PCst scenario and thus never experienced a price reduction.
The last round of price reductions occurred on October 31, 2005. From that moment on, prices of brands directly involved in the PW slowly began to increase. We assign a brand to the post-PW_PLift scenario as soon as its regular price is increased. If the price of the brand is not increased, but the retailer increases a competing brand's regular price, we set the focal brand as involved in the post-PW_PCst scenario. Prices increased for only eight cases immediately after October 31, 2005. On average, retailers waited 44 weeks before increasing regular prices. 8
Brand positioning
We capture a brand's relative positioning as the ratio of the brand's regular price to the category price across all brands in category c at retailer r at time t. On average, the relative price positioning tends to improve during the PW_PDrop scenario (−3.4%) but worsens during the PW_PCst (+4.7%) and post-PW_PLift (+2.7%) settings. We further capture brand ownership by means of a dummy variable that equals 1 if the brand is a PL and 0 otherwise. In total, we have 81 PL and 243 NB cases.
Retailer positioning
We capture a retailer's relative price positioning using the average price at the retailer of a basket containing all products carried by all five retailers in the 25 tracked categories, relative to the average across all five retailers (for a similar approach, see Ailawadi, Pauwels, and Steenkamp 2008; Gijsbrechts, Pauwels, and Van Heerde 2014).
Marketing-mix actions
To capture the impact of price promotion activities, we include a price index, measured as the weekly shelf price of the brand's leading SKU divided by its nonpromotional regular price (e.g., Van Heerde, Leeflang, and Wittink 2004). To capture feature promotions, we include a dummy that equals 1 in the weeks when the retailers featured the focal brand in their circulars and 0 otherwise. Following Mela, Gupta, and Lehmann (1997), we use a brand's national television advertising spending to capture brand-oriented advertising. Because all marketing decisions are ultimately endogenous, we instrument all price-based, feature, and advertising variables. We elaborate in detail on this correction in the “Methodology” section.
Control variables
We control for a deterministic trend and retailer fixed effects. In addition, we control for the price evolution of the brand, captured by the brand's regular retail price in a given week divided by its regular retail price before the PW, and detail direct cross-retailer effects (Leeflang et al. 2000; Wittink et al. 1998) by including the focal brand's price at competing retailers. To this end, we use the average shelf price of the brand at competing retailers to correct for competition across retailers at the brand level. Moreover, we account for differences in the national availability of a brand by including its weighted distribution. We capture this weighted distribution as the percentage of stores in which a product is sold, weighted by the importance of the outlets, expressed in category volume share. The shares used as weights pertain to the average share in the previous year. Table 1 provides an overview of the key descriptive for all the variables. The Web Appendix presents the bivariate correlations between all variables and interactions used in the model.
DESCRIPTIVE STATISTICS
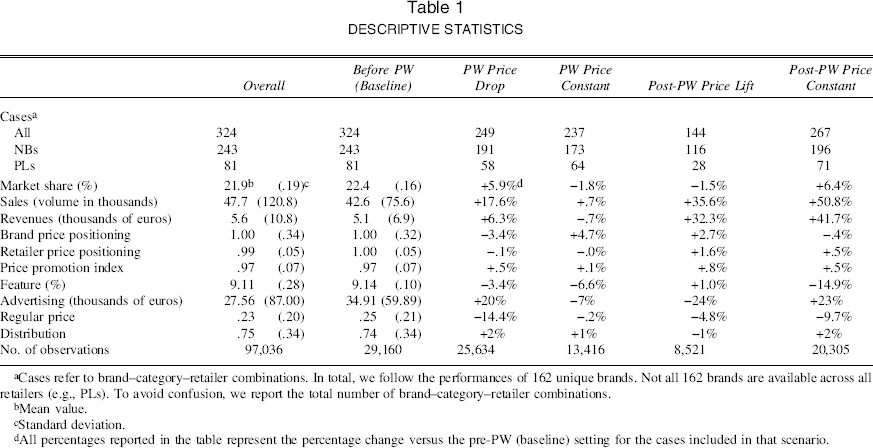
Cases refer to brand–category–retailer combinations. In total, we follow the performances of 162 unique brands. Not all 162 brands are available across all retailers (e.g., PLs). To avoid confusion, we report the total number of brand–category–retailer combinations.
Mean value.
Standard deviation.
All percentages reported in the table represent the percentage change versus the pre-PW (baseline) setting for the cases included in that scenario.
Methodology
To test the effects of PW involvement and the moderating effects of brand and retailer positioning on a brand's sales and market share, we use a multiplicative response model (Neslin and Van Heerde 2009) and a multiplicative competitive interaction market share attraction model (Cooper and Nakanishi1988), respectively. Formally, we can express these as follows:


The term 
Endogeneity
Retailers do not decide randomly which brands to include in a PW, nor do they set retail prices arbitrarily. Rather, they select brands and prices with the potential to maximize category and store performance. Similarly, manufacturers may anticipate how consumers will react to their marketing mix and adjust their promotional efforts (advertising, price, and feature promotions) accordingly. To account for possible endogeneity in these decisions, we use an instrumental variables approach for the potentially endogenous variables in the model.
Selection
Overall, suitable instruments must satisfy three requirements: (1) they must be uncorrelated with the error term of the performance model, (2) they must be sufficiently correlated with the endogenous elements of the independent variables, and (3) they must be uncorrelated with potentially omitted variables in the performance equation (Wooldridge 2010, p. 112). Therefore, finding suitable instruments is always a difficult challenge.
In general, prices and advertising will be set by the cost and markup structure as determined by the nature of the product, category, and retail environment. Costs are expected to be correlated with advertising and prices but to be uncorrelated with demand and unobservable demand shocks. Although cost drivers may be determinants of price and advertising, Nevo (2001, p. 546) concludes that these are rarely observed. To address this issue, we follow Nevo's approach of using marketing variables from a similar but different market as instrumental variables. The logic is that shocks in costs that cause exogenous variation in marketing variables in one market will cause similar exogenous variation in the focal market. For example, costs of ingredients may drive price variation in a market in the same way that they drive price variation in a different and noncompeting market. Thus, marketing variables in one market can be used as instruments for marketing variables in the other market (Hausman 1997; Nevo 2001; for recent applications, see Dinner, Van Heerde, and Neslin 2014; Lamey et al. 2012; Ma et al. 2011; Van Heerde et al. 2013). For these instruments to be valid, no common demand shocks may occur across markets, nor can advertising or promotion activities be coordinated across markets. This is more likely when a different set of retailers is active in the different markets.
Given that we are working with data that are specified at the national level (the Netherlands) and that cover a wide variety of product categories, we select information for the same set of categories from another national market (i.e., the U.K. market), to ensure the absence of such common demand shocks. In the United Kingdom, none of the retailers involved in the Dutch PW are active, nor do U.K. retailers operate in the Dutch market. Moreover, we double-checked the business press to ensure that no PWs were taking place at the same time in the United Kingdom. We further validated this empirically by regressing U.K. prices and advertising on the Dutch PW event, and the effect was not significant (p > .10). Overall, the U.K. retail market is considered similar to the Dutch market with respect to logistics (e.g., infrastructure, population density), market structure (e.g., dominant trading format, own-label penetration, concentration), and extent of vertical integration and supplier dependence (e.g., revenues derived [%] from wholesalers and manufacturers) (for more detail, see Fernie and Staines 2001), making it an excellent candidate from which to derive instruments. Thus, for every category in our sample, we identified the leading NBs and PLs at three leading U.K. retailers—namely, Tesco, Sainsbury, and Asda 10 —and matched them to the corresponding NBs and PLs in our sample. For each brand, we collected same and competitor prices and advertising 11 in the same period (2002–2008). In summary, the U.K. prices, averaged across the three retailers, and advertising series for each NB and PL and its top four competitors (ten instruments in total) enable us to partially capture evolutions in production and advertising costs.
To further capture the evolution in overall production costs, we use the following additional instruments from the Dutch market: quarterly gross domestic product per capita, monthly fuel (energy) index (this index is based on the prices of oil, petroleum, natural gas, and coal), and the overall consumer price index (data available from Statistics Netherlands [www.cbs.nl/en-GB/menu/home/default.htm]). Furthermore, to capture cost and differentiation drivers related to systematic differences across categories, we select additional instruments that reflect the competitive structure within every category not yet captured by the previous sets of instruments (see Hausman 1997; Luan and Sudhir 2010; Nevo 2001; Srinivasan, Nijs, and Pauwels 2008). The idea is that the competitive structure drives prices and advertising (e.g., brands in categories with a higher level of concentration may have lower markups). As such, we include sets of variables that, on the one hand, reflect the concentration level, the level of price dispersion, the extent of SKU proliferation, growth, and purchase frequency 12 and, on the other hand, capture a set of perceptual variables that reflect consumer category involvement, perceived quality, the value difference between NBs and PLs in the category, and the perceived promotion intensity in the category. 13 These variables are time invariant, measured in the U.K. market in 2001, the year before the Dutch PW erupted. By using U.K.-based data, we again filter out the potential impact on demand while capturing the impact on the cost structure.
To capture cost drivers at the retailer level, we include store service and assortment quality, which reflect the retailers’ logistic and operational costs. 14 Finally, to capture cost and markup differences due to innate brand and retailer characteristics, we use fixed-effects dummies for each retailer and brand. These dummy variables reflect the location of the brands and retailers in the characteristics space and can be assumed as exogenous or at least predetermined. Characteristics of other products are correlated with price and advertising because the markup and differentiation of every product depend on the distance from the nearest neighbor. Because brand characteristics are exogenous, they are valid instruments (Nevo 2001).
Finally, we use the fourth lag of the instruments. The sufficiently long lag ensured exogeneity, as confirmed by the Sargan test, which we discuss subsequently (for a similar practice, see Ataman, Van Heerde, and Mela 2010).
Strength and validity
We formally assessed the validity and strength of our instruments. First, we ran a Sargan test for overidentifying restrictions (Wooldridge 2010, pp. 134–35). The Sargan test firmly confirmed their validity: we could not reject the null hypothesis that the residuals and the instruments are uncorrelated at any of the conventional significance levels. Second, we also checked the strength of the individual instruments and removed instruments for which the significance level exceeded .10. The p-values of our instruments are below .01, suggesting that the variables are sufficiently strong. Moreover, we regressed each endogenous variable first against the exogenous variables in the performance model and then added the instruments to conduct an incremental F-test for the explanatory power of these independent variables. Overall, the set of remaining instruments was still sufficiently strong, as evidenced by the R-square and F statistics. Across the four scenarios, we obtained an average (median) R-square of 45% (49%), and all incremental F-values exceeded the common threshold of 10 (on average, the incremental F-values are 1,236, median = 893; see the Web Appendix). Thus, we conclude that the instruments are not weak. Given that the instruments are valid and not weak, we used the Hausman–Wu test to formally probe for endogeneity in the performance equations by comparing the ordinary least squares and the independent variable estimates (see Wooldridge 2010, p. 120). We can reject the null hypothesis that the estimates are equal, confirming that endogeneity exists. The results for the auxiliary regressions appear in the Web Appendix.
Following the instrumental variables methods for random coefficient models as proposed by Heckman and Vytlacil (1998) (see also Wooldridge 2010, p. 145), we use the resulting instruments and all exogenous variables of the performance model to estimate the four PW dummy variables, the log of the relative price, the log of the basket price, the log of the relative change in prices, the log of competing retailers’ prices, the log of the price promotion index, the log of advertising, and the feature support using two-stage least squares with generated instruments. 15 The correct variance–covariance matrix for the second-stage regression must take into account that the instrumented regressors were predicted from a previous (first-stage) regression (Wooldridge 2010, p. 145). To obtain the adjusted standard errors, we compute the residuals from the second-stage equation using the parameter estimates obtained by substituting the instrumented variables (the predicted values of the endogenous variables) for their original values (see Verbeek 2004, p. 145).
Results
We first discuss the estimation results for the volume sales and market share attraction model and discuss the empirical support for our hypotheses. Then, we use the parameters to simulate revenue gains and losses of PW involvement at both the chain and national levels. Table 2 depicts the parameter estimates for both the sales and market share attraction models.
RESULTS FOR VOLUME SALES AND SHARE MODELS

p < .10 (one-sided).
p < .05 (one-sided).
p < .01 (one-sided).
p < .10 (two-sided).
p < .05 (two-sided).
p < .01 (two-sided).
Notes: We do not display parameter estimates for the brand and retailer dummy variables owing to space limitations, but they are available on request. AR(1) = first-order autoregressive; −2LL = −2 log-likelihood.
Volume Sales and Share Parameters
Main effects of PW scenarios
Across both models, the main effects of the different PW scenarios behave as expected. In the PW_PDrop and post-PW_PCst scenarios, both volume sales and shares increase significantly, whereas in the post-PW_PLift and the PW_PCst settings, they both decrease significantly. The effect of a post-PW_PCst on sales and share is about two times as pronounced as the effect of the PW_PDrop scenario (sales: π1 = .28 vs. π4 = .44; share: π1 = .11 vs. π4 = .25), implying that the true effects of PW involvement can be reaped only after rival prices increase: when consumers can contrast the sustained price reductions to the increased regular prices of rivals, the perceived gains become substantially more appealing. Moreover, the negative effect of a post-PW_PLift is clearly more pronounced than the effect of a PW_PCst setting. Finally, the absolute effect of a post-PW_PLift is by far the largest of all PW settings (sales: π3 = −2.26; share: π3 = −.31), followed by the impact of the PW_PCst (sales: π2 = −.74). These results corroborate the extant literature in that price increases and decreases trigger asymmetric responses, with price increases being more harmful overall than price decreases being beneficial. At the same time, the negative damaging consequences of not being involved in the PW outweigh, in absolute value, the positive effects gained when a brand is involved (sales: |π2| = .74 > π1 = .28; share: |π2| = .15 > π1 = .11).
Brand positioning
During a PW_PDrop, premium brands gain less than economy brands (sales: π5 = −1.20, p < .01). This result is in line with the finding in the PW literature (Van Heerde, Gijsbrechts, and Pauwels 2008) that PWs further accentuate the price dimension and benefit traditional price fighters not just at the chain level but also at the brand level. Still, this does not apply to post-PW_PCst settings, in which premium brands stand to gain more from sustained price decreases than economy brands, as would be expected from the findings of the price promotion literature (sales: π8 = 1.39, p < .01; share: π8 = .27, p < .01). So, during a PW_PDrop, price fighters stand to win. In line with this notion, we find that economy brands lose more when stalling PW involvement (sales: π6 = 1.61, p < .01; share: π6 = .83, p < .01). However, as soon as some rivals’ prices are restored, premium brands gain more in sales and share: the reduced price gap with rivals whose prices were restored mainly favors premium players. During a post-PW_PLift and PW_PCst, premium brands are harmed more than other brands by the unfavorable absolute or relative price changes (π7 = −1.29, p < .05; π7 = −1.65, p < .01). This result is in line with our expectations, which were based on the salience argument.
During PW_PDrop settings, PLs seem to gain more than NBs (sales: π9 = .04, p < .05; share: π9 = .31, p < .01), again suggesting that PWs tend to favor all traditional price fighters. However, in post-PW_PCst settings, when rivals’ prices increase while the PL's lower price is maintained, PLs do not manage to gain as much from a contrast effect between their own sustained lower price and rivals’ increased prices (sales: π12 = −.80, p < .05; share: π12 = −.46, p < .01). In contrast, PLs’ lower salience and consumer knowledge favor PLs when confronted with higher absolute prices because they lose less than NBs in post-PW_PLs (sales: π11 = 1.86, p < .01; share: π11 = 1.18, p < .01), which is in line with our expectations. Yet when PLs face relative price increases in the PW_PCst setting, PLs stand to lose more (share: π10 = −1.91). Indeed, their price-fighter image does not allow the retailer to exclude them from PW involvement.
Retailer positioning
As we expected, not being involved in the PW tends to harm brands more when they are sold at premium-priced retailers (sales: π14 = −1.33, p < .01; share: π14 = −2.06, p < .01). At the same time, a brand may benefit more from PW involvement in premium store environments because of the positive impact on share, while sales volume is not harmed significantly (share: π13 = .74, p < .01). As we expected, after the PW, brands gain less from having their prices kept constant by more premium retailers (sales: π16 = −2.81, p < .01; share: π16 = −.03, p > .05). Moreover, although they may still stand to lose share, when premium-priced retailers do restore brand prices after the PW ends, brands stand to lose less sales at those premium retailers (sales: π15 = 8.06, p < .01). Indeed, consumers may more easily “forgive” price increases at premium retailers and justify their price increases (Campbell 1999).
Marketing-mix actions
We expected promotions to reduce the perceived gains of sustained price reductions and the perceived losses of regular price increases. This is confirmed by the positive, significant moderating effect of the price promotion index (sales: π17 = 12.67, p < .01; π20 = 6.12, p > .05; shares: π17 = .95, p < .01; π20 = 2.22, p < .01) and the negative, significant moderating effects of the PW_PCst and post-PW_PLift settings (sales: π18 = −19.48, p < .01; π19 = −29.13, p < .01; shares: π18 = −4.45, p < .01; π19 = −28.14, p < .01). 16
The moderating effects of features confirm that promotion-related information reduces both the gains of price reductions and the losses of price decreases. The interactions with the PW_PDrop and the post-PW_PCst settings are negative for both sales and shares (sales: π21 = −1.05, p < .05; π24 = −5.01, p < .01; share: π21 = −.69, p < .01; π24 = −.18, p > .10), whereas the interactions with the post-PW_PLift and PW_PCst scenarios are positive (sales: π22 = 2.74, p < .05; π23 = 12.58, p < .01; share: π22 = 1.35, p < .05; π23 = 3.07, p < .01).
Finally, we expected brand advertising to reduce price sensitivity. This is indeed the case during the PW for the brand's share as we find a negative moderating effect (share: π25 = −.05, p < .01) when the price is decreased and a positive moderating effect when the brand is not involved in the PW (share: π26 = .21, p < .01). Advertising may help mitigate the negative effects of not being part of a PW while direct competitors are. This is, however, not the case when it comes to sales (sales: π25 = .04, p > .05; sales: π26 = .01, p > .05). Moreover, after the PW dies out, advertising tends to reinforce price sensitivity, as we find that the moderating effects of the post-PW_Lift setting are negative and significant (sales: π27 = –.21, p < .01; share: π27 = –.11, p < .01). This result may be an indication that brand advertising stimulates consumers to contrast the advertised brands with their rivals. A PW_PDrop and post-PW_PCst reinforce the relative price decrease in favor of the advertised brand, while advertising helps further differentiate the brand from its rivals.
Impact of PW Involvement on Brands’ Revenue and Gross Profit at the Retailer Level
Ultimately, brand manufacturers want to assess the extent to which PW involvement will affect their brands’ bottom line. Therefore, we simulate the average weekly revenue gains and losses of each PW scenario for all the brands in the data set while distinguishing between different types of brands at both the chain level and the overall country level. We also assess the cumulative sales gains or losses in total after passing several sequential PW scenarios and evaluate how brands fare in total at the national level after the PW ends. Finally, we offer some insights into the impact of wholesale price renegotiations on brands’ gross profits.
To evaluate the revenue gains and losses of PW involvement while filtering out all other confounding effects, we reran the model using value sales (expressed in thousands of euros) as our dependent variable. Because value sales capture the combined effect of both volume sales and price changes, we can use the parameters from this model to assess the extent to which PW involvement leaves more or less money on the table than before the PW erupted. 17
Impact of individual PW scenarios
For each brand in our data set, we calculate, ceteris paribus, the weekly revenues the brand would have obtained in each scenario. Therefore, we use the parameters of the revenue model and set all relevant variables to their means in each respective scenario, while assuming no additional marketing-mix support. First, we examine the effect at the chain level for both NBs and PLs and also extrapolate the effects to the country level 18 for NBs involved in the same scenario at different chains. Moreover, we classify brands into three price tiers based on the distribution of their average relative price in the pre-PW stage. Second, we compute the revenue gains or losses of the different PW stages as the difference between expected revenues in the pre-PW setting and the projected revenues in each PW scenario. Table 3 reports weekly revenue gains and losses, extrapolated from the panel to the total Dutch market, based on conversion rates provided by GfK.
WEEKLY REVENUE LOSSES AND GAINS, ASSUMING NO MARKETING-MIX SUPPORT

Notes: All figures are expressed in thousands of euros and are extrapolated from the panel to the total Dutch market on the basis of conversion rates provided by GfK. The table presents the weekly gains or losses per PW setting using the results from a model with value sales (expressed in K euro) as the dependent variable. The table reads as follows: A brand that enters the PW_PDrop tends to lose on average -€.36K (-€360) per retail chain (-€.63K [-€630] at premium chains, but gain +€.58K [€580] at economy chains). Summing all revenue gains and losses across all supermarkets, a brand that enters the PW_PDrop tends to suffer −9% revenue losses. For the purpose of this exercise, we use abstraction from all potentially correcting marketing efforts, such as advertising and price promotions. Thus, the numbers may appear larger than observed in real life.
As Panel A in Table 3 shows, on average, the increase in revenue following a PW_PDrop involvement is limited and even slightly negative (at the chain level: −€360; at the national level: −€1,350), implying that the resulting volume sales lift does not compensate for the price cut. Still, at budget retailers (i.e., price 10% below market average), these losses turn to slight gains (+€580), whereas at premium retailers (i.e., price 10% above market average), the same brand incurs a more pronounced loss (−€630). More substantial revenue gains, however, can be obtained during the post-PW_PCst setting: if the regular price is maintained at the lower level while rival prices increase, brands can expect revenue increases relative to the pre-PW baseline of €5,370 and €38,150 at the chain and national levels, respectively. Although the price remains well below its pre-PW level, the resulting increases in volume sales offset those lower prices substantially. In contrast, in settings in which the brand's price increases (relatively and absolutely), substantial losses can be expected. On average, a brand stands to lose up to €3,570 (nationally: −€14,680) in PW_PCst scenarios and up to €34,370 (nationally: −€132,100) in post-PW_PLift settings. This suggests that although not being involved in the PW leads to substantial revenue losses, caution is warranted because after the PW, brands have a difficult time restoring prices. These losses are most pronounced at budget retailers (−€68,020) and least pronounced at more premium players (−€10,890).
The revenue effects of different brand tiers
When distinguishing between gains and losses for premium versus economy brands, we find that in PW settings involving price decreases, the effects are mixed (see Table 3, Panel B). In PW_PDrop settings, economy NBs and PLs gain more than standard and premium NBs; on average, premium and standard NBs incur losses in direct PWs (−€790 and −€570, respectively), whereas the other brands earn small gains (economy NB: +€350; standard PL: +€800; economy PL: +€260). Nevertheless, for premium and standard NBs, the most substantial gains of PWs unfold after the PW, when rival brands’ prices are restored while focal brands’ reduced PW prices are maintained. Indeed, we find weekly gains of €16,190 and €8,830 for premium and standard NBs, respectively, while the gains for economy NBs and standard PLs are more or less the same as during the PW (+€270 and +€630, respectively) and economy PLs incur a small loss of €870.
In PW settings involving relative or absolute price increases, NBs suffer disproportionally more than PLs. In PW_PCst, premium, standard, and economy NBs stand to lose €3,180, €6,210, and €3,110, respectively, while standard and economy PLs’ losses are limited to €260 and €140, respectively. Thus, delaying PW involvement can be costly for NBs and especially the premium-positioned players. Yet the losses that can be incurred when the PW ends and prices are restored are also most substantial for NBs (premium NB: −€37,420; standard NB: −€47,810; economy NB: −€12,620). Overall, PLs fare better and can even gain (standard PL: +€240; economy PL: +€50).
Total revenue effect of PW scenario sequences
In addition, we assess the cumulative revenue gains or losses a brand stands to incur in total, after passing sequential PW settings, relative to a business-as-usual setting that assumes that the PW had not erupted. To do so, we multiply the weekly revenues obtained during a particular PW scenario by the number of weeks the brands remain in that setting (see the Web Appendix). Moreover, we distinguish between scenarios that do not involve additional marketing-mix spending and scenarios that allow for price and feature price promotions after the PW when the brand's price is restored, because these levers are particularly helpful to brands in these settings. For the former, we assume that a 15% price discount or feature is used every six weeks during the direct post-PW setting on the basis of the average interpromotion interval in our data set. Table 4 depicts the total revenue shifts for the most frequent PW sequences (see also the Web Appendix).
TOTAL REVENUE GAINS AND LOSSES FOLLOWING PW INVOLVEMENT

Notes: All figures are expressed in thousands of euros and are extrapolated from the panel to the total Dutch market on the basis of conversion rates provided by GfK. The table presents the total gains or losses for the most frequent PW sequences that brands experienced in our setting, using the results from a model with value sales as the dependent variable and the average number of weeks brands stay in each setting displayed in the Web Appendix. The table reads as follows: In sequence A, a brand that enters the PW_PDrop and the post-PW_PLift setting tends to lose, on average, -€5,470K (-€5.47 million). These losses are reduced to -€1,657 (-€1.657 million) or -€2,169 (-€2.169 million) if the brand uses 15% discounts or is featured every six weeks during the post-PW_PLift scenario.
Every sequence of scenarios that involves a post-PW_PLift phase will result in the lowest level of revenues and even substantial losses (Sequences A–D). The losses are most substantial when a PW involvement is delayed and the brand is the first in the category to restore the price level (Sequence A: −€5.47 million). When the brand is immediately involved, the loss drops considerably (Sequence B: −€2.556 million). If the retailer stalls restoring the brand price after the PW ends, the average loss drops further, and more so if the brand was not immediately included in the PW (Sequence C: −€1.711 million; Sequence D: −€158,000). In contrast, if the brand's price is not increased when the PW ends, considerable revenue gains can still be obtained, rising up to €1.185 million (Sequence E) and €1.308 million (Sequence F), with and without incurring a PW_PCst setting, respectively. In summary, significant revenue gains can be achieved from PWs, but they come at the cost of maintaining the price at the reduced PW level.
Table 4 also reveals that using either increased price promotion or feature intensity, on average, does not always suffice to offset the negative effects of a post-PW_PLift involvement. Only when involvement in PWs is stalled can additional price promotions turn PW involvement into a gain, and more so when the price increase after the PW is also delayed (Sequence C: +€1.542 million; Sequence D: +€3.104 million).
Total effect of retailer PWs on brands
We also assess the extent to which retailer rivalry damages or benefits brands overall at the national level, regardless of differences in PW involvement across retailers. Therefore, we evaluate the total gains or losses a brand incurs relative to the start of the PW, calculated as explained previously, across all retail chains in which the brand is available. 19 Across the board, 50% and 51% of all NBs and PLs included in this study reported a gain, after we filtered out the potential gains of additional marketing support. Taking this analysis one step further, we explore what types of brands were able to weather the downside of retailer-initiated PWs. To do so, we ran two additional regressions, one for NBs and one for PLs, in which we regressed the estimated total losses or gains without additional marketing-mix support to a set of covariates all measured before the start of the PW and captured the brand's (1) relative advertising spending, (2) feature intensity, and (3) price promotion intensity and the category's (4) concentration and (5) SKU proliferation. 20 For the NBs, we found that gains were, on average, higher if NBs had invested more in advertising before the start of the PW and less in feature communications and promotions. So, whereas advertising does not help mitigate the negative effects of price increases after the PW ends (while feature communication and price promotions do), investing in advertising before a PW helps shield brands from revenue erosions from PWs. In contrast, PLs were better off when they invested less in advertising before the PW. So, advertising may weaken the price-fighter image of PLs, which hurts them during PWs. Still, PLs perform better during PWs if their promotion intensity was lower before the PWs: price promotions may make potential consumer gains of permanent price cuts less salient. We further highlight our findings by considering the 2 × 2 matrix presented in Figure 2, in which we distinguish between brands that rate low and those that rate high on advertising and promotion intensity before the PW, on the basis of an approximate median split. For each cell, we provide the median, the 25th, and the 75th percentile revenue loss or gain, to illustrate the revenue values for the best- and worst-case scenarios for both NBs and PLs.

WHAT BRANDS WITHSTAND PWs BEST?
Margin and wholesale price implications
Because of the price cuts during PWs, retailers may want to renegotiate wholesale prices 21 to maintain their gross profit levels and put pressure on manufacturers to reduce these wholesale prices. Retailers often argue that manufacturers stand to benefit from PWs because price reductions stimulate market performance, such that even when manufacturers partially carry the burden of the price reduction, their net result is positive. Profits are, however, extremely sensitive even to the slightest declines in average prices because any decrease goes straight to the bottom line (Garda and Marn 1993). Therefore, we raise the question of how manufacturer gross profits will be affected by renegotiated wholesale prices. Although we do not have full margin and cost information for all brands and retailers, we have gross margin information for all brands at one retailer (i.e., the difference between the retail price and the buy-in price). We define gross profit as the gross margin multiplied by the number of units sold. This enables us to assess the effects of wholesale price reductions on brands’ gross profits in case retailers aim to shift the full burden of the PW retail price reductions to the brand manufacturer. More specifically, we calculate the impact on brands’ gross profits if the retailer renegotiated the wholesale price in such a way that the retailer maintains (1) the pre-PW margins with the new reduced regular retail price or (2) the same gross profit level as before the PW.
If the retailer wants to maintain the same gross margin as before the PW, the wholesale price will need to decrease, on average, by 13%. In approximately 72% of all cases, the resulting wholesale price shift will lead to an average gross profit loss of 27%. If a brand can still gain, the gross profits increase by 39% on average. If the retailer renegotiates the wholesale price to maintain the same pre-PW gross profit level, wholesale prices decrease by 24%. In this case, brands’ gross profits decrease by 32% in approximately 70% of all cases. However, in the remaining 30% of cases, brands still gain, and their gross profits increase by 55%.
Conclusion
Brand manufacturers are often at the mercy of retailers when their brands become involved in supermarket-initiated PWs. As such, they feel pressured to decrease the buy-in price during the PW and not to pass on price increases after the PW is over (Aitamer and Dubreil 2013), even though the implications of these actions on brand performance are unknown. Moreover, suppliers must cope with retailers’ efforts to promote their PLs to maintain their margins. Such intense price competition distorts consumers’ price perceptions, potentially jeopardizing premium brands in favor of economy brands and PLs. Using a natural experiment of a Dutch PW, we investigate what happens to brand performance (1) during a PW, both when the brand is not involved in the PW (while the direct competitors are) and when the brand is included directly in the PW and regular prices are reduced, and (2) after a PW, both when the brand's price is not increased while some rival brands’ prices are restored and when the brand's regular brand is restored to a higher level. We allowed brand and retailer positioning and marketing-mix actions to moderate the effects of these PW scenarios. Combining the effects of different PW scenarios and sequences, we pinpoint when brands are more likely to be harmed by supermarket-initiated PWs in the following subsections.
Discussion
PWs are not truly revenue, sales, or share generators
In contrast with retailers’ hopes of increased volume sales, the resulting volume sales and revenue sales at the individual brand level are relatively modest in most cases, suggesting that volume sales lifts hardly compensate for the price drops. The true gains of PW involvement can be reaped only if the retailer does not restore the brand's price in the aftermath of the PW, which comes at the cost and risk of permanently devaluating brand value and equity in the long run.
No reduction in price during PWs by retailers also hurts brands
Even when revenues are considered, the best-case scenario for most brands is when retailers enter brands in PWs immediately by reducing the retail prices. The share, sales, and revenue losses brands stand to incur by not being involved in PWs even outnumber the gains they can reap during the PW. This recommendation for (third-party) brands contradicts the usual guideline given to potential direct PW participants (i.e., the retailers in grocery PWs), which is to stay out of PWs as long as possible (Rao, Bergen, and Davis 2000). Brands, unwillingly caught in PWs, may benefit from being involved in PWs as quickly as possible.
The true gains or losses of PW involvement are revealed only after the PW ends
Only when rivals’ prices are restored, while the focal brand's reduced retail price is maintained, can substantial sales and share gains be realized. Still, this comes at the cost of maintaining a lower retail price and thus risking brand equity losses in the long run. However, if retail prices are increased after the PW, losses are substantial (in volume, value sales, or shares).
Staying out of the PW altogether is not necessarily destructive
When brand prices are not reduced at any point in time during the PW while rivals’ prices are reduced, brands may not be harmed and may even record a small revenue gain. Indeed, potential gains can be reaped in the aftermath of the PW when rival prices are increased and the “nonparticipating” brands become the relatively less expensive options. Dissuading retailers from using brands through buy-in price manipulation or other negotiation tactics is a strong negotiation stance that may pay off (albeit at the risk of souring the relationship with the retailer). Moreover, if the retailer still decides to engage the brand in its PW tactics, not only do these hypothetical “stay-out-of-the-PW” gains vanish, but the deteriorated relationship may also harm the brand in the long run. Thus, negotiations to stall PW involvement may be a high-risk game.
Not all brands are equal: PWs jeopardize NBs but boost PLs’ performance
Premium (national) brands gain less in volume sales and share and even risk incurring revenue losses when retailers actively engage them in their PW battles. In contrast, PLs still win with respect to revenue. This may indicate that retailers can strategically use PLs and NBs in PWs to further improve the strategic position of their own store brands relative to NBs. In addition, given that PLs lose more when their price is not reduced in PWs, retailers may have more than one reason to actively engage and prioritize their PL portfolio in PWs. In the aftermath of the PW, NBs seem at first to be the clear winners with respect to shares and volume and value sales when the reduced prices are maintained by the retailer. Still, this may turn out to be a Pyrrhic victory in the long run; although immediate revenues rise, ultimately the NBs’ equity and leverage in relation to PLs is reduced, especially because the price gap between both (one of the most important drivers of sustained NBs’ power over PLs) will likely shrink. Because PLs can withstand the negative effects of a price increase in the PW aftermath better than NBs, they can afford to restore their prices, which is not the case for NBs. Indeed, all NBs can expect to incur severe losses when increasing prices again at the end of the PW if they do not take corrective marketing-mix steps. This finding may again be an indication that PWs ultimately reinforce PLs’ leverage. For most other brands, any sequence that involves price increases as the PW ends is bound to result in severe revenue losses. Compensating with higher unit prices may be the only way to reduce revenue losses without extra investments in price and feature promotions (which ultimately also affect brand equity). Overall, NB manufacturers should try to negotiate their way out of PWs if they know how not to jeopardize the relationship with the retailer completely.
Not all retailers are equal: higher performance at premium chains
During PWs, brands stand to lose more in both share and sales when premium retailers do not include them in their PW activities. At the same time, brands may gain more in share in these more premium shopping environments when their price is reduced in the PW. In addition, after the PW, restoring prices in premium store environments is substantially less harmful to brand sales. This suggests that when brand manufacturers want to negotiate their position with retailers during PWs, they should pick their fights because they may fare better at premium retailers.
The role of the marketing mix tends to change before and after PWs
Advertising does not help mitigate the negative effects of price increases in the aftermath of PWs, whereas feature communication and price promotions do. Again, this may be a short-term fix because increased price promotion tools only feed consumers’ price discount cravings, which may ultimately erode brand value in the long run. Still, advertising support before a PW creates a buffer that helps prevent revenue erosion resulting from PWs. In contrast, PLs weather the downsides of PWs better when they have invested less in advertising in non-PW times, because advertising may weaken the PLs’ price-fighter image. At the same time, like NBs, PLs suffer less from PWs if their promotion intensity was lower before the PWs.
Margin renegotiations during PWs will likely be difficult
Retailers hoping to engage brands in financing the price reduction may expect solid opposition from manufacturers. During PWs, wholesale price reductions are not feasible in the vast majority of cases, unless the brand's gross profit is reduced as well. In contrast, if the brand's price is reduced permanently in the PW aftermath, margin renegotiation options become more realistic because revenue gains are more substantial, creating more leeway on both the manufacturer and the retailer sides. Still, because most refinancing is often required during the financially strenuous PW stages, interests will likely not be aligned, and negotiations will be cutthroat.
Limitations
Several issues for further research remain. In this article, we mainly consider the effects on market share and only briefly touch on profit implications. Still, margin renegotiations and, thus, profit shifts are crucial elements in retailer–manufacturer relationships during PWs. Although we provide insights into the potential outcomes for two brands in one category, this exercise is limited in scope and does not project the full cost spectrum. This is, however, not uncommon in the literature, as full retailer and supplier margin data are rarely available. Although we have limited information on wholesale prices, with a full set of (time-varying) margin and cost data, a more complete profit picture could be drawn. Further research should examine these profit implications. Moreover, we gleaned some first insights into PWs’ total brand demand by extrapolating the brands’ retailer sales to the national level. However, to gain deeper insights into total brand demand, an alternative approach could be to model total sales as the dependent variable and all retailers’ individual actions as independent variables. Furthermore, research should explore the generalizability of our results for other products, industries, and geographic markets. In this article, we observe the performance of the top brands in the most sold and penetrated (traffic-building) consumer packaged goods categories. Although we can argue that PWs are fought mainly with brands that offer the potential to affect store traffic, different effects could arise for minor brands belonging to more niche-like or fill-in types of categories. In addition, this research is set in the Netherlands, a market in which PLs are well accepted and not necessarily perceived as inferior options. Extending this research to countries and markets in which PL penetration is less high would verify whether PLs are as likely to thrive in PW settings.
Footnotes
1
We use the term “sustained” to indicate that the price reductions are not typical temporary price promotions but are maintained for the entire length of the PW, if not longer. The distinction between a sustained price reduction and a temporary price promotion is usually clearly communicated to consumers. For example, in our setting, retailers informed consumers of their intentions to maintain the prices at the reduced level in the long run, communicating them as “permanent” lower prices.
2
In this study, we focus mainly on brands’ performance within each retailer, though we acknowledge that brands are also concerned about their position in the entire market. However, by conducting a simulation at the national level (in the “Total Revenue Effect of PW Scenario Sequences” subsection), we also shed some light on the overall brand demand. In the remainder of the article, we refer to sales and share at the retailer level, with the exception of the section on the simulation results. Moreover, we use the word “sales” when referring to volume sales and “revenues” when referring to dollar sales throughout the text. “Share” always refers to volume share.
3
According to ![]() , a PW occurs when one or more of the following criteria are met: (1) the direction of the pricing is downward; (2) the pricing interaction among the actors occurs at a much faster rate than normal; (3) the actions and reactions focus mainly on the competitors, rather than on the customers; (4) the competitive interaction violates industry norms; (5) the pricing interaction as a whole is undesirable to competitors; (6) the competitors neither intended nor expected to ignite the PW through their preceding competitive behavior; and (7) this pricing interplay is unsustainable.
, a PW occurs when one or more of the following criteria are met: (1) the direction of the pricing is downward; (2) the pricing interaction among the actors occurs at a much faster rate than normal; (3) the actions and reactions focus mainly on the competitors, rather than on the customers; (4) the competitive interaction violates industry norms; (5) the pricing interaction as a whole is undesirable to competitors; (6) the competitors neither intended nor expected to ignite the PW through their preceding competitive behavior; and (7) this pricing interplay is unsustainable.
4
As Van Heerde, Gijsbrechts, and Pauwels (2008) discuss, all criteria that define a PW (![]() ) were met during the Dutch PW.
) were met during the Dutch PW.
5
For consumer packaged goods, retailers set prices centrally and advertise these prices nationwide in the Netherlands, implying that no price-zoning practices are used. Note also that in May 2006, Laurus, the holding company behind Edah, announced that it sold Edah to the Sligro Group, after which the Edah chain was dissolved (![]() ). As such, we censor the Edah observations from May 2006 onward, which leaves us with fewer time observations in the post-PW settings for Edah.
). As such, we censor the Edah observations from May 2006 onward, which leaves us with fewer time observations in the post-PW settings for Edah.
6
The categories we analyzed are beer, biscuits, candy bars, cheese, chips, chocolate milk, coffee, coffee milk, cream, detergents, drinkable yogurt, frozen pizza, soft drinks, ice tea, juice, low-fat spreads, margarine, milk, muesli, softener, biscuits, laundry detergent, laundry powder, water, and yogurt.
7
The regular price of an SKU refers to the nonpromotional price within a given brand–category–retailer combination. Hereinafter, “regular price” refers to the regular price of the leading SKU. To assess the robustness of our classifications, we checked up to five leading (in terms of volume sales) SKUs of each brand. This check enabled us to verify and confirm the exact timing of price increases and reductions.
8
Involvement in a PW can vary widely across retailers for one and the same brand. For example, the retailers used Amstel, a beer brand, in four ways in our data. At one retailer, Amstel was immediately included in the PW (PW_PDrop), and its price was not raised again after the PW (post-PW_PCst); another retailer did not include Amstel immediately in the PW but focused on its rivals (so Amstel also went through a PW_PCst setting). At yet another retailer, Amstel was immediately included in the PW, but the retailer did restore the price after the PW (post-PW_PLift). Finally, at the two remaining retailers, the brand went through all four PW scenarios, but even in those cases, the timing of entering the scenarios is not the same.
9
To test the need for a first-order autoregressive specification of the error term, we regress the residuals of the sales and market share attraction models on the independent variables used in those models and the lagged residuals. The significant p-values (< .01) suggest the presence of autocorrelation (![]() , p. 40).
, p. 40).
10
These retailers are similar in terms of assortment, prices, service, and quality to the retailers in our data set.
11
The price data were obtained through Aimark and derive from the U.K. Kantar household panel data. The advertising data are from Nielsen Media Research.
12
These variables derive from the U.K. Kantar household panel data.
13
The perceptual category variables were made available by Aimark and were previously used by Steenkamp, Van Heerde, and Geyskens (2010) and Steenkamp and Geyskens (2014). For more information on the operationalization, see Steenkamp, Van Heerde, and Geyskens (2010, pp. 1015–16).
14
Perceptions of store merchandise quality and service come from members of GfK's national household panel. The data cover an eight-year period, from January 2001 to December 2008, and include 12 (biannual) waves of surveys, each conducted during one week (around weeks 16 and 40 every year). The store-level scores represent the average across all panel members (for a similar approach, see ![]() ).
).
15
16
The promotion index is below 1 in the case of a promotion and equals 1 in business-as-usual settings. Therefore, a positive (negative) sign implies that promotions lead to a more negative (positive) impact of a PW scenario.
17
Compared with the volume sales model, the parameters of the revenue model seem robust and are similar with respect to significance and sign. The full set of results can be obtained from the authors on request.
18
By definition, PLs are only available in one chain; thus, chain-specific results reflect the national level.
19
For the PLs, the national and chain level collapse because PLs are, by definition, only available at one chain.
20
Both regressions were significant, with R-squares of .19 and .43 for NBs and PLs, respectively. The results are available on request.
21
Typically, wholesale prices are negotiated once—at most, twice—annually. Conversely, retailer prices fluctuate all the time, as do volume sales. Thus, both a brand's gross margin and profit (which is determined by the gross margin and the volume sales) also fluctuate all the time. Our purpose is to determine how retailers can renegotiate wholesale prices to maintain relatively steady gross profit levels when facing strongly fluctuating retail prices and volume sales.
References
Supplementary Material
Please find the following supplemental material available below.
For Open Access articles published under a Creative Commons License, all supplemental material carries the same license as the article it is associated with.
For non-Open Access articles published, all supplemental material carries a non-exclusive license, and permission requests for re-use of supplemental material or any part of supplemental material shall be sent directly to the copyright owner as specified in the copyright notice associated with the article.