
Abstract
The authors study the joint effects of creative format, message content, and targeting on the performance of digital ads over time. Specifically, they present a dynamic model to measure the effects of various sizes of static (GIF) and animated (Flash) display ad formats and consider whether different ad contents, related to the brand or a price offer, are more or less effective for different ad formats and targeted or retargeted customer segments. To this end, the authors obtain six months of data on daily impressions, clicks, targeting, and ad creative content from a major U.S. retailer, and they develop a dynamic zero-inflated count model. Given the sparse, nonlinear, and non-Gaussian nature of the data, the study designs a particle filter/Markov chain Monte Carlo scheme for estimation. Results show that carry-over rates for dynamic formats are greater than those for static formats; however, static formats can still be effective for price ads and retargeting. Most notably, results also show that retargeted ads are effective only if they offer price incentives. The study then considers the import of these results for the retailer's media schedules.
Keywords
Advertisers often use multiple creative formats in their digital campaigns to target and retarget consumers with product-based messages and price incentives. These include static formats (e.g., GIF, JPG) that offer neither animation nor interactivity; simple Flash formats (e.g., SWF) that offer animation but no interactivity; and rich-media formats (e.g., HTML, Java) that offer both interactivity and animation, with elements such as sound, video, floating images, and screen take-overs. As a result, advertisers have the nontrivial task of jointly assessing the effects over time of design elements available in the large number of such formats as they decide on budgets, message objectives, and consumer targeting. There is, however, some evidence from industry studies that ad format size, location, and creative elements such as color, interactivity, and animation may all independently influence engagement (e.g., Cole, Spalding, and Fayer 2009; DoubleClick 2009). Yet this evidence raises difficult questions. For example, a retailer may still wonder whether product-based content or price incentives would be more suitable message content for animated and static ads; or which ad formats and message are more effective for retargeting, the canonical tactic of tracking visitors to a firm's site and then serving the firm's ads to them when they visit other sites (Lambrecht and Tucker 2013).
The retailer may also be interested in the temporal effects of online ads, but extant work has been largely cross-sectional and so cannot help to formulate dynamic advertising strategies (Breuer, Brettel, and Engelen 2011). Internet ad–exposure models in marketing (e.g., Danaher 2007; Danaher, Lee, and Kerbache 2010) have, however, explored the performance of ad formats over time. Thus, it is necessary to consider not only when formats work but also how long their effects persist, so that firms can better match formats to ad messages and targeted consumers (e.g., Tellis, Chandy, and Thaivanich 2000). For instance, a large body of work on offline ads has suggested that ads have both instantaneous and long-term, or carryover, effects (e.g., Sethuraman, Tellis, and Briesch 2011). Yet studies of digital ads have largely ignored carry-over, attributing consumer engagement to recent impressions. Braun and Moe (2013) model carry-over effects but treat them as homogeneous. Given the evidence that carry-over may differ, for example, across e-mail and online channels (Breuer, Brettel, and Engelen 2011), a useful direction to explore would be to model heterogeneous carry-over effects. Furthermore, we know that the effects of ad messages may vary across media and markets (Deighton, Henderson, and Neslin 1994; D'Souza and Rao 1995; MacInnis, Rao, and Weiss 2002), so we might want to consider how such effects differ across online retargeted consumers. Knowing these features of digital ads, the effects of carry-over, format, target, and message could help managers improve ad engagement. This, in turn, could ultimately help firms better allocate ad resources throughout their digital advertising campaigns (Rust and Leone 1984).
This study attempts to fill some of the central gaps in extant work by developing a dynamic response model to study the joint effects of creative format, message content, and targeting/retargeting on the performance of digital ads over time. Specifically, the model examines the dynamic effects of ad theme (price or product) and creative format (animated and static ads of varied sizes) on the clicking behaviors of targeted versus retargeted consumers. We address the following substantive questions: How do carry-over effects vary across animated and static ads and across targeted consumers? What is the effect of format (size/position) on consumer clicking behavior? What are the effects of price theme versus product theme within different digital formats? (Prior research has posited that ad format effectiveness can vary with ad copy elements; Grass and Wallace 1969; Naik, Mantrala, and Sawyer 1998). Most important, which ad format and copy theme (price vs. product) are most effective for retargeting?
We also innovate methodologically to be able to extend econometric studies of advertising's dynamic and content effects (e.g., Bass et al. 2007; Chandy et al. 2001; Clarke 1976; MacInnis, Rao, and Weiss 2002) to the domain of digital advertising. Digital ad response data, consisting of clicks in this study, are time series of counts, which contain a high frequency of zeros due to nonresponse that result in “zero inflation.” This presents a challenge: failure to account for zero inflation and/or dynamics may result in misleading inference and the detection of spurious associations. To address these two concerns and the substantive questions posed earlier, we propose a dynamic, state space, zero-inflated count model (e.g., Poisson, negative-binomial). The resulting response model is both dynamic and nonlinear, and therefore, we estimate it using a combination of particle filtering and Markov chain Monte Carlo (MCMC) procedures (Doucet, De Freitas, and Gordon 2001; Liu and Chen 1998; Ristic, Arulampalam, and Gordon 2004). Particle filtering, in its many variations, is widely applied in statistics; it is a flexible Bayesian inferential method used to estimate nonlinear/non-normal dynamic systems. In these systems, the posterior distributions of the state space parameters are analytically intractable, and thus, the filter operates by drawing weighted samples from a time-varying proposal distribution (i.e., an importance function). The analytic expression for the optimal form of this importance distribution—optimal in terms of computational efficiency—is available only in special cases (e.g., Doucet, De Freitas, and Gordon 2001). It is possible, however, to obtain a linear/normal approximation of this function at its mode, where the mode arises from an iterative Newton-Raphson step embedded within the particle filter. The resulting algorithm provides an approach to estimate any state space model within the exponential family (Doucet, Godsill, and Andrieu 2000), and it is more general than Gaussian filters such as the extended and the unscented Kalman filters (Ristic, Arulampalam, and Gordon, p. 32).
The article, therefore, contributes to an emerging literature on digital ad response models in the following ways. First, we find that animated ads have significantly higher carry-over effects and impact consumer engagement over a longer duration than static ads, in all ad formats and among both targeted and retargeted consumers. Second, within the animated formats, price-themed ads are more effective than product-themed ads. Third, retargeted ads are effective only when they offer price incentives, a finding consistent with Lambrecht and Tucker (2013), who find retargeted ads effective only when consumers have strong preferences such that they have incentives to buy. Fourth, we find that all ads (i.e., by formats and messages) targeted to the female segment are effective; this suggests that, in our example, female shoppers are more willing to engage, perhaps confirming the axiom from brick-and-mortar studies that “women shop; men buy.” 1 Fifth, to answer our questions, we had to introduce new Bayesian methods that respect features of digital ad data and the underlying nonlinear dynamics process that generates them. We believe this approach, which is our main contribution, complements other methods, including bandit problems (sequential experiments) and the Bayesian algorithms (e.g., Thompson sampling) used to study them (Scott 2010); for modeling nonlinear dynamics, data sparsity (e.g., nonresponse), and the effects of multiple exposures (i.e., ad repetition) present challenges to such algorithms (e.g., Agarwal 2010; Schwartz, Bradlow, and Fader 2016). Admittedly, hierarchical modeling (i.e., Bayesian) can help obviate the sparsity problem when Thompson sampling is used, but dynamics and multiple exposures are not straightforward extensions. Finally, we conduct simulations to show the import of our findings; these should be of interest to online retailers and digital media planners.
“‘Men Buy, Women Shop': The Sexes Have Different Priorities When Walking Down the Aisles,”
To address the questions in the study, we obtained panel data from a major U.S. retailer in an industry that provides products and services for the home. The data set offers a selection of daily ad impressions and their associated clicks, with both clicks and impressions disaggregated by consumer targets, ad format, and message content; ad networks commonly release such data to their clients. Specifically, the data set contains a panel of click counts for 154 days, across six creative formats and four targeted segments: Flash and GIF formats 2 in each of three size-orientation combinations (160 × 600, 300 × 250, and 728 × 90), and segments classified as retargeted, male, female, and age. A unique feature of the data is that daily impressions (within format and target) cluster into price, product, and control impressions, where price impressions are price promotion ads, product impressions are ads that stress brand benefits other than price; and control impressions are blank impressions used to exclude non-U.S. consumers from viewing specific ads. We (and the retailer) note that these blank ads often artificially inflate engagement measurements because viewers click on them, largely from curiosity (e.g., white objects become visually salient), but also in error (McConnell 2012). Finally, we model impressions as potentially endogenous (Lee, Hosanagar, and Nair 2015) because they may depend on omitted factors such as website content, format type, or clicking history.
Simple Flash ads contain animation frames and multiple click-through buttons but lack interactive elements; GIF ads have only a single click-through button and no animation frames or interactive elements.
The remainder of the article is organized as follows. The next section provides a brief review of the relevant streams in the advertising content and dynamic effects literatures. Subsequent sections develop the empirical model and describe its estimation and the data we employ, in that order. The last two sections describe our estimation results and conduct simulations to summarize their impact on a hypothetical media schedule. The article concludes with an overview of the findings and the limitations of the study.
Literature
We provide a brief review of the academic literature relevant to the effects of ad formats (size and animation), content, targeting, and carry-over rates, all on response metrics such as click-through rate (CTR), attention, and recall. Admittedly, we know much about the effectiveness of traditional ads, but our understanding of the effectiveness of digital ads is rapidly evolving. This review reflects that notion.
The Impact of Ad Size
Although one would expect larger banner ads to be more effective than smaller ads (ceteris paribus), the evidence seems inconclusive. Larger ads seemingly could improve memory for products and are more likely to be seen and remembered relative to smaller ads (Chandon, Chtourou, and Fortin 2003; Cho 1999). They have also been associated with greater attention and response (Baltas 2003), greater intention to spread positive word of mouth (Chtourou and Chandon 2000), higher recall (Chatterjee 2008), and higher CTR (Rettie, Grandcolas, and McNeil 2004; Robinson, Wusocka, and Hand 2007). 3 Yet Cho (2003) and Drèze and Hussherr (2003) find no significant effect of ad size on engagement. They suggest that users learn to avoid looking at ads, even though the ads may affect them through their peripheral vision. These differing results perhaps suggest a tension between the ability of large ads to attract attention and their more intrusive nature that leads to avoidance. Thus, the problem needs more study, with a focus on both the research methods and the ad context (e.g., type of products/websites).
Not surprisingly, given its interest in ensuring continued growth of digital advertising, DoubleClick (2009) also reports that CTRs for large ads (300 × 600 and 240 × 400) were three times greater in their study than those for smaller ad formats.
The Impact of Animation
Experiments, in contrast, have confirmed that animation in banner ads can attract users’ attention and increase engagement. For example, Li and Bukovac (1999) find that users are able to quickly identify and better recall animated banner ads than static banner ads. Cho, Lee, and Tharp (2001) show that a higher degree of forced exposure to animated banner ads yields higher CTRs and more favorable attitudes among users. Animation has also been associated with greater clicking behavior in econometric studies (Hong, Thong, and Tam 2007; Lohtia, Donthu, and Hershberger 2003; Tsang and Tse 2005). These studies propose that when consumers have not decided on the items they want, they are more likely to click on animated ads because these ads may lead them to attribute a higher quality to the advertised products or pay greater attention. Similarly, other works have suggested that animation is more likely to be effective when user experience and brand familiarity are low (Dahlen 2001) or when users are searching for fun rather than for specific information (Tuten, Bosnjak, and Bandilla 2000).
Impact of Ad Content
There have been several major studies on the effects of ad creative or content in offline advertising, but there have been no major studies considering these effects in digital ads. For example, MacInnis, Rao, and Weiss (2002) find in a study of TV commercials that emotional content is more likely to increase sales and that ads that use rational appeal are less likely to produce increases. Chandy et al. (2001) study the effects of advertising on sales across multiple creatives. While they find many creative executions to be ineffective in increasing sales, they confirm that emotional ads are more effective in mature markets and argument-based appeals more effective in newer markets. Similarly, Bass et al. (2007) find that rational ads wear out faster than emotional ads: for example, in their data, price advertising has the highest wear-out among all appeals. Still, in the digital space evidence about the role of ad content is still emerging. Chtourou, Chandon, and Zollinger (2002) suggest that banner ads with promotional incentives have higher CTRs than those that lack incentive offers. Xie et al. (2004) also find evidence that incentive offers improve CTRs but that the effect varies by the type of appeal (rational vs. emotional). Thus, for example, in their study, banners with positive emotional appeals and incentive offers generated higher click-through than those with positive appeals and no incentives. Similarly, Hupfer and Grey (2005) show that banner ads that offer a free sample achieved higher click-through than banner ads with information only. Braun and Moe (2013) also find that the effects of creative content in banner ads can differ, even though their data do not ascribe substantive meaning to these contents. Nevertheless, taken together, these studies indicate the importance of ad content for digital media.
Impacts of Ad Targeting
The marketing literature has shown that more precise targeting can increase CTRs for banner ads (Briggs and Hollis 1997; Chandon, Chtourou, and Fortin 2003; Chatterjee, Hoffman, and Novak 2003; Sherman and Deighton 2001). For example, with regard to retail shopping, there is some evidence that women are more invested in the experience and thus more likely to spend more time browsing online; in contrast, men are more goal oriented (Passyn, Diriker, and Settle 2011), and for many product categories, women are the primary purchasers. Moreover, given current and exact technology, once consumers browse a firm's website, an ad network can use their browsing histories to serve that firm's banner ads to them when they the visit other sites. Research suggests that such retargeted ads are, on average, surprisingly ineffective unless the consumers’ preferences for products viewed earlier are well defined, that is, unless “they have a detailed view of what product they wish to purchase” (Lambrecht and Tucker 2013, p. 2). This suggests that retargeted ads that offer the consumer incentives to buy should, on average, be more effective than ads that merely provide nonprice information.
Carry-Over Rates for Different Media and Targets
Braun and Moe (2013) evaluate the carry-over effects of banner ads in a model designed to study effectiveness of creative content, where carry-over is the extent to which past impressions affect the contemporaneous effects of banner ads on response behavior (Bass et al. 2007). The study uses data across individuals to obtain a homogeneous estimate of carryover.
It is, however, well documented that the effects of advertising (and, thus, carry-over) can differ across channel, target markets and media. For example, Sethuraman, Tellis, and Briesch (2011) report, from a meta-analysis of 56 studies, that television advertising has higher short-term elasticity but lower long-term elasticity than print advertising. Berkowitz, Allaway, and D'Souza (2001) model weekly data from three stores of a large national retailer and find that the carry-over effect of radio is higher than that of billboards. Similarly, Naik and Raman (2003), in a study that considers media synergy, find that carry-over for television is approximately 2.5 times that of print. With regard to markets, the literature (Deighton, Henderson, and Neslin 1994; D'Souza and Rao 1995) have reported that advertising is more effective among consumers who are more loyal for experience than for search goods (Hoch and Ha 1986). Finally, Breuer, Brettel, and Engelen (2011) find in a study of online channels that e-mail advertising has a longer effect than banner advertising. This raises questions of how carry-over effects may vary across different online formats, animated and static ad types, and different targets. Our study provides some answers to these questions.
Dynamic Model of Digital Advertising
We now present a nonlinear, state-space model to track the effectiveness of online display ads over time, across digital formats and targets. The model adopts an observation equation in which daily clicks follow an event-count distribution (e.g., Poisson), extended however to allow for different forms of nonresponse (e.g., zero clicks), because it can be shown that the presence of zeros in count data may lead to overdispersion, where the variance of the count distribution exceeds its mean (Greene 1994). This and other forms of dispersion violate basic assumptions in the standard event-count models. The state equation, in contrast, assumes a model of advertising goodwill (Nerlove and Arrow 1962) in which goodwill evolves over time as a function of banner size, animation, ad targeting, and different thematic impressions (price and product). The natural thematic variation in the data allows for the identification of the effects of price and product ads. Moreover, we control for the potential endogeneity of targeted impressions because such impressions may covary with unobservable site content, format type, or clicking history.
First, in a dynamic model of display advertising, one has to account for presence of excess zeros (zero-inflation) because of the typical low level of response to digital ads. Here, one may observe zero clicks because online consumers are unaware of advertising impressions, or they are aware but choose not to respond for numerous reasons, many unobservable to the researcher. In the former case, we observe what is often termed “structural zeros,” which are inevitable; in the latter case, we observe “sampling zeros,” which occur at random; the two events emerge from potentially distinct data generating processes (e.g., Greene 1994; Lambert 1992).
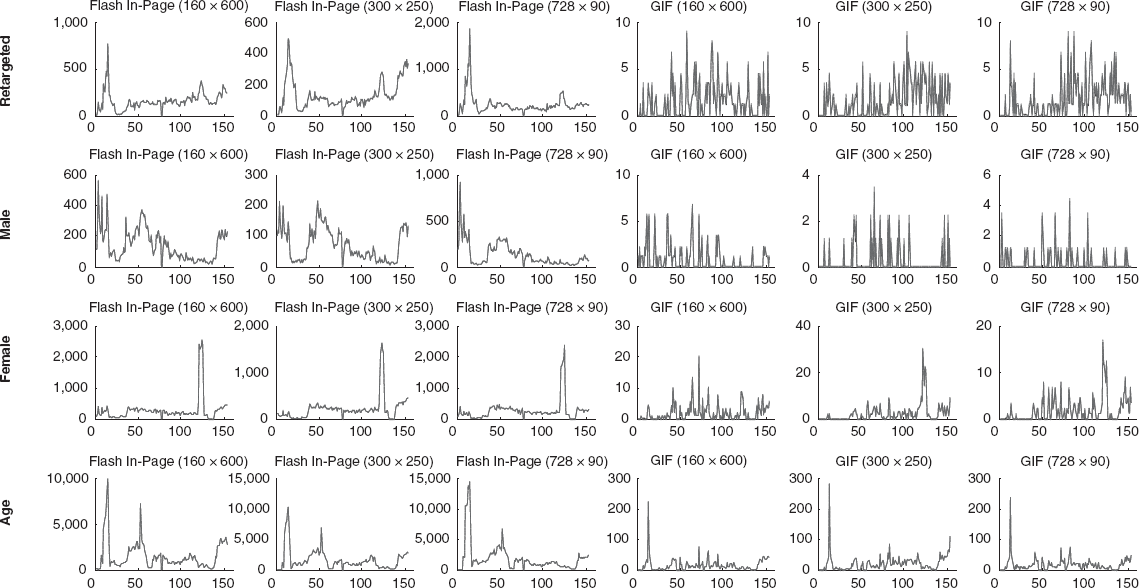
Let f(yijkt|λijkt) be the distribution for the random number of clicks yijkt during period t, for format i (flash or GIF), size j (728 × 90, 300 × 250, or 160 × 600) and target k with mean E(Yijkt) = λijkt. In Equation 1, we adopt the familiar Poisson count distribution (Poisson-P); in a later section, we consider a linear model and other count models, including the negative binomial and the zero hurdle models:

As just described, we may observe zero clicks under distinct data-generating processes: we may observe structural zeros when, say, impressions go unnoticed, or randomly as a count event from Equation 1. Suppose pijkt is the probability of observing structural zero clicks for format I, size J, and target k; and, conversely, supposed 1 – pijkt is the probability that click-through occurs at some rate λijkt, with I(Yijkt = 0) an indicator function; then the distribution of clicks is the following:


Note that Equations 2 and 3 can be viewed as a two-component mixture of an ordinary count distribution f(yijkt|λijkt) and a degenerate distribution having a point mass at zero; that is, the probability of no response, π(Yijkt = 0), is a weighted average of both outcomes described previously. Note here the standard Poisson count model (obtained when pijk = 0) is fully embedded in Equations 2 and 3. Finally, let cijkt be a dichotomous variable that indicates whether the observed response (i.e., nonresponse) comes from the degenerate (cijkt = 1) or randomly from the ordinary event-count component (cijkt = 0). We propose a simple hierarchical model for cijkt, where cijkt ~ Bernoulli(pijk) and the probability pijk of the degenerate event has the logistic transformation pijk = [1 + exp(−γijk)]–1. Therefore, Equations 1–3 constitute a zero-inflated Poisson (Greene 1994; Lambert 1992); it is the most widely applied technique for addressing overdispersion in count data. Finally, the log-likelihood contribution from a single format and target in the Poisson case is therefore the following:

Given the preceding familiar framework, we can now develop a model to study the dynamic effects of advertising throughout a digital campaign. For instance, one may ask whether online ads exhibit carry-over similar to offline ads, and if they do, whether carry-over varies by digital media format and target. That is, does a consumer's decision to click on an ad at time t depend not only on the current impression but also on past, or carry-over, impressions? One could assess, too, whether some formats are better for different thematic impressions—specifically, whether incentive-based messages are better for retargeting—and assess the impact of size and animation on digital ad effectiveness. To do this, we employ a flexible state-space model, wherein unobservable mean clicks λijkt in Equations 1–4 evolve over time in the following multiplicative way:

where goodwill is log of the latent mean clicks, gijkt = log(λijkt), and
= goodwill of ads in format i (Flash or GIF), size j, target k at time t;
= a function of ad impression aijklt in format i, size j, target k, theme l at time t; 4
The estimation uses a semilog transformation:
= effectiveness of impression in format i, size j, target k, theme l;
= carry-over rate in format i, size j, target k;
= fixed effect of animation in Flash ads in target k;
= fixed effect of size across Flash and GIF ads in target k; and
= mean-zero, normal error for format i, size j, target k.
Thus, with log-link gijkt = log(λijkt), Equation 5 is the familiar discrete-time goodwill model due to Nerlove–Arrow. That is, one assumes that goodwill gijkt decays in proportion to prior goodwill gijkt–1 and is sustained here by an additive function of advertising exposures
Yet more likely sources of endogeneity in ad impressions,


where
That is, Equations 6–7 model impressions (
The population R2 values from the regression of log(1 + ad impression) against these instruments range from .63 to .73 across the four consumer targets (see Web Appendix for further assessment of our instruments).
In summary, we propose a model to investigate the effects of digital ads served across multiple formats, messages, and targeted consumer segments over time. The model has three major components: a nonlinear model of ad response that accounts for the presence of zeros in event-count data; a model of ad dynamics that links impressions and targeting decisions to ad response; and a linear measurement model that controls for endogeneity in ad impressions. The model can address several questions about the duration of advertising across digital formats, including whether some formats and retargeting strategies are more effective with price-based incentives and what the impact of size and animation are on digital ad effectiveness. First, however, we must develop an estimation scheme, whose primary challenge will be to recover time-varying vectors that include both linear and nonlinear components.
Estimation and Inference
We adopt a Bayesian approach to estimation because of its versatility and our need to evaluate nonlinear, nonnormal state-space parameters. With few exceptions (e.g., Lopes et al. 2010), the Bayesian approach to such problems relies on conditional independence to iteratively sample a sequence of conditional posteriors (for the fixed and time-varying parameters) rather than sample directly from their intractable joint (Doucet, De Freitas, and Gordon 2001). How, then, does conditional independence help resolve our estimation problem defined by Equations 1–7? First, consider our essential task: to recover a joint, but intractable, posterior p(θt,
In contrast, the conditional posterior p(
Choosing an Importance Function
In many applications of the particle filter, the chosen importance function is the transition density (Equation 5) because it is simple and readily available from the model. Yet we know that particle filter algorithms that use this (prior) importance function often suffer from the degeneracy problem; that is, the variance of the importance weights increases over time. Intuitively, if the data are very informative (i.e., the variance of data distribution is very small), the algorithm would waste many samples and time by exploring regions of low importance. To make the method more effective, Doucet, De Freitas, and Gordon (2001) and Liu and Chen (1998) suggest importance functions of the form p(

where l(gt) = ln p(yt|

We can obtain the mode

Data and Identification
Recall that our substantive aim is to explore how central features of digital ads affect consumer engagement over time. Thus, to identify the cross-sectional and temporal features of the problem, we acquired panel data from a major U.S. retailer in an industry that provides products and services for the home. The data contain daily ad impressions served via an ad network, as well as the resulting clicks. Both sets of data are disaggregated by target, format, and message and cover a period of T = 154 days, from February 14, 2011, to July 17, 2011. In this campaign, the retailer targeted four broad segments, one behavioral (retargeted) and three demographic (male, female, age); and employed two ad formats, Flash (animated) and GIF (static). Flash ads appear as a sequence of four to eight time-delayed images, with the last image identical to the corresponding static GIF image. Flash ads not only include colorful, attractive animation but also deliver a longer message than GIF ads. There are also three standard size–orientation combinations for ads: 728 × 90 (“leaderboard”), 160 × 600 (“skyscraper”), and 300 × 250 (“box”) (see Figure 1). The retailer categorizes ads as price messages if they mention prices or price discounts and as product messages if they convey product attributes without reference to price. Finally, the ad network serves blank impressions (white spaces) to non-U.S. consumers to preclude them from viewing the ads. The network serves product offer and control impressions exclusively in Flash and GIF formats, respectively.

Digital Ad Formats
Model identification thus draws on a balanced panel of 24 time series (24 = 4 targets × 2 formats [Flash, GIF] × 3 sizes) each of length T = 154. How does this panel help identify our substantive parameters, the effect of ads across formats, messages, and targets? First, we have day-to-day variations in clicks and their associated impressions within each of the 24 target–format time series, with the impressions in each series further classified into price and product messages for Flash ads and price and control messages for GIF ads. Moreover, the correlation between impression pairs (price/product and price/control) in our sample is low (median = .0378); that is, there is daily variations in the number of impressions served for each theme such that comovement is negligible. This natural thematic variation (Schumann and Clemons 1989) allows one to recover the separate effects of price, product, and control impression on click response in each of the 24 target–format (time series) combinations.
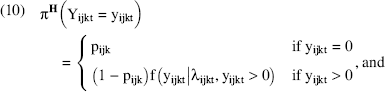
Table 1 provides summary statistics for the data. We see that the average total number of clicks for Flash ads is about 100 times more than clicks for GIF ads, across all ad sizes and targets. Within the Flash ads, the leaderboard ads generate the highest average number of clicks, whereas the box ads have the lowest average. The average total number of clicks within the age segment is considerably higher than clicks within the other three segments. Quick calculations show that the firm serves about 40% product ad impressions and 60% price ad impressions. Nearly 59% of the retailer's ads are served to the age target segment; the remaining impressions are served to the retargeted (17%), male (8%), and female (16%) segments. Figure 2 plots time series of clicks for T = 154 across the formats. Note the spikes in the numbers of clicks around period 10; these occurred during the early spring, when consumers are interested in home improvement projects as winter is ending. Ad messages here offer specific promotions that take advantage of this interest. 6 Figure 3 summarizes the data across formats and targets.
We provide evidence in the Web Appendix that the spike, which could induce endogeneity and as a result overstate advertising effects, is not a problem in this sample. We thank the Associate Editor for suggesting this additional analysis and discussion.
Data Summary by AD Targets (Means)

“International” refers to blank impressions (white spaces) served in the place of ads to exclude consumers in overseas markets.
Notes: T = 154 days.

Clicks by AD Formats

Clicks by AD Formats and Targets
Table 2 compares the CTRs for different formats and ad sizes, across consumer targets. Flash ads presented to remarketing clickers in the GIF (300 × 250) format have the highest average CTR of .14%, suggesting GIF ads can be effective in some context. Nevertheless, these CTRs are very low, as expected. For example, the Hash ads have an average total CTR that ranges from .05% to .057%; CTR values for similar GIF ads range from .013% to .059%, if one ignores clicks from the large percentage of blank impressions served to non-U.S. visitors (McConnell 2012).
CTR (%) by Media Formats and AD Targets

CTR – price ads.
Notes: T = 154 days.
Estimation Results
Tables 3–7 display the results of our empirical analysis. Tables 3–5 report findings related to robustness checks and to the potential endogeneity of ad impressions. Tables 6 and 7 report estimates of the main parameters of the proposed model (dynamic zero-inflated Poisson; DZIP). Significance estimates in boldface are estimates whose 95% highest posterior density interval (HPDI) excludes zero. What follows are, first, reviews of the robustness and endogeneity results; next, reviews of results (Tables 6–7) related to the effects of ad format, carry-over, and message content across the four consumer targets in the study; and finally, a brief summary of the main conclusions.
Alternative Models

Effect of Product Contextual Variables on Impressions

Notes: Boldface indicates values for which the 95% HPDI excludes zero.
Measurement Model: Correlations with Goodwill Error

“International” refers to blank impressions (white spaces) served in the place of ads to exclude consumers in overseas markets.
Notes: Boldface indicates values for which the 95% HPDI excludes zero.
Estimates From Proposed Model by Formats, Messages, and AD Targets
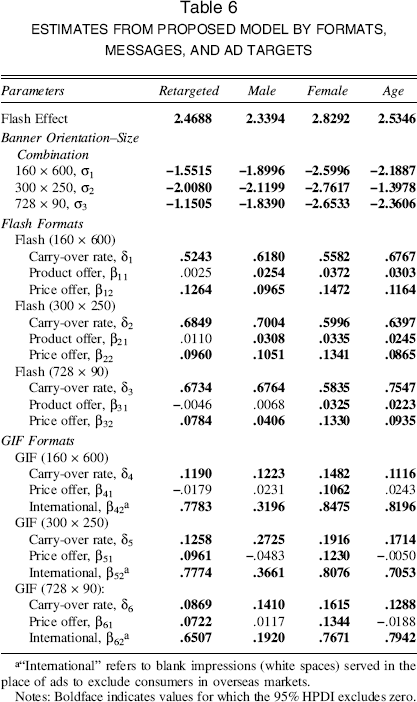
“International” refers to blank impressions (white spaces) served in the place of ads to exclude consumers in overseas markets.
Notes: Boldface indicates values for which the 95% HPDI excludes zero.
90% Depreciation and AD Elasticity

Notes: Boldface indicates values for which the 95% HPDI excludes zero. Elasticity evaluated at posterior draws; elasticity = (∂λ/∂a)(a/λ) = aβf′(a)/(1–δ).
Model Selection
Table 3 compares the proposed DZIP model to seven alternative models, including the normal dynamic linear model (NDLM) and alternative count models—specifically, variants of the zero hurdle and negative binomial models, respectively:

Note the proposed DZIP model dominates all alternatives, as indicated by its deviance information criterion (DIC) value. The DIC and similar model selection methods (Akaike information criterion [AIC] and Bayesian information criterion [BIC]) include penalty terms to offset gains in model fit due solely to added complexity, since more complex models with more parameters generally provide better fit. For Bayesian hierarchical models, however, the number of parameters is less clear. Spiegelhalter et al. (2002) propose the DIC to address this uncertain complexity in Bayesian hierarchical models (e.g., Equation 5). With the DIC, then, the worst model (Model 8) is the NDLM; this confirms that here, a normal approximation to the distribution of the data (clicks) is inappropriate. The negative binomial models also perform poorly relative to Poisson models, and among the latter, the DZIP model dominates. Thus, we show that it is important to consider the dynamic effects of digital ads as well as to control for overdispersion. Finally, Figure 4 shows the fit of the DZIP model by plotting its posterior mean (λijkt) against the actual number of daily clicks for different formats and targets. The proposed model fits the data quite well.
Clicks Vs. Posterior Means by AD Formats and Targets
Endogeneity of Impressions
Tables 4 and 5 show the results of an analysis into the potential endogeneity of ad impressions. In implementation, this means controlling for the potential comovement of the measurement (
Animated versus Statics Display Ads
Tables 6 and 7 report estimates from the proposed DZIP model. First, Table 6 shows that Flash ads have significantly more average clicks than GIF ads, as seen by the fixed effect of Flash ads, supporting the notion that animation can foster engagement (Li and Bukovac 1999). These results are consistent across all consumer targets. Recall that the dependent parameter in Equation 5 is the log-link, log(λijkt); thus, the effectiveness of Flash ads across retargeted, male, female, and age segments is 11.8, 10.4, 16.9, and 12.6 times (respectively) that of similar GIF ads, ceteris paribus. These results reflect the much greater sparsity of click response to GIF ads (Table 1). The effects of orientation–size combinations (exp(σik)) across segments are significant too, but their relative effects on engagement are mixed, as predicted (e.g., Chandon, Chtourou, and Fortin 2003; Cho 2003). For example, box ads are most effective in the age segment, but leaderboard ads are most effective among retargeted consumers, and all are equally effective among women. The latter result seems to support the prediction that female retail shoppers are more likely to browse (e.g., Passyn, Diriker, and Settle 2011).
Carry-Over Effects
Carry-over rates for Flash (GIF) ads are significant across the four segments (Table 6), with values ranging from .52 to .75 (.09 to .27). Thus, animated banner ads have significantly higher carry-over rates than GIF ads, across consumer segments and size–orientation combinations. The increase in carry-over rates is roughly three to five times greater when one uses animated ads rather than static ads, across targets and formats. These results seem consistent with Naik and Raman (2003), who find that carry-over for TV (animated) is approximately 2.5 times that of static print. Thus, in our study, animated ads have the potential to engage consumers for longer periods. To make this result more concrete, we computed the 90% duration for each format and target (D90 days), that is, the number of days it takes for an ad to lose 90% of its effect. Thus, in Table 7, the average D90 across the four segments ranges from 4.8 to 9.4 days for Flash ads, while it is approximately 2.2–3.1 days for GIF ads. Similarly, in Table 7, the mean ad elasticity (calculated using the posterior draws) for Flash ads ranges from .2412 to .3708, whereas the range for GIF ads is .0682 to .1595.
Price- versus Product-Based Messages
Consider now the effects of product-based and price incentive–based messages—specifically, how these effects vary across creative formats and targeted consumer segments. Table 6 reports the immediate, or short-term, effects βijk of ads by themes, across formats and sizes, and among different consumers. From these results, we can see that price ads are more effective than product ads within the Flash format, in all sizes and target markets; this result builds on evidence that price incentives can motivate engagement (Chtourou, Chandon, and Zollinger 2002; Hupfer and Grey 2005; Xie et al. 2004). Product ads, nevertheless, are still effective in the male, female, and age segments across all size–orientation combinations (with one exception: leaderboard ads among men); although these effects differ marginally, they are on average highest among targeted women (.0325, .0335, and .0372, for 728 × 90, 300 × 250, and 150 × 600 Flash ads, respectively; see Table 6), whom retailing studies predict to be more engaged shoppers. Yet product ads are ineffective among retargeted consumers, while, in contrast, price ads in Flash format that are otherwise similar are effective in all segments, even among retargeted consumers. Recall that evidence suggests that retargeted ads are ineffective unless served to consumers who have well-defined preferences, such that they are willing to purchase (Lambrecht and Tucker 2013). Thus, our finding suggests that when retargeting consumers, one should also recognize that price incentives can be useful in making ads more effective by addressing consumer willingness to pay.
The discussion, hitherto, has reviewed the effects of Flash ads; earlier, we reported that, ceteris paribus, Flash ads garner more engagement than GIF ads. Table 6, however, shows that static GIF ads with price offer messages can be effective among retargeted and female shoppers. Furthermore, while price ads are more effective in generating engagement in the Flash than in the GIF format for the male and age segments (Li and Bukovac 1999), price ads are equally effective for GIF and Flash among women and the retargeted. Finally, we note the parameters for international GIF ads (e.g., β42). Recall that because this campaign targets U.S. consumers, the ad server sends blank impressions to non-U.S. consumers. Nevertheless, these consumers may still click on blank images, usually from curiosity (e.g., when blank ads are visually salient; Wedel and Pieters 2008) but also in error (McConnell 2012). As a result, the parameters that capture the effects of these clicks are large and significant. While these measures have no managerial interpretation in terms of ad content, they do show how the tactic of serving blanks can distort naive measures of campaign effectiveness (e.g., CTR).
In summary, Tables 6–7 help reveal the workings of digital ads. For instance, in our sample, animated ads are more effective than static ads and have longer duration. There is also heterogeneity in the performance of banner ads across formats, messages, and targets. For example, within the Flash format, price ads are more effective in generating engagement than product ads in all three size–orientation combinations and all four target markets defined in this study. Product ads, in contrast, are ineffective among retargeted consumers. Thus, retargeted consumers are less likely to engage when ads exclude price incentives. Finally, although Flash ads engage more consumers than GIF ads, they are still effective for engaging retargeted and female consumers; the latter consumers are seemingly more willing to engage with ads of all formats and messages.
Robustness Check of Results
As a final step, we investigate the robustness of our findings by comparing them with results from five (simpler) variations of the proposed model (see the Web Appendix):
Model A: a linear state-space model (NDLM) with click data on original scale;
Model B: a log-linear state-space model with click data log-transformed;
Model C: a dynamic Poisson model without endogeneity or zero inflation;
Model D: a static Poisson model without endogeneity or zero inflation;
Model E: a dynamic negative binomial without endogeneity or zero inflation.
Notably, results from the generalized linear models (GLMs) (Models C, D, and E) are more consistent with the results from the proposed model (Table 3; Tables S1–S5 in the Web Appendix). The NDLM, by contrast reports mixed findings for Flash and size effects. That is, in some cases, Flash ads, on average, are no more effective at generating clicks than GIF ads, ceteris paribus. Similarly, the effects of some ad sizes are not significant. Although the log-linear Model B produces many results similar to the GLM findings, it too reports mixed results for the fixed effects of size and format. (We also estimated, but did not report, a square root–transformed data model and found conflicting evidence.) In general, we know that GLMs are better suited for count data, more so when they include zero observations; and log transformations are more effective when mean counts are large and overdispersion is small (e.g., O'Hara and Kotze 2010).
Reallocation Analysis
The final task of this study is to conduct a simulation that summarizes the import of the previous results. One approach is to see how these results influence the reallocation of ad impressions across the duration of the campaign. That is, given hyperparameters ζ, we solve a problem that reallocates the total ad impressions (bt) in each period across ad format (GIF, Flash), sizes, themes, and targets to maximize the total expected clicks (

where
Solved in Tomlab/SNOPT.
We thank the Associate Editor for this suggestion.
Table 8 shows the solution to Equation 12 with all hyperparameters ζ at their mean values. It reports, for target, digital format, and message, the actual number of impressions and the model-based prediction of the number of impressions needed to generate a higher number of clicks. Here, the model-based allocations generate approximately 17% more clicks than the current allocation. The results in Table 8 are largely consistent with findings discussed previously. Thus, overall, the model suggests a 19% decrease in number of impressions of product ads and a 13% increase in impressions of price ads. Much of this increase is attributable to the shift from product to price ads in the Flash format. Similarly, we observe higher impressions in the retargeted (21%) and female (5%) consumer segments. Consequently, the model recommends increases in static GIF (price) ad impressions, given that these were effective for retargeted and female consumers (Table 3). Finally, as a robustness check, we also solved Equation 12 over 1,000 random draws from the posterior, using a shorter period, given the computational complexity of solving Equation 12. The results, reported in the Web Appendix, are consistent with results in Table 8.
Allocations: Actual and Model-Based Impressions
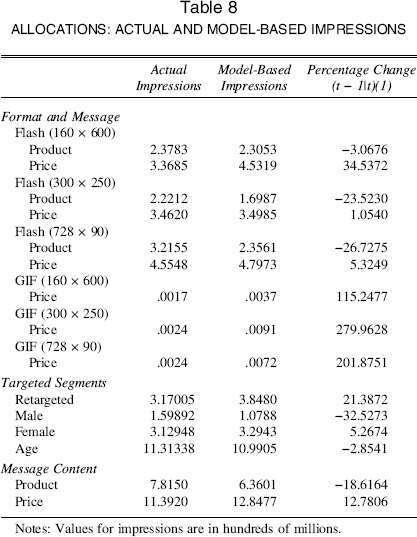
Notes: Values for impressions are in hundreds of millions.
Conclusion
This study explores how the performance of digital ads is influenced by the joint effects of creative format, message content, and targeting as well as retargeting. Its goal is to reveal how central features of a digital campaign affect consumer engagement over time. The study accomplishes this by constructing a dynamic model and estimating it using a panel data set obtained from a major U.S. retailer. Formally, it proposes a dynamic (state-space) zero-inflated count model (Poisson), given the potential for zero inflation and temporal correlation in count series. The resulting model is both dynamic and nonlinear; therefore, we estimate it using a combination of particle filtering and MCMC. The resulting algorithm provides one approach to estimating any state-space model within the exponential family, and it is more flexible than Gaussian filters such as the extended and the unscented Kalman filters. The estimation also allows for endogeneity in ad impressions, possibly due to unobserved context of the publisher's site.
The study finds a number of substantive results. First, animated ads had significantly higher carryover effects and thus affected engagement over a longer duration than static ads, in all ad formats and among both targeted and retargeted consumers. Second, among animated formats, price ads were more effective than product ads. Third, retargeted ads were effective only when they offered price incentives, a finding consistent with Lambrecht and Tucker (2013), who find retargeted ads to be effective only when consumers have strong preferences such that they have incentives to buy. Ours is a useful result because it suggests that price sensitivity (perhaps more observable than consumer preferences) could help select retargeted consumers for engagement. Third, although Flash ads were more effective at engaging consumers, simpler static GIF ads could also be effective; in our case, they were effective for price ads served to retargeted and female consumers. Finally, note that all the retailer's ads (i.e., all formats and messages) targeted to the female segment were effective; this suggests that female shoppers were largely more willing to engage, perhaps confirming the axiom from brick-and-mortar studies that “women shop; men buy.”
Still, the work has a few potential limitations that could be addressed in the future. First, some of our findings may not generalize to other contexts. For example, the gender effects we note may have arisen because of the match between the retailer's product category and gender. Similarly, our data come from a single (albeit major) retailer, so, given recent findings (e.g., Li and Kannan 2014), we would be reluctant to generalize these results to other industries or smaller firms. Second, we estimate the model with daily but aggregate data, at the level of target, message, and format; our method lacks features such as those of exploration and exploitation embedded in sequential experiments (e.g., Thompson sampling). Yet ad networks commonly release such data to their clients, and it is in these cases that our method is most applicable. Individual data nevertheless could obviate some of the endogeneity issues we address statistically, but there are challenges to estimating dynamics at the individual/cookie level. For example, one would be required to estimate a large number of parameters from sparse data; although the data will contain many individuals, many of these will be unique or onetime visitors. To address this sparseness problem, one could perhaps build a hierarchical dynamic model using demographics and retargeting data (Agarwal 2010) to define segment-level distributions from which individual behavior could arise. Notably, in this case, the substantive parameters would again be at the segment level. Finally, although our model fits the data satisfactorily, another potential criticism, given the full Bayesian approach, is that we adopt standard parametric assumptions for all model components, for example, normal random noise in the state equation (Equation 5). To mitigate this criticism, one could model errors as Gaussian mixtures or take a fully Bayesian nonparametric approach in which the distributions of the errors are themselves unknown and treated as objects to be estimated (Hjort et al. 2010; Phadia 2013). Again, a nonparametric approach could be more feasible at the segment level, given data sparseness at the cookie level.
Footnotes
Overview of MCMC Algorithm
This appendix provides an overview of the MCMC algorithm we employ to recover both time-varying (
References
Supplementary Material
Please find the following supplemental material available below.
For Open Access articles published under a Creative Commons License, all supplemental material carries the same license as the article it is associated with.
For non-Open Access articles published, all supplemental material carries a non-exclusive license, and permission requests for re-use of supplemental material or any part of supplemental material shall be sent directly to the copyright owner as specified in the copyright notice associated with the article.