
Abstract
Public policy makers seek to enhance disclosure of firms’ sustainability performance, yet firms debate about whether, or to what extent, they should engage in sustainability reporting. This article seeks to advance current understanding about the business returns to sustainability reporting by examining the short- and long-term investor reactions. Through an event study, this research documents significant short-term stock market reaction to the release of sustainability reports. In particular, abnormal stock returns around the release of such reports are positively related to firm sustainability performance, and this positive link is smaller for firms in a strong information environment. The results show that over the long term, relative to nonreporting firms, firms that release sustainability reports enjoy higher value relevance of sustainability performance. These findings suggest that sustainability reports enhance information transparency and allow investors to incorporate sustainability information in stock valuation. This study provides strong evidence for the business case of sustainability reporting, and offers important implications for public policy makers in terms of devising policies and regulations to promote sustainability reporting.
Keywords
A key vehicle through which sustainability performance is communicated to multiple stakeholders is the firm's sustainability report. 1 The number of firms issuing sustainability reports has grown dramatically over the years (Dhaliwal et al. 2011; Tschopp and Huefner 2015); according to the Governance & Accountability Institute (Boerner 2014), 72% of the S&P 500 companies published sustainability reports in 2013, compared with less than 20% in 2011. A firm's sustainability report, ranging from several dozens to several hundred pages in length, comprehensively details its nonfinancial performance with qualitative and quantitative information (e.g., interviews, case studies, key performance indicators, tables, graphs, and statistics), covering key environmental, social, and governance-related dimensions (Perrini 2006). 2 Such a report is critical to sustainability disclosure as it provides far greater depth and breadth in conveying a firm's overall sustainability performance than alternative methods of sustainability communication (e.g., advertising, communication on corporate websites, individual social/environmental data disclosure; Dhaliwal et al. 2011; KPMG 2013, 2016). From a public policy angle, a comprehensive, in-depth, and well-structured sustainability report, as compared to numerous scattered and disintegrated filings, would streamline the process of monitoring and information acquisition by key stakeholders.
Various terms are used to refer to company reports that communicate social and environmental performance, such as sustainability reports, corporate responsibility/citizenship reports, corporate social responsibility reports, and so on. For simplicity, we use the term “sustainability reports” to broadly refer to these reports.
For example, Bank of America's 2011 sustainability report has 13 chapters and 122 pages, covering issues ranging from the company's global workforce, responsible business practices (e.g., socially responsible investment, risk management), investment and charitable giving (to fuel economic growth in local and global communities), and environmental initiatives, to employee leadership development and volunteering, diversity and inclusion, and the company's support of arts and culture around the world. Furthermore, the report provides numerous case studies, tables, graphs, and statistics to show specific social/environmental impact and performance trends.
However, there is considerable ambivalence, particularly among U.S. firms, regarding the production of such reports. Proponents argue that issuing a sustainability report can build trust and lead to better risk management and higher stakeholder loyalty (KPMG 2013). In contrast, critics say that preparing these reports is complex, requires substantial financial and human resources, yet there is no clear evidence that stakeholders pay attention to, or care about, these reports (Cone Communications 2015; Van Wensen et al. 2011). This debate is underscored by unclear anecdotal evidence: whereas the Gap gained 2.7% daily abnormal return on the day it released its sustainability report in August 2011, Coca-Cola saw its share price plummet, with a −3.55% daily abnormal return, on the day its sustainability report came out in October 2008. 3 Thus, a clearer understanding of the business returns to sustainability reports would help firms make more informed decisions on this issue, and, invaluably, allow policy makers to appropriately incentivize firms to do so. If indeed there are business returns to publishing sustainability reports, policy makers would have far better leverage in closing the disclosure gap by showing the “carrot” rather than just the “stick.”
Such divergent stock market reaction is likely caused by information in these reports: Coca-Cola's report revealed unsatisfactory performance on several key social dimensions such as associate health and safety, health and nutrition, and responsible marketing, while Gap's report detailed the company's substantial progress and positive performance in areas including factory conditions and monitoring, environmental stewardship, and employee diversity and wellness benefits. Third-party KLD ratings of these two companies confirmed their respective sustainability performances: Coca-Cola has 11 strengths (i.e., positive performance) and 12 concerns (i.e., negative performance) in 2008, whereas Gap has 15 strengths and 3 concerns in 2011.
This article focuses on the business case for sustainability reporting by examining both the short- and long-term reactions of a pivotal stakeholder group, investors, to sustainability reports. Specifically, we draw upon multidisciplinary streams of literature on sustainability (Brown and Dacin 1997; Joireman et al. 2015; Luo and Bhattacharya 2006; Raghubir et al. 2010), marketing communication (Osinga et al. 2011; Vakratsas and Ambler 1999), and information disclosure (Healy and Palepu 2001) to argue and show, through an event study, that sustainability reports released by companies are likely to have a significant immediate impact on investors (i.e., abnormal stock returns). Further, the impact of sustainability reports in terms of abnormal stock returns is smaller for firms that communicate their sustainability information through alternative channels prior to the release of reports (i.e., a strong information environment). Finally, and importantly, we show that the impact of such sustainability reporting on stock prices occurs not just in the short run but also in the longer run, producing higher value relevance (i.e., the extent to which stock prices are associated with sustainability performance) of sustainability performance for firms that release sustainability reports.
In demonstrating these relationships, this article makes three key contributions. First, it contributes to the marketing–public policy interface by demonstrating the effectiveness of sustainability reports in reducing information asymmetry between the firm and its stakeholders. Our results suggest that the sustainability report is a critical vehicle for disclosing nonfinancial sustainability performance of a firm, pointing to the synergistic ability of such reports to meet the needs of both the marketers (i.e., procompany outcomes) and public policy makers (i.e., high-quality sustainability disclosure). Regulators and policy makers should use these findings to incentivize firms, particularly those with superior sustainability performance operating in a weak information environment, to not only initiate but also continuously engage in the practice of publishing sustainability reports. Such market-based incentives will complement mandatory reporting requirements to ensure higher firm compliance on sustainability disclosure as well as higher-quality disclosure.
Second, we contribute to the literature on sustainability communication. Prior research, mostly focusing on consumer reactions to sustainability advertising, suggests that stakeholders can be indifferent to, or even skeptical of, firm-generated sustainability communication (e.g., Du, Bhattacharya, and Sen 2010; Wagner, Lutz, and Weitz 2009; Yoon, Gürhan-Canli, and Schwarz 2006). This study differs from prior research by examining how another key stakeholder group, investors, react to sustainability reports—an increasingly important yet underexamined method of sustainability communication. To the best of our knowledge, this is the first study that directly examines investor reactions to sustainability reports. Investors, due to their vested interests in the short- and long-term financial performance of the firm, are likely to pay attention to sustainability reports because they might contain value-relevant information (Dhaliwal et al. 2011). Our results suggest that investors do pay attention to such communication and incorporate sustainability information in their stock price evaluations. Thus, this finding highlights the importance of considering stakeholder-specific and method-specific (i.e., sustainability reporting vs. other communication methods) factors when investigating the effects of sustainability communication.
Third, this research contributes to the broader sustainability literature by illuminating the business returns to sustainability and underscoring the critical importance of sustainability performance when examining stakeholder reactions. Specifically, our results suggest that for the stakeholder group of investors, it is the actual sustainability record, rather than the mere communication of it, that drives stakeholder reactions; investors reward companies that communicate superior sustainability performance. The results of this study provide compelling evidence for favorable stock market reactions to good sustainability performance. Given the powerful influence the stock market exerts on top executives (Currim, Lim, and Kim 2012), public policy makers should disseminate the results of our research to encourage wider and more active firm engagement in sustainability, fostering a more sustainable business climate.
Conceptual Background and Hypothesis Development
Sustainability, Firm Value, and Sustainability Reporting
Findings from academic research suggest that sustainability contributes to firm value. By engaging in social and environmentally friendly practices, firms can reap a variety of coveted marketing benefits, such as more favorable product evaluation and purchase behavior; greater customer trust, satisfaction, and loyalty; and increased brand equity (Brown and Dacin 1997; Sen, Du, and Bhattacharya 2016; Simmons and Becker-Olsen 2006; Torres et al. 2012). Furthermore, the goodwill generated from a positive sustainability performance can act as an “insurance policy,” mitigating the damage to a firm during times of negative events or crises (Godfrey, Merrill, and Hansen 2009; Joireman et al. 2015). Also important, the resource-based view of the firm suggests that a firm's sustainability programs enable it to develop new competencies and capabilities. By addressing social and environmental challenges, a firm is likely to cultivate a system-thinking mindset and a collaborative, forward-looking corporate culture, and overall to stimulate organizational learning and innovation (Luo and Du 2015).
Firms utilize various methods to communicate their sustainability activities, such as advertising, information disclosure on corporate websites and in annual reports, sustainability reports, and other mandatory or voluntary individual filings. Among these methods, sustainability reports are unique in that they contain comprehensive and in-depth information about firm sustainability performance in all key domains (Dhaliwal et al. 2011; KPMG 2013; Perrini 2006), thus providing a one-stop source of sustainability-related information for regulators and other key stakeholders. The number of firms releasing sustainability reports has increased dramatically across the globe (KPMG 2013; Tschopp and Huefner 2015). Furthermore, to increase the disclosure quality and credibility of sustainability reports, more and more firms are voluntarily adopting standard reporting guidelines, such as the Global Reporting Initiative (GRI) standards (Tschopp and Huefner 2015), as well as having their reports independently assured (KPMG 2013; Simnett, Vanstraelen, and Chua 2009).
Short-Term Effect of Sustainability Reporting
Overall Stock Market Reactions
One litmus test for whether sustainability reports have value (e.g., providing new information, enhancing transparency) is to examine stock market reaction to the release of such reports. The existence of significant market reaction (i.e., abnormal stock returns) would suggest that investors are using new (i.e., previously unknown to the market) information from the report and integrating it in their stock valuation. Dhaliwal et al. (2011) find that inaugural sustainability reports reduce cost of equity capital for firms with superior social responsibility performance. In another study by Dhaliwal et al. (2012), they find that issuance of sustainability reports (both inaugural and subsequent ones) is positively associated with the accuracy of analyst earnings forecasts, suggesting that analysts use information from sustainability reports to improve their forecast accuracy. However, these prior studies do not examine the critical question of whether stock prices themselves change as the result of sustainability reporting (i.e., the information content of the report).
We expect that a firm's release of a sustainability report will trigger a stock market reaction through two mechanisms, investor attention effect and new information effect on the firm's sustainability performance. Sustainability performance refers to a firm's overall performance related to its activities in environmental, social (e.g., diversity, community outreach, human rights), and corporate governance–related domains relative to those of its competitors in the industry; this metric has often been assessed in prior studies using ratings from databases such as KLD (Dhaliwal et al. 2011). Specifically, sustainability reporting will attract investor attention to a firm's sustainability performance. Prior research on marketing communication suggests that advertising attracts investor attention and affects a firm's stock returns (Osinga et al. 2011; Srinivasan and Hanssens 2009). Lou (2014) finds that increased advertising expenditure is associated with individual investor buying and a contemporaneous rise in abnormal stock returns. By a similar logic, release of a sustainability report represents a firm's high-profile effort to communicate its sustainability performance and will likely increase investor attention to this important, value-relevant aspect of firm performance.
Second, release of a sustainability report communicates new information about a firm's sustainability performance, potentially altering investors’ stock valuation of the firm. A firm's sustainability report provides comprehensive and in-depth coverage about a firm's sustainability performance in a well-structured and factual manner (e.g., key performance indicators on carbon dioxide emissions, number of work-related injuries), enabling investors to gain new insights about the firm's nonfinancial performance. Further, the narratives in sustainability reports provide incrementally new information by shedding light on important, yet less quantifiable, aspects of a firm's sustainability strategy and trends, such as senior management's level of commitment to sustainability, strategic priorities of sustainability initiatives in the context of the firm's business, and firm-specific synergies between nonfinancial and financial performance (KPMG 2013; Perrini 2006). Research shows that the narratives in financial reports, such as management discussion and analysis, provide incrementally useful information that clarifies and supplements financial statements, enabling investors to better predict future earnings and cash flows (Cole and Jones 2004). The narratives in sustainability reports serve similar functions. In summary, sustainability reports provide new, important information about a firm's sustainability performance (i.e., the new information effect).
Sustainability performance is value-relevant due to the variety of business benefits it can generate. Thus, the increased investor attention effect and the new information effect of a firm's sustainability report will change investors’ stock valuation of the firm, leading to abnormal returns, which are excess stock returns unexplained by market returns, firm size, and book-to-market ratio (Fama and French 1993) and thus are attributed to the release of a sustainability report. Notably, a firm's release of a sustainability report itself does not constitute good or bad news. For firms with superior sustainability performance (i.e., sustainability performance that is higher than the average of the peer firms in the same industry; Dhaliwal et al. 2011), sustainability reports are more likely to convey good news; as a result, more investors will pay attention to it and know more about its positive performance, thus leading to positive abnormal returns. In contrast, for firms with inferior sustainability performance (i.e., sustainability performance that is lower than the average of peer firms in the same industry), sustainability reports are more likely to communicate inadequate sustainability performance, thus leading to negative abnormal returns. The assumption that firms will disclose their sustainability performance truthfully and credibly in the sustainability report is supported by prior accounting research indicating that voluntary disclosure, such as sustainability reports, is generally credible (Healy and Palepu 2001). Therefore, we predict that abnormal stock returns are positively related to a firm's sustainability performance. H1: The abnormal stock returns around the release of sustainability reports are positively associated with firms’ sustainability performance.
Moderating Role of Information Environment in Stock Market Reactions
We next examine the moderating role of the information environment in the association between the abnormal returns and firm sustainability performance. Information environment is an important construct that captures the extent of overall corporate communication and reporting, information dissemination, and private information acquisition by stakeholders (Lang, Lins, and Miller 2003). Firms in a stronger information environment either initiate more corporate communication (e.g., advertising, PR, investor relations) or receive more coverage in the business press and have a larger analyst following. In prior literature, information environment has typically been assessed using firm size and level of institutional ownership (Beyer et al. 2010). Information environment is a critical factor in our context because it affects the marginal returns of publishing sustainability reports.
In general, there are decreasing returns to corporate communication: research on advertising shows that the positive effects of advertising on various outcomes (e.g., recall, purchase) diminish as total advertising level increases (Vakratsas and Ambler 1999). Similarly, the financial disclosure literature shows that as the extent of predisclosure information production and dissemination increases, stock market reaction to quarterly and annual earnings reports decreases (Atiase 1985; El-Gazzar 1998).
A firm's information environment is indicative of the amount of sustainability communication, if any, prior to the release of sustainability report. For example, research shows that firms in a strong information environment (e.g., large firms) are more likely to communicate sustainability performance on corporate websites, through advertising, or disclose their sustainability information regularly to institutional investors (Branco and Rodrigues 2008; Maignan and Ralston 2002). The efficient market hypothesis (Fama 1998) suggests that the stock market will quickly adjust to incorporate and reflect all available information. In other words, for a firm in a strong information environment, the stock price has already incorporated sustainability information released via other methods (e.g., corporate websites) prior to the firm's sustainability report, thus reducing the marginal effect of sustainability reporting and weakening the link between abnormal returns and sustainability performance. Specifically, the abnormal returns around the release of sustainability reports are due to increased investor attention to, and understanding of, a firm's sustainability performance that is attributable to sustainability reporting. For a firm in a stronger information environment (vs. a weaker environment), there is likely to be greater and more frequent sustainability communication (both from the corporate source and from third party sources) prior to the release of its sustainability report. Consequently, the marginal increase in the investor attention effect and the new information effect as the result of issuing a sustainability report is likely to be smaller for a firm in a stronger information environment, resulting in diminished stock market reaction to the release of its sustainability report. Therefore, H2: The relationship between the abnormal stock returns around a firm's release of a sustainability report and its sustainability performance is more positive for firms in a weaker information environment than those in a stronger information environment.
Long-Term Effect of Sustainability Reporting
In addition to the immediate, short-term abnormal stock returns, we expect sustainability reporting to provide long-term benefits by enhancing the value relevance of sustainability performance. Following prior literature (e.g., Aaker and Jacobson 2001; Aksoy et al. 2008), we define the value relevance of sustainability as the extent to which firm value is associated with sustainability performance.
Reporting will enhance the relationship between firm value and sustainability performance for at least two reasons. First, reporting will enhance the business value of sustainability. Since the business returns to sustainability (e.g., greater purchase, loyalty, reputation) are largely contingent upon stakeholder awareness of a firm's performance in this domain (Du, Bhattacharya, and Sen 2011; Peloza et al. 2012; Servaes and Tamayo 2013), the release of a sustainability report will increase stakeholder awareness of the firm's sustainability performance, thus enabling the firm to reap greater stakeholder-related business benefits. Furthermore, the endeavor of preparing and publishing a sustainability report helps firms identify sustainability-related opportunities and risks and manage their sustainability impacts in a way that is synergistic with their core business. What gets measured gets managed. Reporting is the process by which a firm systematically gathers and analyzes data it needs to cultivate long-term sustainability competence, thus contributing to a stronger link between sustainability and financial performance (KPMG 2013; Perrini 2006).
Second, research on financial disclosure suggests that the value relevance of an accounting item, such as earnings or expenses, depends on the information quality and salience of the item (Holthausen and Verrecchia 1988). Investors are more likely to pay attention to and understand a piece of information if it is presented in a transparent and salient manner. For example, an accounting item disclosed in the footnote to a balance sheet is less salient, and therefore has lower value relevance, than an equivalent accounting item recognized on the balance sheet (Yu 2013). Reporting increases the information quality and salience of a firm's sustainability performance by providing comprehensive and in-depth coverage of this performance and by making the report widely accessible. Firms typically issue press releases announcing the release of their sustainability reports and provide the latest report in its entirety on their website. Due to the increased quality and salience of sustainability information, investors will not only react to the release of sustainability reports in the short run (as argued in H1 and H2) but will also be better able to fully incorporate firm sustainability information into stock prices in the long run. Therefore, H3: Relative to nonreporting firms, reporting firms enjoy higher value relevance of sustainability performance (i.e., stronger positive relationship between sustainability performance and firm value).
Research Methodology
Measuring Short-Term Stock Market Reactions to the Release of Sustainability Reports
We use event study methodology to examine stock market reactions to the release of sustainability reports and perform multiple regressions to explain the cross-sectional differences in abnormal stock returns. We use the release date of a firm's sustainability report as the event date and calculate daily abnormal returns using the Fama–French three-factor model. We use the Fama–French model because market return, firm size, and the book-to-market ratio are important determinants of cross-sectional stock returns (Fama and French 1993); it is thus important to consider these three factors when estimating abnormal returns (Kothari and Warner 2007). Specifically, the following model is estimated for each firm during the 80-day estimation period from 100 trading days before the three-day event window (−1, 1) to 21 trading days before this window. We require at least 75 daily returns available in the estimation period.


To examine whether there exists significant stock market reaction to the release of a sustainability report unconditional on firm sustainability performance, we follow prior literature (e.g., Bushee, Jung, and Miller 2011; Cready and Hurtt 2002) and examine cumulative absolute abnormal returns (CABS_AR) and cumulative abnormal trading volume (CAVOL) during the event window.
Cumulative absolute abnormal returns for firm i (CABS_ARi) during the time window (t1, t2) are given by the following equation:
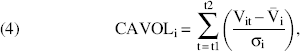
In addition to cumulative absolute abnormal returns, we examine cumulative abnormal trading volumes surrounding the announcement dates of sustainability reports. Such a volume-based metric provides additional support for, and increases the power of detecting, investor responses to an event (Cready and Hurtt 2002). We define cumulative abnormal trading volume for firm i (CAVOLi) based on the following model (e.g., Landsman and Maydew 2002):
To test H1 and H2, which predict the cross-sectional variations in abnormal stock returns around the release of sustainability reports, we look at signed abnormal returns and calculate firm-specific cumulative abnormal returns (CARi) as the sum of FFRit during the three-day event window (−1, 1). We use CARi based on the Fama–French model as the dependent variable in regression analysis for H1 and H2. We repeat our analyses by using buy-and-hold abnormal returns and abnormal returns based on the market model and the Carhart four-factor model (Carhart 1997). The regression results based on these alternative approaches are qualitatively similar to those based on CARi from the Fama–French model.
Measuring Firm Sustainability Performance
Data from KLD have been widely used in the prior literature to measure overall firm sustainability performance (e.g., Dhaliwal et al. 2011; Godfrey, Merrill, and Hansen 2009; Kacperczyk 2009; Servaes and Tamayo 2013; Waddock and Graves 1997). Since 2003, the KLD data set covers the 3,000 largest U.S. companies, providing firm sustainability information in the domains of environment, community, diversity, employee relations, product, human rights, and corporate governance; within each domain, there are performance ratings along key subdimensions, capturing both positive and negative performance (i.e., strengths and concerns, respectively). To arrive at the KLD ratings, independent rating experts apply the same set of criteria to related companies and use data gathered from a wide range of sources, both internal and external to the firm (Waddock and Graves 1997). Internal data sources for KLD ratings include stand-alone sustainability reports, annual questionnaire about sustainability practices, annual reports, and quarterly reports; external data sources include general business press (e.g., Business Week, The Wall Street Journal), trade magazines, regional Environmental Protection Agency newsletters, specialized periodicals such as Chronicles of Philanthropy, government surveys, and so on (Kacperczyk 2009; Waddock and Graves 1997).
We use KLD ratings as the proxy for overall sustainability performance conveyed by the reports in light of several considerations. First, unlike in a financial report (e.g., annual or quarterly earnings release), a summary measure is not readily available in a stand-alone sustainability report, due to the complex, multidimensional nature of sustainability performance and the quantitative and qualitative information embedded in the report; thus, a proxy is necessary. Second, like sustainability reports, KLD data cover all aspects of essential social and environmental domains and can convey a firm's overall sustainability performance. At the same time, KLD data provide numeric ratings for various aspects of social and environmental domains, thus making a quantitative summary rating for overall sustainability performance feasible. Third, sustainability reports are one of the key data sources for KLD ratings. Using 20 sustainability reports randomly selected from our sample, an independent research assistant coded firm sustainability performance following the KLD rating categories. The ratings by the research assistant, who had no knowledge of the actual KLD ratings for these companies, are highly correlated with the KLD ratings of these companies (r = .66, p < .01), providing support for using KLD ratings as a proxy for sustainability performance communicated in the sustainability reports. Finally, any measurement error resulting from using KLD ratings to measure sustainability performance conveyed in the reports should operate against H1 and H2 (i.e., finding a significant association between the abnormal returns and sustainability performance).
The KLD ratings consist of strength and concern indicators to capture positive and negative performance, respectively, in key social (e.g., community, diversity, employee relations) and environmental domains. Since the number of strength and concern indicators has changed over the years in the KLD data set, we scale the number of total strengths (concerns) for each firm-year by the maximum possible number of strengths (concerns) in each year to obtain a strengths (concerns) index ranging from 0 to 1. We then subtract the concerns index from the strengths index to obtain a measure of net sustainability performance that ranges from −1 to +1 for each year (for similar transformation of KLD data, see Servaes and Tamayo 2013; Waddock and Graves 1997). Net sustainability performance is then adjusted by industry means for the prior year to get relative performance scores that are comparable across industries (Dhaliwal et al. 2011). Finally, because the KLD ratings are based on calendar years, whereas sustainability reports present sustainability performance based on fiscal years, the final measure of fiscal year–based sustainability performance is calculated as the weighted average of calendar year–based KLD ratings, with weights equal to the number of months in each calendar year. 6
For example, Procter & Gamble released its sustainability report for fiscal year 2011 on October 12, 2011, stating that the report covered the period from July 1, 2010, to June 30, 2011 (i.e., fiscal year 2011). In this case, Procter & Gamble's sustainability performance for fiscal year 2011 is given by the KLD rating for calendar year 2010 multiplied by 6/12, plus the KLD rating for calendar year 2011 multiplied by 6/12.
Measuring Information Environment
We use firm size and level of dedicated institutional ownership to capture different aspects of a firm's information environment. Firm size is a good indicator of information environment because the extent of predisclosure information production and dissemination by a firm is often an increasing function of firm size (Atiase 1985). Due to the higher level of active, corporate-initiated information production and dissemination, larger firms usually operate in a stronger information environment. We measure firm size as the logarithm of total assets.
Institutional ownership captures another dimension of information environment from the perspective of private information acquisition by institutional investors and their monitoring role. In particular, institutional investors, due to their large holdings, are often motivated to acquire private information or get firms to release a high level of predisclosure information, suggesting a positive association between information environment and institutional ownership (El-Gazzar 1998). All else equal, firms with a higher level of institutional ownership are likely to have a stronger information environment. Recent research differentiates between three types of institutional investors—dedicated, transient, and quasi-indexer institutional investors 7 —and shows that it is dedicated institutional investors who play a monitoring and governance role and who actively acquire information (both financial and nonfinancial) to assess firm performance (Bushee 1998; Yu 2013). Therefore, the level of dedicated institutional ownership, rather than the level of total institutional ownership, constitutes a more accurate indicator of information environment.
Dedicated institutional investors generally hold large stakes in a few firms and have low turnover and more concentrated portfolio holdings. Transient institutional investors generally trade frequently to earn short-term profits and are characterized by high portfolio turnover and diversified portfolios. Quasi-indexer institutional investors generally use the index strategy and have low turnover and diversified portfolio holdings.
To calculate the ownership of dedicated institutional investors, we classify institutions based on their investment behaviors using the widely used factor and cluster analysis approach described in Bushee (1998). More specifically, three clusters are formed based on institutional investors’ portfolio turnover and concentration. Dedicated institutions are those with lowest portfolio turnover and highest concentration, transient institutions are those with highest portfolio turnover and lowest concentration, and quasi-indexer institutions are those with relatively low portfolio turnover and concentration. We measure the level of dedicated institutional ownership as the percentage of shares owned by dedicated institutions.
Dealing with Selection Bias
A firm's decision of whether to release a sustainability report may be endogenous. In testing H1 and H2, which predict the variations in stock market reaction to sustainability reporting, we only include firms that voluntarily release sustainability reports. Thus, the regression estimation for testing H1 and H2 may be subject to the potential sample selection bias. In addition, in testing H3, when comparing the value relevance of sustainability performance between reporting firms and nonreporting firms, we need to use an indicator variable (i.e., whether firms voluntarily release sustainability reports) as an independent regressor. This indicator variable is endogenous, raising potential concerns for selection bias. To address the selection bias, we employ the Heckman two-stage estimation method (Greene 2003; Heckman 1979) to account for the endogenous nature of firms’ decision to publish a sustainability report or not. Specifically, in the first stage, we estimate the following multivariate probit model, in which the dependent variable is whether a firm releases a sustainability report or not, and the independent variables include firm-specific characteristics that may influence this decision:

Estimates from Model 5 are then used to compute the inverse Mills ratio (LAMBDAit) 8 for each firm-year observation in the sample. In the second stage regression analysis, LAMBDAit is included as an additional control variable to account for the self-selection nature of firms’ decision of whether to issue a sustainability report in fiscal year t.
The inverse Mills ratio (Greene 2003) is defined as
Cross-Sectional Variations in Short-Term Market Reaction to Sustainability Reporting
To test H1 and H2, we use cumulative abnormal returns (CARi), calculated as the sum of daily abnormal returns (FFRit) during the three-day event window (−1, 1), as the dependent variable. H1 predicts that firms with better sustainability performance have more positive CAR around the release of sustainability reports. Our model is specified as follows:

In Model 6, ROAit, LIQUIDITYit, and SUSTAINit are the same as defined in Model 5. To account for potential differences in market reaction to inaugural versus subsequent sustainability reports, we include FIRSTit, a dummy variable equal to 1 if firm i releases its inaugural sustainability report in fiscal year t and 0 otherwise. We also include reporting lag (RPLAGit), which measures the timeliness of the sustainability report released in fiscal year t for firm i and is calculated as the difference between the fiscal year end month and the release month of the sustainability report. Finally, LAMBDAit is the inverse Mills ratio estimated from Model 5 in the first stage, based on the sample of nonreporting firms and reporting firms with identifiable reporting dates. Note that BTMit and LEVit are included in Model 5 but excluded from Model 6 because Fama–French–adjusted CAR should not be related to common risk factors such as BTM and LEV (Fama and French 1993). These two variables thus impose important exclusion restrictions on the second-stage model.
To test H2, we examine the moderating effects of firm size and dedicated institutional ownership by adding SIZE_Rit × SUSTAINit and INST_Rit × SUSTAINit to the previous Model 6:

Sustainability Reporting and Value Relevance of Sustainability Performance
H3 predicts that sustainability reporting will enhance the value relevance of sustainability performance. We conduct our analysis using a sample of reporting firms (including those with identifiable and nonidentifiable reporting dates) and nonreporting firms. We use a changes model to examine the value relevance of sustainability performance. Barth, Beaver, and Landsman (2001) suggest that if the research question is about the timeliness of an item being incorporated in firm value, a changes model is more appropriate than a levels model. Our inquiry involves determining the effects of sustainability reports on the timeliness of stock prices incorporating sustainability performance, suggesting that a changes model is more appropriate. More important, compared to a levels model, a changes model is less likely to be subject to econometric problems, such as omitted variable bias, heteroskedasticity, and autocorrelation in error terms (Kothari and Zimmerman 1995; Wooldridge 2010). Therefore, to test H3, we use the following changes model to examine the moderating role of sustainability reporting in the value relevance of sustainability performance:

Finally, we note that our use of panel data with observations on multiple firms across multiple time periods could lead to both time-series and cross-sectional correlation among observations (i.e., the observation for firm i in year t can be correlated with that for firm i in year t + 1 and that for firm j in year t). Therefore, following prior literature (Gow, Ormazabal, and Taylor 2010; Thompson 2011), we employ two-way cluster-robust standard errors, with clustering by firm and year, which allows for within-firm (time-series) dependence and within-year (cross-sectional) dependence.
Sample and Descriptive Statistics
Our sample consists of Fortune 500 companies that have identifiable release dates of sustainability reports in the period 2005–2011. We identify the release dates of sustainability reports by searching various Internet sources, including CSRwire, the Corporate Register directory, Business Wire, Reuters, PRWeb, and company websites (newsroom or investor relations section). We search for press releases using terms including “sustainability report,” “release,” “today,” and other similar terms. Specifically, for “sustainability report,” we also use terms such as “corporate social responsibility report,” “corporate responsibility report,” “corporate/global citizenship report,” and so on. For “release,” we also use terms such as “publish,” “announce,” “issue,” “is available, ” “becomes available.” We verify the release dates by reading the press releases. To control for confounding events, we check for other major news concerning the firm and eliminate the firm-date observation from our sample if there is an earnings announcement or merger and acquisition announcement during the period from one day before to one day after the release date of the sustainability report. We exclude firms whose press releases do not provide the exact release dates of the sustainability reports (N = 63) and firms that publish integrated annual reports (e.g., Southwest Airlines, United Technologies). In total, we have 139 firms with 328 release dates of sustainability reports in the period from 2005 to 2011.
We obtain daily stock prices and trading volumes, as well as the return on the value-weighted market portfolio, from Center for Research in Security Prices (CRSP); the Fama–French three factors from the Fama–French Factors data set; sustainability performance from the KLD data set; financial information from Compustat; and institutional ownership from CDA/Spectrum S34. We delete six sustainability reports (three firms) due to missing stock prices or sustainability performance. After we merge data from these various sources, our final sample includes 322 sustainability report releases for 136 firms.
Table 1, Panel A, shows the descriptive statistics of the main variables. Our sample firms are large (mean of SIZE = 10.328; mean asset size = $111.55 billion) and profitable (mean ROA = 6.1%). Sustainability performance (SUSTAIN) has a mean of .07, with relatively large variation (Q1 = −.033 and Q3 = .152). On average, firms issue sustainability reports about 6.6 months after fiscal year end (mean RPLAG = 6.593). Table 1, Panel B, provides the correlations among the main variables. Sustainability performance is positively correlated with profitability (correlation between SUSTAIN and ROA = .14). In addition, firms that have recently published their inaugural sustainability report (i.e., FIRST = 1) tend to have lower sustainability performance than firms that have published subsequent sustainability reports (i.e., FIRST = 0; point biserial correlation between FIRST and SUSTAIN = −.15).
Descriptive Statistics

Notes: The table reports the descriptive statistics for the sample of 322 observations with sustainability reports (136 unique reporting firms). SIZE is the logarithm of total assets, measured at the beginning of fiscal year t. INST is the level of dedicated institutional ownership at the end of the quarter prior to the release of sustainability reports. ROA is the return on assets, which measures a firm's profitability and is calculated as income before extraordinary items divided by total assets for the fiscal year prior to the release of sustainability reports. BTM is the book-to-market ratio, which measures a firm's growth opportunity and is calculated as the book value of equity divided by the market value of equity at the beginning of fiscal year t. LEV is financial leverage, which measures a firm's financial risk and is calculated as total debt divided by total assets at the beginning of fiscal year t. LIQUIDITY is the number of shares traded divided by the number of shares outstanding for the fiscal year prior to the release of sustainability reports. FIRST is a dummy variable equal to 1 if the sustainability report is the inaugural sustainability report of the firm and 0 otherwise. RPLAG is calculated as the difference between the fiscal year end month and the release month of the sustainability reports. SUSTAIN is firm sustainability performance for the fiscal year prior to the release of sustainability report, calculated as the weighted average industry-adjusted net sustainability performance based on calendar years with weights equal to the number of months in each calendar year. Boldface indicates correlations that are statistically significant at the 10% level or better. Correlations with FIRST are point-biserial correlations.
An initial question of interest is whether and how firms that issue sustainability reports (reporting firms) are different from firms that do not issue sustainability reports (nonreporting firms). To examine this, we start with all firm-year observations for Fortune 500 firms in our study period (2005–2011) with nonmissing values for necessary financial information and sustainability performance (2,870 firm-year observations). On the basis of whether firms release stand-alone sustainability reports and whether reporting dates are identifiable, we then classify the observations into three groups: (1) reporting firms with identifiable reporting dates (322 firm-year observations), (2) reporting firms with nonidentifiable reporting dates (522 firm-year observations), and (3) nonreporting firms (2,026 firm-year observations).
Table 2 presents descriptive statistics of the main variables for these three groups. Examples of reporting firms during our sample period include IBM, Exxon Mobil, General Electric, Ford Motor, Bank of America, and CVS Caremark; examples of nonreporting firms during our sample period include Honeywell International, Rite Aid, Murphy Oil, Ralph Lauren, and Nordstrom. In general, relative to nonreporting firms, reporting firms with identifiable dates are significantly larger (SIZE: 10.317 vs. 9.307; p < .01), are more profitable (ROA: .060 vs. .049; p < .01), have better sustainability performance (SUSTAIN: .069 vs. −.009; p < .01), and have lower levels of dedicated institutional ownership (INST: .341 vs. .361; p < .05). Relative to nonreporting firms, reporting firms with nonidentifiable dates are larger (SIZE: 9.894 vs. 9.307; p < .01), have lower financial leverage (LEV: .239 vs. .257; p < .05), and have better sustainability performance (SUSTAIN: .014 vs. −.009; p < .01).
Comparison Between Reporting and Nonreporting Firms

Notes: All variables are as defined in Table 1. Data for differences between columns are shown with p-values in parentheses. Values of N in columns 1, 2, and 3 refer to the number of firm-year observations.
Table 3 provides the regression results based on probit Model 5. In column 1, reporting firms exclude those with nonidentifiable reporting dates. In column 2, reporting firms include all firm-year observations that release sustainability reports regardless of whether reporting dates are identifiable. The results are similar across both specifications. Larger firms and firms with higher sustainability performance are more likely to issue sustainability reports. We also find that leverage is negatively associated with the likelihood of sustainability reporting.
Determinants of Voluntary Sustainability Reporting

Notes: The table reports the determinants of issuing stand-alone sustainability reports based on the probit model given in Equation 5. Coefficients are shown with p-values in parentheses. DISCLOSE is a dummy variable equal to 1 for reporting firms (i.e., firms that release sustainability reports for the prior year in fiscal year t) and 0 otherwise. All the independent variables are as defined in Table 1. p-values are based on robust standard errors clustered by firm and year to control for both cross-sectional and time-series correlations.
Hypotheses Testing Results
Short-Term Stock Market Reaction to Sustainability Reports
Before testing our predictions, we wanted to examine whether there indeed exists a significant stock market reaction to the release of sustainability reports. To do so, we looked at the cumulative absolute abnormal returns (CABS_AR) and cumulative abnormal trading volumes (CAVOL) in the event window around the release of sustainability reports. Table 4, Panel A, provides the means and medians of CABS_AR for different time windows. Notably, there is a significant spike in CABS_AR around the release of sustainability reports. The mean CABS_AR during the five-day event window (−2, 2) is significantly positive (.43%; p < .05), and the mean CABS_AR during the three-day event window (−1, 1) is also significantly positive (.27%; p < .10). In contrast, all the other time windows before and after the (−2, 2) event window yield mean CABS_ARs that are not significant, suggesting that our results are not driven by unrelated trends around the event dates. To test the robustness of this finding, we also calculate the cumulative standardized absolute abnormal returns (CSABS_AR). CSABS_AR has better econometric properties than CABS_AR but is difficult to interpret (Bushee et al. 2011). The mean CSABS_AR is .277 (p < .05) for the (−1, 1) time window and .516 (p < .01) for the (−2, 2) time window; it is not significant in other time windows before or after the (−2, 2) event window, except for the (−5, −3) window, where CSABS_AR = .220 (p = .085).
Stock Market Reaction to the Release of Sustainability Reports

Notes: Data are shown with p-values in parentheses. CABS_AR is the cumulative daily absolute abnormal returns during the event window, where daily absolute abnormal returns (ABS_AR) are computed as the difference between the absolute value of Fama–French–adjusted returns (FFR) on each event day and the mean of the absolute value of daily FFR during the estimation period. FFR is the residual returns from the Fama–French three-factor model estimated during the 80-day estimation period from 100 trading days priorto the event window to 21 trading days prior to the event window. CAVOL is cumulative abnormal trading volume during the event window, where daily abnormal trading volume (AVOL) is calculated as the logarithm of daily share turnover (trading volume divided by shares outstanding) during the event period minus the mean logarithm of daily share turnover during the estimation period, deflated by the standard deviation of the logarithm of daily share turnover during the estimation period. CAR is cumulative FFR during the event window.
Table 4, Panel B, presents the means and medians of cumulative abnormal trading volumes (CAVOL) for different time windows. There is a significant increase in trading volumes during the (−1, 1) and (−2, 2) event windows (mean CAVOL: .439 and .772, respectively; both ps < .01). Interestingly, the mean CAVOL for the (−5, −3) time window is significant (mean CAVOL: .343; p < .05), suggesting that, as with other corporate disclosures (e.g., earnings releases), there may be some information leakage before the release of sustainability reports that results in abnormal trading activities (Ball and Brown 1968; Chambers and Penman 1984). Except for the (−5, −3) window, all the time intervals before and after the (−2, 2) event window have mean CAVOLs that are small and not significant, suggesting that the abnormal trading volume is not driven by other unrelated trends around the event dates. Taken together, the significant cumulative absolute abnormal returns and the significant cumulative abnormal trading volumes for the (−1, 1) and (−2, 2) event windows suggest that sustainability reports do contain new, value-relevant information and that the stock market does respond to the release of sustainability reports.
Table 4, Panel C, provides the means and medians of signed cumulative abnormal returns (CAR) during the three-day event window (−1, 1) and the five-day event window (−2, 2). The mean CAR for the (−1, 1) and (−2, 2) event windows are not significant (.15% and −.15%, respectively; both p > .10). Note that the insignificant means of signed CAR are consistent with our expectation that there will be positive or negative CAR, depending on the sustainability performance of the reporting firms. In summary, the insignificant means of signed cumulative abnormal returns, combined with the significantly positive means of cumulative absolute abnormal returns and cumulative abnormal trading volume, strongly suggest that there exist large cross-sectional variations in stock market reaction to the release of sustainability reports.
Cross-Sectional Variations in Stock Market Reaction to Sustainability Reports
We use Models 5, 6, and 7 to examine cross-sectional variations in stock market reaction to sustainability reports. Since Models 6 and 7 are estimated using the sample of reporting firms with identifiable dates only, the inverse Mills ratio (LAMBDA) in Models 6 and 7 is calculated based on the estimates from Model 5, using the sample of nonreporting firms and reporting firms with identifiable dates (i.e., Table 3, column 1). Table 5, columns 1 and 2, report the results based on Models 6 and 7, respectively.
Determinants of Abnormal Returns to the Release of Sustainability Reports

p < .05 (two-tailed).
p < .01 (two-tailed).
Notes: Column 1 reports the regression results of the model given in Equation 6; column 2 reports the regression results of the model given in Equation 7. Coefficients are shown with t-statistics in parentheses. CAR is cumulative abnormal returns for the three-day event window (-1, 1). SIZE_R and INST_R are the scaled decile ranks of SIZE and INST, respectively. In particular, we calculate the scaled decile rank of firm size (SIZE) and dedicated institutional ownership (INST) for each firm by ranking these variables into ten groups (0–9) by decile points and dividing the group numbers by 9, so that the scaled ranks range between 0 and 1. LAMBDA is the inverse Mills ratio estimated from the first-stage probit model given in Equation 5. DISCLOSE is a dummy variable equal to 1 for reporting firms (i.e., firms that release sustainability reports for the prior year in fiscal year t) and 0 otherwise. All the independent variables in Model 5 are as defined in Table 1 and are measured at the beginning of fiscal year t. The t-statistics are based on robust standard errors clustered by firm and year to control for both cross-sectional and time-series correlations.
H1 predicts that the abnormal returns surrounding the release of sustainability reports are positively related to firm sustainability performance. Table 5, column 1 shows that the coefficient of SUSTAIN is significant and positive (.058; p < .01), suggesting that, all else equal, abnormal returns around the release of sustainability reports are more positive for firms with higher sustainability performance. Therefore, H1 is supported.
H2 predicts that for firms in a stronger information environment, as indicated by a larger firm size or a higher level of dedicated institutional ownership, the positive association between sustainability performance and abnormal returns is smaller. Table 5, column 2, shows that while the coefficient of SUSTAIN is significant and positive (.118; p < .01), SIZE_R × SUSTAIN has a significant and negative coefficient (−.066; p < .05). Similarly, INST_R × SUSTAIN has a significant and negative coefficient (−.089; p < .01). These results suggest that, consistent with H2, the positive relationship between abnormal returns and sustainability performance is smaller for larger firms and for firms with higher levels of dedicated institutional ownership. Figure 1 illustrates the moderating role of information environment.

Moderating Role of Information Environment in the Abnormal Returns to the Release of Sustainability Reports
All control variables except reporting lag (RPLAG) and LIQUIDITY have insignificant coefficients in both columns. Importantly, reporting lag has a significant and negative coefficient in both Models 6 and 7 (p < .05), suggesting that the stock market positively values timely release of sustainability reports. The coefficient on LIQUIDITY in Model 7 is negative (p < .05), consistent with the argument that investors demand higher returns to compensate for stock illiquidity. In addition, the coefficient on LAMBDA is not significant in both columns, suggesting that the sample selection bias may not be severe.
Sustainability Reporting and the Value Relevance of Sustainability Performance
H3 is tested using Models 5 and 8. Since Model 8 is estimated based on the sample of nonreporting firms and all reporting firms regardless of whether reporting dates are identifiable, the inverse Mills ratio (LAMBDA) is calculated based on the estimates from Model 5, using the sample of nonreporting firms and all reporting firms, including those without identifiable dates (i.e., Table 3, column 2). Table 6 reports the regression results based on Model 8. Table 6, column I, shows that without considering the effect of sustainability reporting on the value relevance of sustainability performance, changes in sustainability performance are not related to changes in market value (−.084; n.s.). However, after we take into account the difference in value relevance of sustainability between reporting firms and nonreporting firms, column 2 shows a significant and positive coefficient on DISCLOSE × ΔSUSTAIN (.467; p < .01), while the coefficient on ΔSUSTAIN remains insignificant (−.120; n.s.). Since DISCLOSE is a dummy variable, equal to 1 if firms release sustainability reports and 0 otherwise, the regression results indicate that changes in sustainability performance are positively related to changes in market value only if firms release sustainability reports (i.e., DISCLOSE = 1). In other words, issuing sustainability reports significantly increases the value relevance of sustainability performance, which supports H3. In addition, the significant coefficient on LAMBDA suggests the presence of, and the importance of controlling for, the selection bias problem. We also repeat our analysis while controlling for fixed firm effects in Model 8; the results are qualitatively similar to those reported in Table 6.
Sustainability Reporting and the Value Relevance of Sustainability

p < .05 (two-tailed).
p < .01 (two-tailed).
Notes: Column 1 presents the regression results of the reduced model that does not consider the difference in value relevance of sustainability performance between reporting firms and nonreporting firms. Column 2 presents the effect of sustainability reporting on the value relevance of sustainability performance based model given in Equation 8. Coefficients are shown with t-statistics in parentheses. ΔMV, ΔTA, and ΔTL are the changes in the market value of equity, total assets, and total liabilities, respectively, at the end of fiscal year t relative to year t − 1. ΔNI is the change in income before extraordinary items for fiscal year t relative to year t − 1. ΔMV, ΔTA, ΔTL, and ΔNI are deflated by the market value of equity at the end of fiscal year t − 1. ΔSUSTAIN is the change in net sustainability performance reported in fiscal year t relative to year t − 1. DISCLOSE is a dummy variable equal to 1 for reporting firms (i.e., firms that release sustainability reports for the prior year in fiscal year t) and 0 otherwise. LAMBDA is the inverse Mills ratio estimated from the first-stage probit model given in Equation 5. All the independent variables in Model 5 are as defined in Table 1 and are measured at the beginning of fiscal year t. The t-statistics are based on robust standard errors clustered by firm and year to control for both cross-sectional and time-series correlations.
Discussion
This research is motivated by key questions at the interface of marketing and public policy: In the face of considerable expenditure of resources, should firms be encouraged to produce sustainability reports, among various other filing requirements? If so, what guidelines or policies should be established to incentivize firms to engage in such reporting? Our study starts to answer these questions by demonstrating that sustainability reports are indeed used by a key stakeholder group, investors, to affect a firm's financial performance in the short and long term. Table 7 provides a summary of the key findings. Specifically, in line with our theorizing, we document positive cumulative absolute abnormal returns and positive cumulative abnormal trading volumes around the releases of sustainability reports, suggesting that these reports contain new, value-relevant information. Importantly, the content of the report matters: we document a positive association between the signed cumulative abnormal returns around the release of sustainability reports and firm sustainability performance. We also show that these stock market reactions are smaller for firms in a strong information environment. Finally, over the long term, issuing sustainability reports serves to enhance the value relevance of sustainability performance, as investors are better able to incorporate such information in their stock price valuation. Next, we discuss the theoretical and practical implications of these findings.
Summary of Key Results

Theoretical Implications
Despite the increasing prevalence and rising expenditure of sustainability reports, little is known about the accountability of this key marketing action. If anything, extant research on sustainability communication (Peloza et al. 2012; Yoon, Gürhan-Canli, and Schwarz 2006) suggests that the returns to such communications from firm sources are tenuous because of stakeholders’ fractured understanding of not only what the firm is saying (i.e., the communication content) but also why (i.e., the communication motive). This study contributes to the sustainability communication literature by examining investor reactions to sustainability reporting, an increasingly important and high-profile method of sustainability communication. Our results provide compelling evidence that investors do respond to reports, and incorporate the sustainability performance information therein in their stock valuations. More specifically, this study complements prior sustainability communication research in several ways. First, it expands the focus of sustainability communication research. Whereas prior research in this area mostly focuses on consumer reactions to other forms of corporate generated sustainability communication (e.g., sustainability advertising, information on corporate websites), this study examines the reactions of investors, not consumers, and examines stand-alone sustainability reports, not other previously examined methods of corporate communication. In light of prior literature, our findings suggest that there exist significant stakeholder-specific and method-specific differences in the effects of sustainability communication. More generally, prior research has only painted a partial picture of the business case for sustainability communication due to its predominant focus on a single stakeholder group (i.e., consumers). Second, while prior research suggests that corporate-generated sustainability communication is likely to trigger stakeholder skepticism (Du, Bhattacharya, and Sen 2010), our findings suggest that stand-alone sustainability reports are largely considered by investors to be an important and credible source of information.
Also importantly, this study advances our extant understanding about the relationship between firm sustainability performance and financial performance in two ways. First, it sheds light on the nature of the sustainability performance—financial performance link. Decades of empirical research on this topic have not yielded a consensus on either the sign (positive or negative) or the direction of the relationship between sustainability performance and financial performance (Margolis and Walsh 2003). Most prior research on this topic examines the association between stock prices and sustainability performance (Margolis and Walsh 2003). In contrast, we use the event study methodology, which allows the event's unique contribution to the firm's future financial performance to be isolated and measured. Our event study analysis shows that the abnormal stock returns around the release of sustainability reports are positively related to firm sustainability performance, thus providing strong evidence for the direction of the relationship from sustainability performance to financial performance (i.e., higher sustainability performance, when communicated to the market via a sustainability report, leads to higher stock prices). This helps solidify the idea that a firm's sustainability performance enhances financial performance. Second, prior research suggests that the relationship between sustainability performance and financial performance is not uniform across firms but hinges on a variety of firm-specific factors such as firm innovativeness (Luo and Bhattacharya 2006) and level of advertising (Servaes and Tamayo 2013). We contribute to this line of research by documenting a new firm-specific variable, sustainability reporting, that enhances the positive relationship between sustainability performance and financial performance over time (i.e., the value relevance of sustainability performance).
Finally, research into the optimal mix of incentives for encouraging desirable behaviors points to the superiority of the carrot–stick approach (i.e., rewards and punishments) over merely a carrot or a stick (e.g., Andreoni, Harbaugh, and Vesterlund 2003). This study contributes to the marketing–public policy interface by demonstrating the viability of combining the traditional “stick” approach of sustainability disclosure regulations with the “carrot” of business returns associated with sustainability reports containing evidence of superior sustainability performance. Thus, for public policy makers, who often goad firms to disclose sustainability performance, our findings provide much-needed ammunition on the benefits of both sustainability performance and its communication through reports, which policy makers can use to help the cause of sustainability disclosure. More generally, sustainability reporting has gained prominence in practice, yet academic research on this topic remains scarce (for exceptions, see Dhaliwal et al. 2011, 2012). Our results on the significant short-term and long-term stock market reactions provide direct evidence of the information content of sustainability reports, highlighting the importance of sustainability reports as a critical means to communicate a firm's sustainability performance to the investor community.
Managerial Implications
Due to the considerable expenses associated with sustainability reporting and scant evidence on business returns to such initiative, many firms wonder whether it is necessary or beneficial for their firms to publish lengthy, detailed sustainability reports (Van Wensen et al. 2011). Our study builds a powerful business case for releasing sustainability reports, particularly for firms that have high sustainability performance, and more so in a weak information environment.
Our results suggest that, for socially responsible firms, there are tangible financial benefits associated with releasing sustainability reports. Surrounding the release of such reports, firms can expect to witness abnormal stock returns that are positively related to their sustainability performance. Over the longer term, release of sustainability reports helps the stock market incorporate a firm's sustainability performance in a timely manner, resulting in a stronger association between sustainability performance and stock prices. To be more specific, according to our models, a small firm (lowest decile of SIZE) with a low level of dedicated institutional ownership (lowest decile of INST), average liquidity (LIQUIDITY = the sample mean, 2.667), and overall sustainability performance in the upper quartile of our sample is expected to experience cumulative abnormal returns of at least 1.16% during the event window (−1, 1) by issuing sustainability reports within the first month after the fiscal year end. 9 For a firm with a beginning market value equal to the mean market value of Fortune 500 firms ($23,563.16 million) and the change in sustainability performance equal to its upper quartile (.031), publishing a sustainability report will lead to a $341.1 million increase in market value per annum. 10
The cumulative abnormal returns are calculated as the coefficient on SUSTAIN (.118) multiplied by the third quartile of SUSTAIN (.152), plus the coefficient on RPLAG (−.001), plus the coefficient on LIQUIDITY (−.002) multiplied by the mean of LIQUIDITY (2.667). All the coefficients are taken from Table 5, column 2.
The incremental increase in the market value is given by the coefficient on DISCLOSE × ΔSUSTAIN (.467) in Table 6, column 2, multiplied by the upper quartile of ΔSUSTAIN (.031) and then by the beginning market value ($23,563.16).
Sustainability reporting is particularly important for smaller firms and firms with lower levels of dedicated institutional ownership. For these firms, due to the lower availability of alternative sustainability communication, investors rely more on sustainability reports to acquire information about firm social and environmental performance, leading to greater stock market reactions to sustainability reports. These firms, particularly if they have superior sustainability performance, should prioritize their resource investments to engage in sustainability reporting. Managers of these firms could arrange training workshops on standard guidelines on sustainability reporting and could streamline the organizational processes on measuring and recording sustainability-related key performance indicators. Such efforts could greatly facilitate the initial adoption of and continued engagement in sustainability reporting.
Furthermore, our analysis shows that, all else equal, cumulative abnormal returns around the release of a sustainability report are negatively correlated with reporting lag. This suggests that the stock market positively values the timely release of sustainability reports. Firms should work hard to issue their sustainability reports in a timely manner. Finally, given that the uptick in financial performance only holds for stronger performers in sustainability, at a higher level, our results should urge firms to engage in sustainability initiatives.
Public Policy Implications
Given the current proliferation of reporting requirements (KPMG 2016), policy makers urgently need to evaluate the disclosure effectiveness of various reporting formats. This study, by documenting investor reactions to sustainability reports, advances current understanding about the business value of such reports and provides regulators with knowledge and insights to more effectively devise policies and guidelines for sustainability disclosure (SEC 2016).
By demonstrating the information content of sustainability reports and, consequently, the critical complementary role such reports play in enhancing firm transparency, this study offers important implications for regulators and public policy makers. Because sustainability reporting provides higher business returns to good corporate citizens, in terms of positive abnormal stock returns and higher value relevance of sustainability performance, policy makers should use this information to educate firms about the business value of achieving high sustainability performance and publishing sustainability reports.
In particular, the idea provided by this article that sustainability reports are not mere signals of sustainability but actually convey diagnostic particulars of a firm's performance in this domain points to the need for policy makers and standards developers (e.g., GRI) to continue to facilitate the reporting process, through resources such as templates, toolboxes, educational tutorials, and workshops, that will make this actual performance information most accessible and comprehensive to investors and other stakeholders. Furthermore, this study accentuates the value of sustainability reports; thus, in the context of numerous reporting requirements, policy makers should devise reporting formats for individual filings that are easily transferable to a firm's sustainability report. Far better, if possible, would be for policy makers and marketers to work together to develop an at least somewhat standardized template for sustainability reports that not only allows meaningful, high-quality disclosure but also makes such information more accessible and usable by key stakeholder groups (e.g., in the case of this research, investors). Such coordinated policies or frameworks would greatly increase firms’ reporting compliance and reduce their reporting burden.
Finally, our results suggest that publishing sustainability reports is particularly important for firms in a weak information environment (e.g., smaller firms and firms with lower levels of institutional ownership). Interestingly, however, prior studies (Dhaliwal et al. 2011; KPMG 2013), as well as our analysis (Table 3), indicate that firms in a weak information environment are less likely to release sustainability reports. Thus, policy makers and standards developers should incentivize and enable small and medium-sized firms and firms with lower institutional ownership to engage in such reporting, providing extra resources to help these firms initiate and continue sustainability reporting.
Limitations and Future Research Directions
This study is subject to several limitations. First, we only look at the Fortune 500 companies during the period from 2005 to 2011. Future research should examine the generalizability of our findings by looking at a larger sample of firms and firms from different countries. Second, we use KLD ratings to proxy for overall sustainability performance information provided by the sustainability reports. Although KLD ratings have been widely used in prior literature as a measure of overall sustainability performance, they are not perfect. Future research could replicate our results using other proxies of sustainability performance. Perhaps more important, although analyzing the content of sustainability reports is beyond the scope of this study, we call for future research to do content analyses of sustainability reports. Systematic and in-depth analyses of sustainability reports might make it possible to derive some quantifiable summary measure of overall sustainability performance from the reports themselves, enabling us to test more directly the focal link between sustainability reporting and stock market performance link.