
Abstract
This research examines how low-literate consumers use nutritional labels on packages and the ways such usage can be facilitated. Using research on nutritional labeling and on low-literate consumers as bases, the authors design an experiment to test specific hypotheses about the effects of graphic versus nongraphic formats on usage of nutrition information by consumers with different levels of literacy. The authors discuss implications of the findings for further research and for public policy.
Keywords
Literature Review
Review of Research on Nutritional Labeling
Prior research on ways to facilitate usage of nutrition information has typically focused on literate consumers. Studies have examined the effects of different nutritional programs or presentation formats (Levy, Fein, and Schucker 1991; Muller 1985; Russo et al. 1986), reference information (Moorman 1990), different formats of presenting daily values (Levy, Fein, and Schucker 1991), and motivation and knowledge variables (Andrews, Netemeyer, and Burton 1998; Keller et al. 1997). A consistent finding across this research is that “summary” information facilitates the processing of nutritional labels. For example, Viswanathan (1994) shows that provision of average or range information, along with numerical nutrition information, leads to better comprehension of nutrition information. He argues that summary information (e.g., average, range) is beneficial because it is tied to specific product categories and thus provides a direct comparison point with which to evaluate specific brands. Thus, summary information is likely to be useful for making relative judgments of a brand when compared with other brands. In contrast, the currently provided percentage of daily value (%DV) is computed using recommended daily dietary guidelines and is tied to daily dietary intake, not to specific product categories. Barone and colleagues (1996) find evidence to support the facilitative effects of providing average information. Viswanathan and Hastak (2002) demonstrate this effect with both students and grocery shoppers. Their research also directly compares %DV with summary information and demonstrates that the latter, particularly in the form of average information, improves consumer judgments about nutritional content when assessing single brands. Furthermore, their research identifies the availability of multiple comparison brands as a key variable that moderates the facilitating effect of summary information. Whereas summary information, particularly average information, sharpens the distinction between healthful and unhealthful brands more than %DV information when consumers evaluate a single brand, this effect is reduced or eliminated when consumers have information on multiple brands. With multiple brands, the primary mode of processing appears to be comparative, with less attention paid to the meaning conveyed by the absolute levels of individual nutrients.
In summary, the issue of facilitating the use of nutrition information has been examined by several researchers. Whereas %DV has some benefits, other alternatives have been researched. However, a common denominator in the various empirical studies is a predominant focus on literate consumers. It is unclear whether the beneficial effects of providing summary information uncovered in prior research holds for low-literate consumers as well.
Review of Research on Literacy
Literacy has been defined as “the ability to exhibit all of the behaviors a person needs in order to respond properly to all possible reading tasks” (Bormuth 1975, p. 72). Numeracy has been defined as the “capacity and propensity to effectively and critically interact with the quantitative aspects of the adult world” (Gal 2002, p. 21). Functional literacy refers to the competencies required to function adequately as adults (Kirsch and Guthrie 1997) and links the notions of literacy and numeracy to day-to-day functioning. Over time, differences between definitions of literacy and functional literacy have blurred. These two terms are used interchangeably for the purposes of this study.
Skills associated with functional literacy have significant implications for consumers. The question of how low-literate consumers manage shopping environments has not received much attention (Wallendorf 2001). Recent studies have begun to examine the role of low literacy in consumer behavior (Adkins and Ozanne 2005; Viswanathan, Rosa, and Harris 2005). In a qualitative study based on observations and interviews of adult education students, Viswanathan, Rosa, and Harris (2005) document several findings. They note that low-literate consumers spend considerable effort on what literate consumers may take for granted and perform with minimal effort. Examples include locating a product, reading its price, and computing the price of multiple units. Viswanathan, Rosa, and Harris classify findings into cognitive predilections, decision heuristics and emotional trade-offs, and coping strategies. They note that the most striking facet of low-literate consumers’ cognitive predilections is their use of concrete thinking, stemming from difficulty in engaging in abstract thinking. Low-literate consumers are able to perceive one piece of information, such as price, but have difficulty relating that data to other information, such as package size. Another example of concrete thinking is the choice of the “cheapest” or “smallest” item, without regard to price/volume trade-offs. Some consumers rely on the presence or absence of single ingredients, such as fat, sodium, and sugar, without allowing for varying acceptable levels across product categories or based on portion size. Unit price, being relatively abstract, may be an example of information that low-literate consumers rarely use. Similarly, nutritional labels are often not used or are used for one or two nutrients. Relatively concrete tasks, such as comparing two brands on price or on a single nutrient, can be completed by many low-literate consumers. However, this reliance on concrete thinking leads to problems in performing tasks that require drawing abstractions, such as making judgments of healthfulness from nutrient values.
Pictographic thinking, which extends well beyond being influenced by pictures, is linked to concrete thinking. Lowliterate consumers may visualize amounts of products to buy rather than using available symbolic information, or they may see a label or brand logo as a picture rather than reading it (Viswanathan, Rosa, and Harris 2005; see also Gau and Viswanathan's [2008] study of challenges and coping in a shopping context) and may rely on pictorial representations for much of their shopping-related activities. Similarly, they may shop for food items by recalling the kitchen activities for cooking or baking specific dishes to discern which ingredients and in what quantities they need to purchase. They may engage in pictorial thinking when estimating the value of their shopping basket relative to their budgets by relying on picturing amounts as stacks of currency and coins and comparing the envisioned stacks. This is relevant for nutritional labels because nutrients are abstract concepts, and nutrient values are symbolic (i.e., they do not bear a one-to-one correspondence with reality) and cannot be easily visualized (e.g., number of calories).
Pictographic thinking represents a preference for thinking using information that bears a one-to-one correspondence with reality. Such information could be processed at a sensory level without the need for abstract processing. However, nutrient information on packages is represented in a relatively abstract, symbolic form. For example, the amount of calories is represented in numerical form. The tendency to visualize amounts rather than use numerical information on packages (Viswanathan, Rosa, and Harris 2005) highlights the relatively abstract nature of symbolic numerical information. The predilection of pictographic thinking suggests that graphic presentations, which have a one-to-one correspondence with quantities or amounts, could facilitate processing of nutrient values by low-literate consumers. Other studies also suggest that pictorial information is more useful for low-literate consumers. Viswanathan and colleagues (2009) show that pictorial elements in brands that bear a one-to-one correspondence with reality (brand signatures) improved memory for low-literate consumers. Chambers and colleagues (2000) suggest that pictorial presentations in health and nutrition education displays are preferred by adult education students. Similarly, pictorial nutrition educational materials may be better understood by students (Viswanathan and Gau 2005). The effectiveness of pictorial displays over text-only displays has been documented in educational settings (Carney and Levin 2002) and in health care (Wilson 2003). Jae and Delvecchio (2004) use the elaboration likelihood model and argue that low-literate consumers tend to use peripheral processing when faced with a product choice, suggesting that this effect is reduced if diagnostic, pictorial information is present. They find that low-literate consumers are more likely to make a poor decision than the general population regardless of the type of information, but the presence of diagnostic, pictorial information improves the likelihood of making a better decision.
Adkins and Ozanne (2005) employ dimensions of identity management strategies and acceptance or rejection of stigma arising from low literacy to identify types of low-literate consumers. They report findings consistent with those of Viswanathan, Rosa, and Harris (2005), such as pictorial dependence; memorization of brand names as combinations of letters; habitual purchase; store and brand choices based on familiarity; and the use of coping strategies, including avoidance, self-esteem maintenance, dependence on others, and social deception. 1 They demonstrate that some low-literate consumers are able to overcome stigmas to become more empowered consumers. However, the cognitive constraints that many low-literate consumers face need to be addressed.
Several caveats should be noted with the study of lower ranges of literacy both in prior research and in our approach. First, the terms “literacy” and “functional literacy” are used interchangeably and are umbrella terms that will eventually need further sophistication, such as into “numeracy” and “literacy.” In the limited research in this area and in our approach, convenience samples of students enrolled in adult education centers are studied; they are categorized into 0–4th-, 5–8th-, and 9–12th-grade equivalent levels according to reading and math scores at entry and at subsequent intervals. Over time, it may be possible to distinguish the effects of numeracy versus literacy, though it is difficult to envision easy access to or even sufficient occurrence of very low levels of numeracy with higher levels of literacy or the reverse. More generally, the study of low-literate individuals poses challenges at every step of the research process, making it necessary to begin with available participants in terms of literacy levels. As the state-of-the-art in this area develops, more precise sampling may be possible, enabling testing of more sophisticated hypotheses involving different levels of numeracy and literacy.
Discussion
In summary, low-literate consumers exhibit cognitive predilections and decision-making styles that may require distinctly different approaches to facilitating the use of nutrition information than those discussed previously, such as the use of %DVs and averages. Difficulties with numerical symbols and a predilection for pictographic thinking suggest the use of pictorial formats to facilitate use of nutrition information. Thus, graphic presentations of nutrient values or amounts may be easier for low-literate consumers to use. The focus of our experimental study is on this element of alternative formats. From our review of prior research, we designed an experiment to test the efficacy of graphic presentation formats for low-literate consumers.
Experiment
This study examines the effect of different formats for presenting nutrition information on low-literate consumers’ judgments of healthfulness. We tested the four presentation formats that appear in Figure 1. For illustrative purposes, we show only the top half of the nutritional label. The bottom half of the nutritional labels was identical for all conditions, and all labels were identical in size. Two of the labels were the “average” and “%DV” formats that have been examined in prior research (Viswanathan and Hastak 2002). In light of prior research and the insights we gleaned from our own qualitative interviews, we expected that these formats would prove to be too abstract for low-literate consumers to interpret and use. The %DV is related to daily dietary requirements, and the average is a mean across several brands. The average requires understanding a nutrient value and the concept of the average, both relative abstractions. These two formats are abstract in another sense as well; they use symbolic numerical information rather than, for example, pictorial representations of quantities or amounts. Thus, although prior research has suggested some advantages for average information (Viswanathan and Hastak 2002), this may not hold true for low-literate consumers.
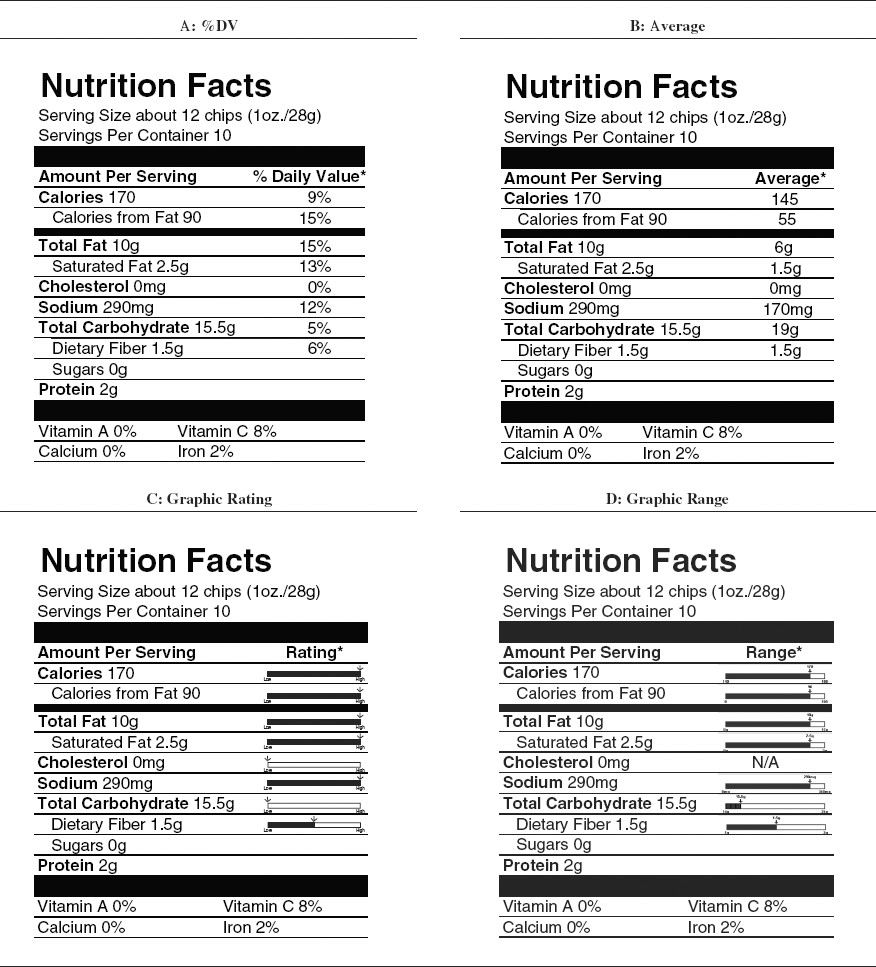
Sample Nutritional Labels
In contrast to abstract information, concrete, pictorial representations of nutrient values may be more effective for low-literate consumers. Therefore, we created two additional formats for presenting summary information: the graphic range format and the graphic rating format. The graphic range format presents the range (i.e., numerical low and high values) on each nutrient for a product category. The specific nutrient value for the brand appears both in a bar graph format and in numerical terms (Figure 1). The graphic rating format was similar, except that (1) the numerical extremes for the range were replaced with the verbal labels “low” and “high,” (2) the numerical value of the brand on each nutrient was not shown, and (3) the length of the bar in the graph did not vary continuously with the nutrient value for the brand. Instead, the length of the bar was set at one of five discrete levels. It was set at the left extreme if the brand value for that nutrient was less than 20% of the range, at the 25% level if the brand value for the nutrient was between 20% and 40% of the range, at the 50% level if the brand value for the nutrient was between 40% and 60% of the range, at the 75% level if the brand value for the nutrient was between 60% and 80% of the range, and at the right extreme if the brand value was more than 80% of the range. Therefore, both of these formats concretize the relative value of a nutrient through graphic representation. The graphic rating format goes further in simplifying the nutritional value by converting it into one of five levels. Raw nutrient values in numerical terms may be difficult for low-literate consumers to interpret in terms of meaning. An additional step is required in looking at a nutritional label and inferring meaning from a specific nutrient value, even when summary information is available. This step is completed and presented in the graphic rating format.
The use of graphic formats to ease the information-processing burden on respondents is suggested by research on low-literate consumers and by research in other domains. For example, the Federal Trade Commission EnergyGuide label that has appeared on major appliances, such as refrigerators and dishwashers, in the United States since 1980 employs a format similar to our graphic range format. Specifically, the label shows the range of energy consumption (in kilowatt hours) from the lowest to the highest for appliances in the product category. The range is presented as a bar, with the numerical values of the extreme listed at the ends of the bar. The energy consumption for the appliance is then shown both numerically and with an arrow pointing at the appropriate location on the bar. There is some research indicating that the label may influence consumer knowledge about the energy characteristics of appliances (Dyer and Maronick 1988). Research in the area of risk communication also suggests that presenting risk information graphically rather than numerically can significantly influence risk-taking behavior (Schirillo and Stone 2005; Stone, Yates, and Parker 1997). However, unlike our research, prior research has not investigated the possibility of graphic representations being particularly beneficial to low-literate consumers.
We expected respondents with higher levels of literacy to make better judgments of healthfulness based on the Nutrition Facts panel than respondents with lower levels of literacy, regardless of presentation format of the nutrition information. Furthermore, we expected that the consumer literacy level would interact with presentation format in influencing comprehension of nutrition information. For respondents with lower levels of literacy, we expected summary information presented in graphic formats (i.e., the graphic range format and the graphic rating format) to be more effective than summary information presented in nongraphic formats (i.e., the %DV format and the average format) in communicating product healthfulness. Conversely, for respondents with higher levels of literacy, we expected all four of the formats to be equally effective. Formally, we propose the following specific hypotheses:
Consumers with higher levels of literacy are more effective in judging product healthfulness based on nutrition information than consumers with lower levels of literacy.
Consumers with higher levels of literacy are more effective in judging product healthfulness based on nutrition information regardless of presentation format.
Consumers with lower levels of literacy are more effective in judging product healthfulness when nutrition information is presented in a graphic format (graphic rating or graphic range) than when it is presented in a nongraphic format (%DV or average).
Overview and Design
Respondents with varying levels of educational attainment and literacy were recruited for the study. People registered at adult education centers in several locations in a midwestern state were asked to recruit respondents with literacy covering grade equivalent levels of 0–12 based on math and reading scores administered at entry to the adult education center and at intervals thereafter. These tests consist of several multiple choice questions (40 questions for reading level, 50 questions for math) and are used to determine GED (General Educational Development) qualification in this particular midwestern state. Undergraduate business students at a large midwestern university were asked to recruit respondents with literacy levels beyond grade 12. Although it is possible that not all undergraduate respondents had reading levels beyond grade 12, the typical business student at this university has a SAT (Scholastic Aptitude Test) score between 1220 and 1380 and a 3.5 grade-point average over the first two years of undergraduate studies.
Data from adult education students were collected in one-on-one administrations. Participants were offered a small cash incentive ($5 per half hour, with each study typically lasting less than 30 minutes). The rate of participation was high, and there were virtually no instances in which students declined to participate. Despite the high cost associated with one-on-one data collection, this approach was necessary for low-literate consumers given the reading and writing difficulties they might experience, as well as the desire to minimize potential feelings of discomfort. Data from undergraduate respondents were collected in four sessions of approximately 25 respondents each.
All respondents were given or read standardized instructions to ensure uniformity in the information provided to each respondent; the lone exception was that adult education students responded verbally, whereas undergraduate college students filled out an answer sheet. Participants were sequentially shown three cards that presented the Nutrition Facts panel for three different fictitious brands of potato chips. Following each presentation, participants rated the brand relative to other chips on healthfulness, calories, fat, sodium, and carbohydrates. The between-subjects factors were presentation format (four levels: average, %DV, graphic range, and graphic rating) and literacy level (0–4th-grade equivalent, 5–8th-grade equivalent, 9–12th-grade equivalent, and undergraduate students). As we noted previously, the adult education centers from which respondents were recruited usually grouped their students into 0–4th-grade, 5–8th-grade, and 9–12th-grade levels according to math and reading tests. The within-subjects factor was product healthfulness (three levels: healthful, neutral, and unhealthful product descriptions).
Stimulus Materials
We chose potato chips as the experimental product because our target group was familiar with it and used it. We created 12 cards that represented different versions of the Nutrition Facts panel for a fictitious potato chip brand. These versions differed in the presentation format (four levels) and product healthfulness (three levels). Figure 1 shows the versions of the panel for the four different presentation format conditions. These versions all represent a relatively unhealthful product; similar descriptions were created for a relatively healthful product and a neutral product. The top part of the card, with serving size and servings per container, and the lower part of the card, with ingredients and recommended daily values, were identical across all conditions and similar to nutritional labels found in the marketplace. The only difference between the conditions was that respondents were provided with one of four types of summary information (%DV, average, graphic range, or graphic rating). A brief description of the type of summary information provided was presented in place of the description of %DV values typically found on nutritional labels. Each respondent was randomly assigned to one of six possible orders in which the healthful, unhealthful, and neutral conditions could have been shown.
We manipulated healthfulness of the product description by varying the information on some nutrition attributes (calories, calories from fat, total fat, saturated fat, sodium, and total carbohydrate) while holding constant the information on other attributes (cholesterol, dietary fiber, protein, sugar, vitamins, calcium, and iron). We adapted the actual values used from Viswanathan and Hastak (2002).
Procedure and Measures
Several issues are germane in designing data collection with a low-literate sample. This is a difficult group to recruit and administer studies to, leading to restricted sample sizes and the need for careful administration procedures. Adding to the difficulty in finding respondents is the need for careful design to avoid creating response sets and anxiety arising from participation in research studies. Several elements are central here: careful personal administration by well-trained interviewers, the consideration of reading and writing difficulties, and the use of realistic stimuli and tasks that respondents can relate to from their life experiences. Otherwise, something akin to test anxiety may result. Low-literate consumers often experience anxiety surrounding educational settings and testlike procedures because of a history of negative experiences in these contexts, including ridicule, embarrassment, and stigmatization as a result of their literacy skills. Our procedures attempted to address these issues while maintaining consistency across levels of literacy. Across all conditions, we provided brief instructions to participants to enable understanding of the new formats they would be asked to review. For the conditions showing the %DV, respondents were told that values shown represented the “percentage of what they should eat each day, for each nutrient.” For the condition showing the average, respondents were told that the numbers represented the average value for all brands of potato chips. In describing the scales used in the graphic range and graphic rating conditions, respondents were told that the arrows indicated different levels between the endpoints (e.g., low–high or minimum–maximum values).
A total of 214 respondents with varying levels of literacy were randomly assigned to each of the four summary conditions. A total of 120 students from adult education centers formed part of the sample, with 10 respondents assigned to each of the 12 conditions (i.e., format [4] × literacy level [3] conditions). For the undergraduate students, each format condition had between 20 and 25 respondents. Respondents were sequentially exposed to and then rated each of the three brands or product descriptions (healthful, neutral, and unhealthful) relative to other potato chips on healthfulness (1 = “much less healthy,” and 7 = “much more healthy”), calories (1 = “much less calories,” and 7 = “much more calories”), fat (1 = “much less fat,” and 7 = “much more fat”), sodium (1 = “much less sodium,” and 7 = “much more sodium”), and carbohydrates (1 = “much less carbohydrates,” and 7 = “much more carbohydrates”). Finally, respondents completed a nine-item scale designed to assess nutrition knowledge. This scale was developed by Mitra and colleagues (1999), who relied on selected items from the health and diet surveys by the Food and Drug Administration and the National Heart, Blood, and Lung Institute (see Levy, Fein, and Stephenson 1993).
Preliminary Analysis
We initially divided respondents into four groups according to their literacy level: 0–4th-grade equivalent, 5–8th-grade equivalent, 9–12th-grade equivalent, and college level. To assess the appropriateness of this classification, we performed a one-way analysis of variance (ANOVA) using a nutrition knowledge score based on the nine-item scale as the dependent variable. The ANOVA showed a significant effect due to literacy level (F(3, 210) = 5.53, p < .01). Follow-up contrasts showed that the college-level group (M = 3.28) scored significantly higher (at p < .05 [one-tailed]) than the 0–4th-grade-level group (M = 2.13), the 5–8th-grade-level group (M = 2.43), and the 9–12th-grade-level group (M = 2.67). However, the 9–12th-grade-level group scored significantly higher (at p < .05 [one-tailed]) than the 0–4th-grade-level group but not the 5–8th-grade-level group. A possibility suggested by this pattern is that the 5–8th-grade-level and the 9–12th-grade-level groups may not be differentiable on nutrition knowledge. Note that the 5–8th-grade-level group represents a mix of people, some of whom are in transition and likely to move into the 9–12th-grade level in the near future. In this regard, Viswanathan, Rosa, and Harris (2005) report distinct differences between the 0–4th-grade level and other levels. Consequently, we reclassified respondents into three groups according to literacy level: 0–4th-grade equivalent (low literacy), 5–12th-grade equivalent (medium literacy), and college level (high literacy). A one-way ANOVA on the knowledge score was significant (F(2, 211) = 8.09, p < .01). Furthermore, follow-up contrasts showed that the high-literacy group (M = 3.28) scored significantly better than the medium-literacy (M = 2.55) and the low-literacy (M = 2.13) groups on the knowledge measure (p < .01 [one-tailed]). Similarly, the medium-literacy group scored better than the low-literacy group on the knowledge measure (p < .05 [one-tailed]).
Results
The dependent measure in our analysis is the difference in the rating provided by respondents for the healthful versus the unhealthful versions of the product. 2 This difference score provides an indication of the degree to which the respondent comprehended the difference between the two versions. In other words, the score provides a measure of discrimination ability between healthful and unhealthful brands.
Respondents also provided ratings for a neutral version of the product. This was done to help mask the true purpose of the study. As we expected, the average ratings for the neutral version were always between the average ratings for the unhealthful and healthful versions and are not analyzed here.
We conducted a 3 (literacy level) × 4 (format) multivariate analysis of variance (MANOVA) with five dependent variables (difference scores on each of five scales: healthfulness, calories, fat, sodium, and carbohydrates). We present cell means in Table 1 and the results of the MANOVA in Table 2. We expected both a main effect for literacy level (consistent with H1) and a two-way interaction between literacy level and format (consistent with H2).
Cell Means

Notes: The ratings are on a seven-point scale (7 = “healthy,” “high calories,” “high fat,” “high sodium,” and “high carbohydrates”).
MANOVA and ANOVA Results

p < .10.
p < .05.
p < .01.
Notes: The dependent variable is the difference in score for the healthful versus the unhealthful product description. Table entries in Panel B are F-values.
The MANOVA produced results consistent with these expectations. Specifically, there was a significant main effect due to both literacy level and format (p < .01). The two-way interaction approached significance (p < .1). Follow-up univariate analyses showed that the main effect due to literacy level was significant for all five dependent variables (in each case, p < .01). For each variable, the dispersion measure was largest for the college level and smallest for the 0–4th-grade equivalent level of literacy. Thus, H1 is supported. Format produced significant effects (p < .05) for three of the five variables (calories, fat, and carbohydrates). The two-way interaction was significant for one variable (carbohydrates) and approached significance for two more (calories and sodium; p < .08).
We ran a priori contrasts to test H2a and H2b more directly (Table 3). We created one contrast for each dependent variable to test the key prediction that the difference in the dispersion score between the graphic formats and the nongraphic formats is larger for lower-literacy respondents (0–12th-grade equivalent) than for higher-literacy respondents (college level). The t-values and significance levels for these contrasts appear in Table 3. It should be noted that the contrasts needed to have a positive value and be significant to support L1 in Table 3.
A Priori Contrasts

Notes: The dependent variable is the difference in score for the healthful versus the unhealthful product description. Contrast L1 tests the proposition that respondents with low and medium literacy levels benefit more from graphic formats than respondents with high literacy levels. Contrast L2 tests the proposition that respondents with low literacy levels benefit more from graphic formats than respondents with medium literacy levels.
As we expected, all five of the L1 contrasts in Table 3 had positive values. Furthermore, three were significant (calories, fat, and carbohydrates), and one more approached significance (sodium). These results provide support for H2a and H2b. They suggest that lower-literacy respondents benefit from receiving nutrition information in a graphic format.
To explore the potential benefits of graphic presentation formats in more detail, we created a second set of contrasts to test the possibility that the difference in the dispersion score between the graphic formats and the nongraphic formats is larger for low-literacy respondents (0–4th-grade equivalent) than for medium-literacy respondents (5–12th-grade equivalent; L2 contrast). As Table 3 shows, only one of the five contrasts (for healthfulness) had a positive value, and that contrast was not significant. The contrast for carbohydrates was significant but had a negative value, indicating that the difference in the dispersion score between the graphic formats and the nongraphic formats was smaller for low-literacy respondents than for medium-literacy respondents. In other words, contrary to expectations, moderate-literacy respondents apparently benefited more from graphic formats than low-literacy respondents when evaluating carbohydrate content. A possible explanation is that though common health problems result in a desire to reduce the level of sodium, fat, or calorie intake, the optimal direction of carbohydrate intake is not as clear. However, it should be noted that there was no significant difference between the difference in the dispersion scores for the other four measures. Overall, these results suggest that the benefits of graphic formats accrue to both low- and moderate-literacy consumers.
Summary of Results
Several conclusions can be drawn from the pattern of results we obtained. First, literacy level has a significant effect on consumers’ ability to process and understand the Nutrition Facts panel. Regardless of format, the Nutrition Facts panel was better understood by consumers at higher levels of literacy. Second, consumers with lower levels of literacy appear to benefit from graphic presentations more than respondents with higher levels of literacy. Finally, the benefits of graphic presentation formats appear to accrue to consumers in the 0–12th-grade levels. Nevertheless, we found some evidence to suggest that low-literacy consumers (0–4th-grade equivalent) differ from moderate-literacy consumers (5–12th-grade equivalent) in this regard. Such a pattern is also consistent with Viswanathan, Rosa, and Harris's (2005) qualitative research.
Although our discussion focuses on testing the hypotheses we developed, post hoc examination of individual means and magnitudes of differences in Table 1 provides some additional noteworthy, though tentative, insights. The picture that emerges is more complex than suggested by the direct tests of our hypotheses. In particular, the differences between graphic ratings and graphic ranges and the differences between low and medium literacy levels are noteworthy. Consistent with H2, one pattern to the means that generally held was the more extreme means for the high literacy level for healthful versus unhealthful products compared with the less extreme means for the medium literacy level and the moderate means for the low literacy level.
For the high level of literacy, all formats led to discrimination between healthful and unhealthful brands, consistent with our predictions (Table 1). Moreover, the magnitude of differences between healthful and unhealthful brands appeared to be approximately similar across format conditions. For the medium literacy level, all formats appeared to lead to discrimination for healthfulness and for all nutrient ratings, with the exception of carbohydrates, for which only the graphic range and the graphic rating formats appeared to lead to differences (Table 1). The differences between healthful and unhealthful brands were accentuated for the graphic range and graphic rating conditions for the medium level of literacy compared with the %DV and average conditions (Table 1). Thus, there is some evidence for the higher effectiveness of graphic formats for the medium level of literacy.
Considering means for the low level of literacy, the %DV and average conditions did not lead to discrimination between healthful and unhealthful brands for healthfulness or any other nutrient rating, with the exception of sodium content for the %DV condition (Table 1). It appears that the graphic range led to larger differences in ratings for unhealthful and healthful products for calorie content, fat content, and sodium content, whereas the graphic rating led to larger differences in rating for healthfulness (Table 1). (The graphic rating appeared to lead to differences in rating for fat content and sodium, but the magnitude of these differences was smaller than for graphic ranges.) Perhaps, the healthfulness rating, which is more of a global judgment, is facilitated by the graphic rating format that provides meaningful anchors of high and low, whereas the more specific nutrient ratings are facilitated by numerical anchors. Similar to results for medium level of literacy for the average and %DV conditions, differences did not appear to be sizable for carbohydrate ratings. This may be reflective of the lack of familiarity with this nutrient and a consequent lack of attention devoted to carbohydrate information compared with fat, calories, and sodium. The continuum from low to high literacy may represent a gradual shift from usage of graphic information to usage of both graphic and numerical forms of information.
General Discussion
To our knowledge, this is the first study to examine the use of nutritional labels by low-literate consumers. Our findings suggest improved use of nutritional information for new, graphic formats. Importantly, summary information (e.g., average), which has been shown to benefit literate consumers, was not useful for low-literate consumers. Our findings provide insights into the overall effects of literacy and levels of literacy in which graphic presentations may have advantages. A wide range of literacy levels from 0 to 12th grade appears to benefit from presentations that are in graphic form.
However, our findings point to several complexities that need to be emphasized. For example, there may be differences in how the two graphic formats we investigated are processed and used. As we discussed previously, graphic ratings may facilitate forming a global evaluation of healthfulness, whereas graphic range presentations may help form judgments on specific nutrients, particularly for low levels of literacy. In addition, there may be differences in the ease with which low-literate consumers can process information on specific nutrients regardless of presentation format. For example, low-literate consumers may visualize amounts of sodium and sugar, picturing the actual products, while not being able to visualize relatively abstract ingredients, such as fat and calorie content. They may be able to visualize actual products but not use graphic bars representing amounts of products, a format that is relatively abstract and an indirect representation of amounts. Thus, it is important not to overstate the case and to note that even graphic presentations may not be used by some low-literate consumers.
Further complexities emerged in some shopping observations and in-depth interviews we conducted as a prelude to our experiment. We found that low-literate consumers avoid or limit their reliance on nutrition labels, suggesting additional barriers they face in using nutritional information. Many low-literate consumers may not use nutritional panels or may use only parts of such panels. Additional problems facing low-literate consumers arise from confusion about the meaning of basic nutrient information, such as nutrient values, %DVs, and serving sizes. Nutrient values presented in symbolic, numerical form that do not bear a direct correspondence to reality may be too abstract to facilitate processing. In addition, %DV is an abstraction based on daily diet that low-literate consumers find difficult to process. For example, an informant suggested lowering the %DV of sodium in a food preparation by adding other ingredients (i.e., reducing the 16%DV of sodium in a turkey product by mixing with water when cooking). Nutrient values and their relationships to serving sizes also represent abstractions. In this regard, Viswanathan, Rosa, and Harris (2005) report the lack of use of unit prices by low-literate consumers. Often, low-literate consumers develop rules to use nutrition information that reflect confusion between various aspects of numerical information, such as raw values and %DVs or serving sizes and %DVs. Conversely, our observations and in-depth interviews provided instances in which low-literate consumers were able to understand pictures on packages with a heart sign or of a weighing machine. In summary, these issues point to several barriers that low-literate consumers face, resulting in not using labels or using parts of labels and misinterpreting the information provided.
Theoretical and Practical Implications
From a theoretical perspective, our findings reinforce the difficulty with abstractions and predilections toward concrete and pictographic thinking exhibited by low-literate consumers. Rather than use symbolic, numerical information conveying nutrient values, low-literate consumers find it easier to use graphic representations of nutrient amounts. Prior research has suggested the tendencies of low-literate consumers to base decisions on visualization of usage situations. Our research supports the view that presentations of attribute values in graphic form are less abstract and bear more of a one-to-one correspondence with quantities or amounts at a sensory level.
Whereas prior research (e.g., Viswanathan and Hastak 2002) has suggested the benefits of providing summary information (e.g., average, range) to consumers, the current study finds that low-literate consumers may not benefit from such information. An important policy implication of our research is that graphic approaches to label design may benefit a range of literacy levels. Perhaps graphic ratings presented as a continuum could be combined with average and range information to maximize benefits to consumers across levels of literacy. In this regard, it should be noted that respondents with literacy levels in the 5–12th-grade equivalent range appeared to benefit from using the graphic range and the average.
Whereas our focus in this article is on some carefully circumscribed alternatives for presenting nutrition information in user-friendly formats, it may provide just some elements of a more comprehensive solution. Perhaps a solution that includes health claims as another element may be more likely to succeed in facilitating usage of nutrition information by low-literate consumers. Health claims and, in particular, pictorial representations of such claims represent single pieces of information that summarize across nutrient values and provide an overall judgment. Although health claims are abstractions, they are meaningful to respondents who can readily relate to notions of healthfulness or quality. Moreover, health claims do not require low-literate consumers to abstract across pieces of information, such as calorie and fat content, nor do such claims represent abstractions, such as unit price, to which low-literate consumers cannot easily relate. Conversely, low-literate consumers relate to eating healthful foods and buying good products. In combination with health claims, graphic representations of nutrition information may facilitate usage of nutrition information by low-literate consumers and may lead them to develop knowledge about individual nutrients and their relationships to overall healthfulness.
However, a comprehensive solution should extend well beyond the package or even the retail store to education about nutritional labels in other settings, such as nutrition education programs and adult education programs. Such education should focus on several elements, including specific nutrients and their impact on health and the meaning of raw nutrient values, daily dietary guidelines, and serving sizes. Graphic presentation formats are likely to be particularly effective in combination with educational efforts and health claims. Another relevant factor to this search for a comprehensive solution is the need for labels created by marketers to be easy to understand and compare and the need for regulators to seek out improvements in nutrition labeling in the day-to-day environment that people across a range of literacy face. A multipronged approach is essential to address this issue fully.
Making information more accessible can be beneficial to food producers as well. Food products from companies such as Nabisco or Wal-Mart's Great Values brand provide nutrition information in both Spanish and English to reach out to the growing Latino population in the United States. Offering additional information that helps inform the low-literate consumer would seem to be justified. Some grocery stores, such as Pick ‘n Save in Milwaukee, use pictorial information to help customers navigate store aisles. Another example is the Guiding Stars program developed by Hannaford Bros. after the company found that, in general, consumers were confused about nutrition information (Martin 2006). This program offers ratings of zero, one, two, or three stars, displayed just below prices on the shelves, for nearly all the approximately 27,000 items sold in Hannaford's grocery stores.
An important consideration in any potential changes to existing information is the effect on the general population. However, our experiment suggests that conveying information in graphic formats is helpful for low-literate consumer decision making without having an adverse effect on more literate audiences. In addition, a graphic rating system would require delineation of product categories and computation of the average and the range. The practical challenges associated with this approach have been discussed in previous research (Viswanathan and Hastak 2002). A way to sidestep this issue may be to present the graphic rating while basing it on percentile values along %DVs. This would require delineation of product categories in accordance with what is currently specified for serving sizes. However, the daily diet represents an abstraction that may be difficult for low-literate consumers to factor in when trying to make a choice about a specific product category. Alternatively, retail outlets that cater to low-literate consumers could consider presenting such information on shelves, which would allow for a more comfortable shopping environment for these types of consumers. Such displays are aligned with retailers’ goals of providing customers with helpful information and, in turn, developing a loyal clientele. In many instances, such displays may also be beneficial in promoting retail store brands. In a climate of consumer education and awareness of healthful consumption habits, retailers could also provide such graphic labeling information to highlight attributes that are most relevant to consumers and perhaps create a healthy competition among companies to redesign their products to achieve these goals. In this regard, Viswanathan, Rosa, and Harris (2005) state that practices that recognize and serve low-literate consumer needs are likely to lead to long-term loyalty.
Limitations and Further Research
We employed realistic and complete depictions of the Nutrition Facts panel in our experiments. However, we did not use complete packages. The presentation of nutrition information in isolation combined with an artificial setting may have intensified the attentiveness of participants, thus accentuating effects beyond those likely to occur in a realistic shopping environment. This issue is all the more germane for low-literate consumers, given the cognitive resources they may expend on other tasks while shopping and the overwhelming amounts of information in the retail environment. In addition, the effects of conditions such as the graphic rating or graphic range may have been intensified because these are novel types of information not previously encountered on food labels. However, it should be noted that this possibility did not enhance the effectiveness of the average condition. Moreover, given the problems with using information identified in previous work and suggested by our qualitative research, the effective use of information even under potentially intensified circumstances at the lowest level of literacy is noteworthy.
There are several avenues for further research. One important type of research is to test these effects under more realistic conditions, such as field studies in stores. Such research would allow for the assessment of effectiveness of summary conditions for low-literate consumers in the larger context of shopping with overwhelming information. A second area of research pertains to health claims on food packages. The effectiveness of the graphic rating condition, which provides inferences such as low or high on specific nutrients, and the problems in making abstract judgments about healthfulness point to the possible effectiveness of health claims for low-literate consumers. Health claims provide inferences about abstract healthfulness judgments that may be more easily understood by low-literate consumers. Rather than requiring people to search for individual nutrients and draw broader judgments, such claims may provide useful, preprocessed information. Pictorial representations of health claims, such as heart symbols, may be another potentially effective means to convey information to low-literate consumers.
From a practical perspective, the broader question of how to help consumers make better choices should be addressed. The most direct limitation of our research is the scope of this work with regard to regulators. We focus on the presentation style of the nutritional information label rather than on the content of the labels. The question of what should be shown on these labels is worthy of future exploration, such as the presentation of nutrient information versus overall healthfulness ratings. Although our findings are more focused on the consumer perspective, the effectiveness of retail-level programs, such as Hannaford's Guiding Stars program, suggests that food producers and retailers can also successfully participate in presenting information in a more manageable way. Whether these issues are limited to the low-literate population or pertinent for the general populace is worth examining.
In conclusion, this research, which represents the first attempt to understand the relationship between literacy and usage of nutritional information, has important implications for research and practice in public policy and marketing. Multifaceted solutions that address the complexity and substantial challenges in facilitating usage of nutritional information by low-literate consumers are required in which nutritional formats are but one of a larger set of elements.