
Abstract
Beginning with the 2006–2007 academic year, the U.S. government required that all federally funded schools have local wellness policies to promote healthful living and reduce obesity among their students; however, little evidence exists on which school food policies are effective. This article finds evidence that prohibiting à la carte junk food sales during meals reduces the likelihood that students will be overweight or obese by 18 percentage points. The data are merged student–parent–school survey responses collected from a small sample of schools in one Great Plains state. The estimation controls for students’ activity levels, genetics, and socioeconomic factors; parents’ activity levels and attitudes; and the overall mix of school marketing policies that promote healthful eating and drinking habits. The results indicate that banning à la carte junk food sales is a potentially effective policy to reduce the likelihood of students being overweight and obese.
Studies examining the effects of the school food environment on students’ weight status have been limited to two types: controlled intervention studies and observational studies. In a review article, Peterson and Fox (2007, p. 114) evaluate the evidence from several controlled intervention studies and find that the “existing body of high-quality research on the effectiveness of school-based interventions to prevent or reduce obesity is surprisingly scant and provides limited evidence on which to base recommendations.” Observational studies are scarce because existing data sets with height and weight values contain limited (or no) information on individual, family, or school food environment characteristics. Anderson and Butcher (2006) merge individual-level data from the National Longitudinal Survey of Youth 1997 with county-level school data from the 2000 School Health Policies and Programs Study (SHPPS) data set. Using a two-step procedure, they estimate that a 10 percentage point increase in potential exposure to an unhealthful school food environment increases students’ weight measure by approximately 1%. However, missing individual-level school characteristics required the use of an estimate of the students’ exposure to school food policies, so these results may suffer from measurement error and lack power.
The results of the current study are based on the Socially Constituted Food Consumption of Adolescents Survey (SCFCAS), a unique data set that merges individual student and parent survey information with survey information from the student's school on the school's nutritional policies. The analysis estimates the effect of prohibiting junk food à la carte during school breakfast or lunch periods on the probability that a student is overweight or obese. To minimize specification bias due to omitted variables, the estimation controls for students’ activity levels, genetics, and socioeconomic factors; parents’ activity levels and attitudes; and the overall mix of school marketing policies that promote student nutrition.
Background and School Food Environment
Recent statistics indicate that 14.8% of children and adolescents are overweight and 16.9% are obese (Ogden, Carroll, and Flegal 2010). Overweight children and adolescents are more likely to be overweight or obese as adults, and the likelihood increases if the child has an overweight or obese parent. Among children ages 10–14 who are at risk of being overweight or are overweight, Whitaker and colleagues (1997) find that the chance of being obese as an adult increases by 16 percentage points (from 64% to 80%) if one parent is obese. Today, the likelihood of a child having an overweight or obese parent is high; two-thirds of the U.S. adult population is either overweight or obese. The prevalence of adult obesity has also risen rapidly, doubling since the 1980s to the current 34% (Ogden et al. 2007).
Measurements and Costs of Obesity
The standard U.S. measure to gauge weight status is the body mass index (BMI), which is calculated by dividing weight in kilograms by height in meters squared (kg/m2). For children and adolescents, the Centers for Disease Control and Prevention (CDC) recommends a classification system based on gender- and age-specific (BMI-for-age) growth charts. The child's BMI is calculated and then compared with the BMI-for-age growth chart to obtain a percentile, which determines his or her weight status. Children of a healthful weight have a BMI between the 5th and the 85th percentiles of their respective sex and age group. Similarly, overweight children have a BMI at or above the 85th percentile to less than the 95th percentile, and obese children have a BMI at or above the 95th percentile. For adults, overweight status is defined by a BMI at or above 25 but less than 30, and obesity status is defined by a BMI at or above 30.
The health consequences associated with childhood obesity include immediate risks for arthritis, digestive disruptions, chronic head and knee pain, respiratory complications, sleeping disorders, social stigmatization, and depression; these risks are in addition to the more serious long-term risks of high blood pressure, type 2 diabetes, heart disease, various cancers, and premature death (Ebbeling, Pawlak, and Ludwig 2002; Must and Strauss 1999). Obesity is costly not only to a person but to society as well. Annual medical expenditures are approximately 36%–37% higher for obese adults than for normal-weight adults (Finkelstein, Fiebelkorn, and Wang 2003; Sturm 2002), and the average taxpayer spends approximately $175 per year to finance Medicare and Medicaid recipients with obesity-related expenses (Finkelstein, Ruhm, and Kosa 2005). Wang and Dietz (2002) estimate the health care costs related specifically to childhood obesity and find that the costs more than tripled from 1979 to 1999 (based on 2001 dollars). True economic costs would also include nonmedical expenditures or indirect costs, such as decreased productivity, restricted activity, absenteeism, and bed days. Wolf and Colditz (1998) estimate that in 1995, approximately 48% of the total cost attributable to obesity was indirect costs. Ostbye, Dement, and Krause (2007) estimate that the number of lost workdays per 100 full-time employees from 1997 to 2004 was eight times higher among the heaviest employees (i.e., BMI ≥ 40) than among those of a recommended weight (i.e., 18.5 ≤ BMI ≤ 24.9). The U.S. Surgeon General (2001) declared obesity a national health priority and called for policies to change environments, including schools, to prevent and reduce childhood obesity.
The National School Lunch Program and the School Breakfast Program
We obtained information on the National School Lunch Program and the School Breakfast Program from the U.S. Department of Agriculture (USDA) Food and Nutrition Service Web site (http://www.fns.usda.gov/cnd). Historically, food at school has been available to students through these federal school meal programs. In 1946, the National School Lunch Program was established to address malnutrition concerns among children and to support farmers with surplus commodities, both results of the Great Depression. The provision of federal meals by schools was further expanded when the School Breakfast Program became permanent in 1975.
In fiscal year 2007, more than 30.5 million children were served lunch and 10.1 million were served breakfast each school day, and the federal government spent approximately $8.7 billion and $2.2 billion on the lunch and breakfast programs, respectively. The USDA reimburses cash subsidies and distributes food commodities to participating schools for each meal they serve that meets USDA requirements and is offered for free or at a reduced price to eligible children. In fiscal year 2007, approximately 80% of students received breakfast for free or at a reduced price. The USDA's nutrition regulations require schools to provide meals that are consistent with the goals of the 1995 Dietary Guidelines for Americans. Thus, it is recommended that no more than 30% of students’ calories come from fat and less than 10% come from saturated fat. In addition, lunch meals are required to provide one-third of the recommended dietary allowances of protein, vitamin A, vitamin C, iron, calcium, and calories; breakfast meals are required to provide one-fourth of the recommended dietary allowances of these nutrients.
Competitive Foods and School Nutrition Policies
“Competitive foods” refer to all foods and beverages at school that are sold outside the federal school meal programs (USDA 2001). During the 2003–2004 school year, 83% of elementary schools, 97% of middle schools, and 99% of high schools sold competitive foods through one or more of the following venues: à la carte lines, vending machines, snack bars, and school stores (U.S. Government Accountability Office 2005). The foods and beverages most commonly sold through these venues include soft drinks, sports drinks, fruit drinks that are not 100% juice, salty snacks that are not low in fat, baked goods that are not low in fat, and 100% fruit and vegetable juice (Wechsler et al. 2001).
Currently, the majority of competitive foods are exempt from any USDA restrictions. The exception is a small subset of competitive foods categorized as foods of minimal nutritional value (FMNV), which include soda drinks, water ices, chewing gum, and certain candies (hard candies, jellies and gums, marshmallow candies, fondant, licorice, spun candy, and candy-coated popcorn) (USDA 2008a, b). The USDA regulations prohibit schools from selling FMNV in the food service area during meal times; however, such foods can be available for sale elsewhere throughout the school at any time (USDA 2008a, b). Many foods that are generally accepted as junk foods, such as cookies, candy bars, (nonbaked) potato chips, and other salty or high-fat snack foods, often do not fall under the FNMV definition and are sold alongside federally approved school meals (Institute of Medicine 2005).
State and local school authorities may impose additional restrictions on all foods sold throughout the school day (USDA 2008a, b). However, it is often argued that revenue generated from competitive food sales helps school administrators balance their budgets and provides alternative funds for student activities not covered by school budgets (Anderson and Butcher 2006; U.S. Government Accountability Office 2003). During the 2003–2004 school year, approximately 30% of all high schools generated more than $125,000 per school through competitive foods sales, while 27% of all middle schools generated more than $50,000 per school through competitive food sales (U.S. Government Accountability Office 2005). Evidence suggests that the availability of competitive foods in schools is negatively related to fruit and vegetable consumption and positively related to calories obtained from fat (Harnack et al. 2000; Kubik et al. 2003; Weber and Zakeri 2004).
The 2006 CDC SHPPS survey results show some improvement in schools’ nutrition policies compared with the previous 2000 SHPPS survey results. O'Toole and colleagues (2007) find that more schools are including more healthful food and beverage options in the school cafeteria, school stores, canteens, and vending machines; between 70% and 87% of middle schools and high schools now offer fruits, vegetables, and salads à la carte. In addition, more states and districts are requiring or recommending restrictions on junk food sales in different school settings; however, there is still much room for improvement. Between 56% and 68% of middle schools and high schools offer high-fat cookies and crackers and approximately 43% offer salty, high-fat snacks. The 2006 survey results also show that between 51% and 74% of middle schools and high schools receive a percentage of soft drink sales, 38% to 57% have exclusive contracts with soft drink companies, and 51% allow soft drink companies to advertise on school vending machines. Students are sent a mixed message when nutrition and healthful choices are taught in the classroom but foods and beverages high in fat, sodium, and added sugars are widely advertised and offered in vending machines, in school stores, and as à la carte choices (O'Toole et al. 2007).
School Food Environment in the Survey State
In addition to the USDA regulations, the program agreement between the Department of Education and school food authorities in the state under study requires schools participating in the National School Lunch Program and the School Breakfast Program to adhere to the following three stipulations: First, no food or beverages can be sold to children anywhere on school premises beginning one half hour before breakfast and/or lunch service until one half hour after meal service unless all proceeds earned during these times go to the school nutrition program. Second, if a vending machine, not operated by the school nutrition program, is open during the meal service period, the profit during that period must go to the school nutrition program. Third, no FMNV can be sold in the food service areas beginning one half hour before breakfast and/or lunch service until one half hour after meal service under any circumstances (Benes 2008).
In effect, these state regulations for FMNV are slightly more restrictive (sales are prohibited from one half hour before to one half hour after meal service) than the FMNV regulations set by the USDA (sales are prohibited for duration of meal service only). Furthermore, junk foods (foods that provide calories mainly through fats or added sugar and have minimal amounts of vitamins and minerals, such as regular chips, French fries, cookies, and ice cream) that are not considered FMNV can be sold in à la carte lines and vending machines alongside the National School Lunch Program and the School Breakfast Program meals only if the proceeds go to the school nutrition program.
Data and Methods
This article uses merged student, parent, and school data for seventh- and tenth-grade students (ages 12–18 years) from the SCFCAS collected during the 2005–2006 and 2006–2007 academic years. The SCFCAS was administered to students at eight schools throughout a state in the Great Plains who agreed to participate and were in attendance that day. The schools were selected from two urban and two rural school districts within the state. The response rate averaged 32% and resulted in a total of 180 pairs of student–parent responses. The low response rate reflects our need for survey responses from both the students and their parents. Although teacher endorsement and entry in a drawing for a gift certificate served as incentives for students to return their surveys, no explicit incentives were provided to the students’ parents.
The cross-sectional data are unique; they contain information on the student, his or her parent, and his or her school's marketing policies that promote nutrition. For the purpose of this study, we also collected student data on sports participation; location of breakfast and lunch; and demographic variables, including self-reported height and weight. In addition, we gathered parent information on educational level, parental monitoring, self-reported height and weight, and attitudes toward advertising and school food and beverage marketing. The number of student–parent surveys that contain all the necessary information is 134.
We asked administrators to complete a survey on their school's nutrition policies. The questions in the survey were based on the CDC's SHPPS survey that has been administered nationally every six years since 1994. We used the answers to specific nutrition policy survey questions, such as whether the school prohibited the sale of junk foods in different venues or allowed soft drink advertising in different school locations, to construct a measure of the school's mix of marketing policies that promote nutrition. Seven of the eight schools returned completed surveys, thus requiring one of the high schools to be dropped from the analysis. The final sample size of student–parent–school information available for our empirical study is 120.
Nutrition Policies of Sample Schools
Although all schools in our sample are subject to the state's regulations on FMNV and junk food sales, some schools have chosen to implement more restrictive policies on junk food sales. The specific focus of analysis is on the effect of the binary variable NOJUNKMLS, which indicates whether the school prohibits the sale of junk food à la carte during breakfast or lunch. Five of the eight school principals in our sample answered yes to the question, “Does this school prohibit offering junk foods à la carte during breakfast or lunch periods?” Two middle schools, a high school, and two combined middle/high schools imposed this restriction; two high schools and a combined middle/high school did not.
The principals of the schools in our sample were likely to be knowledgeable about their school's specific school food policies. First, the U.S. government required all schools receiving federal funding (including the public schools in our sample) to have in place local wellness policies to promote healthful eating and reduce childhood obesity by the beginning of the 2006–2007 school year. We administered the student, parent, and school administrator surveys in April 2006 (four months before the wellness policy deadline) and April 2007 (eight months after the wellness policy deadline). Second, because of the relatively small size of each of the schools, the principals were likely to be directly involved in the development of the wellness plan and thus aware of foods and drinks that are considered healthful. Third, the questions about school health policies contained in the school administrator survey were taken directly from the SHPPS survey, which has been administered to a nationally representative sample of school administrators in the United States every six years beginning in 1994. The results of the two most recent SHPPS surveys showed the pervasiveness of unhealthful school food environments and served as an impetus for the U.S. Surgeon General's (2001) call to schools to develop plans to promote healthful eating and reduce childhood obesity.
To isolate the effect of prohibiting à la carte junk food sales at meals, the analysis must control for the overall mix of nutrition policies in place at the school. Seven of the initial eight school administrators surveyed provided sufficient information to construct a measure of their school's overall policy mix. We conducted the surveys in April, and the policies had been in place the entire academic year, so students had been exposed to the policies for at least eight months. We constructed the variable HEALTHYSC by adding the number of marketing policies that promote nutritious foods and beverages and subtracting the number of policies that promote unhealthful foods and beverages. Schools promote unhealthful foods or drinks through (1) soft drink advertising, (2) soft drink or junk food marketing, and (3) offering brand-name fast foods. They promote healthful food and drinks by (4) restricting junk food sales and (5) providing nutritional information to students (for details of how we constructed the policy measure and its components, see the “Overall Mix of Nutrition Policies Variable” section in the Appendix).
Empirical Model
For all adolescent age–sex groups, there has been increasing skewness in the BMI distribution, with a greater shift in the upper part of the distribution. This suggests that adolescents in the upper part of the distribution are more susceptible to environmental influences than those in the middle or left part of the BMI distribution (Eriksson, Rasmussen, and Nordqvist 2005; Flegal and Troiano 2000). Moreover, children and adolescents whose BMIs exceed the 85th or 95th percentiles (i.e., are overweight or obese) have the greatest health risks associated with excess body fat. Thus, we estimate the effect of the NOJUNKMLS policy on the binary variable, OVWTOBESE, which indicates whether the student's self-reported BMI is at or above the 85th BMI-for-age percentile. (The number of students classified as obese on the basis of their self-reported heights and weights is too small for accurate estimation of an obesity equation.)
Building on the work of Anderson and Butcher (2006), we constructed an empirical model of students’ weight status to capture the effect of school food policy. In addition to the control variables that Anderson and Butcher use, we control for whether the student eats breakfast in the school cafeteria, the student's physical activity expenditure, and family influences. Using ordinary least squares (OLS) and logit, we estimated equations of the following form:

The effect of NOJUNKMLS, the school policy to prohibit junk food sales à la carte at meals, is equal to the difference in the probabilities of being overweight or obese for students attending a school that prohibits junk food at meals (NOJUNKMLS = 1) and students attending a school that does not (NOJUNKMLS = 0). The OLS model restricts this effect to be the same for all students, whereas the logit model allows the policy effect to depend on the student's and school's characteristics.
Individual Influences
Current estimates of the prevalence of obesity by sex and age indicate that obesity rates are higher among boys than girls for all age groups (2–5 years, 6–11 years, and 12–19 years) and are highest among children ages 6–11 for both sexes (Ogden et al. 2007). Body mass indexes tend to increase with the age of the child; however, the overweight or obese indicator, OVWTOBESE, is based on BMI percentiles that are adjusted for sex and age. Because the ages of the students in our sample fall within the 12–19 age range and the measure of overweight versus obese is age adjusted, the marginal effect of age on OVWTOBESE is negligible, and we do not include it in the regressions.
Nationally representative data indicate that there is an inverse relationship between children's socioeconomic and weight status (Institute of Medicine 2005). We use a measure of the parent's educational attainment as a gauge of the student's socioeconomic status. (Too few parents reported their income levels to control directly for family income.) The parents were given the following choices for their educational attainment: none, GED (General Education Development), high school diploma, associate/junior college, bachelor's degree, master's degree, and doctoral or professional degree. Only one parent had less than a high school diploma, and of those with a higher level of education, the majority had a bachelor's degree. Therefore, we dichotomized the educational measure into less than or equal to a high school degree (HIGHEDUC = 0) and more than a high school degree (HIGHEDUC = 1).
Although genetic characteristics change too slowly over time to explain the recent rise in obesity, approximately 70% of the genetic–environment weight variation can be attributed to genetics (Birch and Davison 2001). We included the logarithm of the parent's self-reported BMI to control for a genetic influence on the weight status of the student. It could be argued that the parent's weight status captures family environmental factors instead, such as eating behaviors. However, adoption studies show that a correlation exists between the BMI of people who have been adopted and the BMI of biological parents and full siblings, whereas no correlation exists between the BMI of people who have been adopted and their adoptive parents (Sorensen et al. 1992; Stunkard et al. 1986). In our sample, only 3 of the 120 parent respondents were not the child's biological parent.
The 2005 “Dietary Guidelines for Americans” recommend that children and adolescents engage in at least 60 minutes of physical activity at a moderate intensity level most days of the week, preferably daily (CDC 2007). In 2005, only slightly more than one-third of high school students engaged in the recommended levels of physical activity, whereas nearly 10% did not engage in any vigorous or moderate physical activity at all (CDC 2006). To control for energy expenditures, we include a binary variable, “student is physically active,” which equals 1 if the student answered “agree” or “strongly agree” with the statement “My friends and I play some kind of sport at least once a week.”
Recent studies have indicated that eating breakfast or lunch at school is associated with a more nutritious diet and possibly a lower risk of obesity for students. Rainville (2001) finds that students who eat school meals rather than bring lunch from home consume 29% fewer calories from fat; Bhattacharya, Currie, and Haider (2004) provide evidence that the School Breakfast Program increases the quality of food consumed by students, including lowering the percentage of fat calories; and Jones and colleagues (2003) find that girls in food-insecure households who participate in both the National School Lunch Program and the School Breakfast Program have a lower risk of being overweight.
Our data identify whether the student usually eats breakfast and lunch and, if so, the location of the meals; the data do not identify whether a student who eats breakfast or lunch in the school cafeteria eats a federally approved school meal or eats à la carte food or some combination of the two. Even so, it is important to control for students’ choices whether to eat and where to eat breakfast and lunch because these might be correlated with the school's nutrition policies and also with students’ weight measures. We examine different empirical specifications to investigate (1) whether lunch and breakfast location, or skipping meals, is associated with the student's weight or overweight status, after controlling for the school's nutrition policy, and (2) whether the effect of the policy depends on meal location by interacting lunch and breakfast location variables with the policy variables. Across all model specifications, only breakfast location is statistically significantly related to the student's probability of being overweight or obese. Thus, the preferred model controls for the location of the student's breakfast by including a binary variable that equals 1 if the student usually eats breakfast at school.
Family Influences
In addition to the parents’ genetic influence on the child's risk of obesity, the parents’ behavior and attitudes might influence the child's weight status. We include two measures of parental behavior: the parents’ physical activity, measured as the typical number of days per week the parent engages in non-work-related physical activity, and a multi-item parental monitoring scale that measures the degree to which the parent monitors the child's behavior and advocates parental control. Research by Birch and Davison (2001) indicates that young children base what and when they eat on internal or self-regulating cues, whereas older children base what and when they eat on external (“wait until dinner” or “finish your plate”) cues. Parents develop schedules for when meals are eaten and are gatekeepers for what food is consumed; however, evidence suggests that “high levels of parental control over children's eating is paradoxically related to higher weight among children” (Wilfley and Saelens 2002, p. 430). We included two measures of parental attitudes: multi-item scales that measure the parent's attitude toward advertising and the parent's attitude toward marketing food and drinks to children at school. Other studies have shown that parents who have a more negative attitude toward marketing directed at youth also believe that this practice can lead to obesity in their children (Kasser and Linn 2004; Larson and Story 2008) (for details on the construction of the three scales, see the “Family Influences” section in the Appendix).
Descriptive Statistics
Means and standard deviations for all variables that are included in the regressions appear in Table 1. The descriptive statistics reflect the entire sample, for boys and girls attending schools that do not prohibit à la carte junk food sales at meals, and for boys and girls attending schools that prohibit à la carte junk food sales at meals. Table 1 also shows the results of the tests of differences in the variables’ mean values between all students, girl students, and boy students who attend schools that prohibit junk food at meals and those who attend schools that do not prohibit junk food at meals. A matrix of correlations between pairs of regression variables appears in Table 2.
Means and Standard Deviations
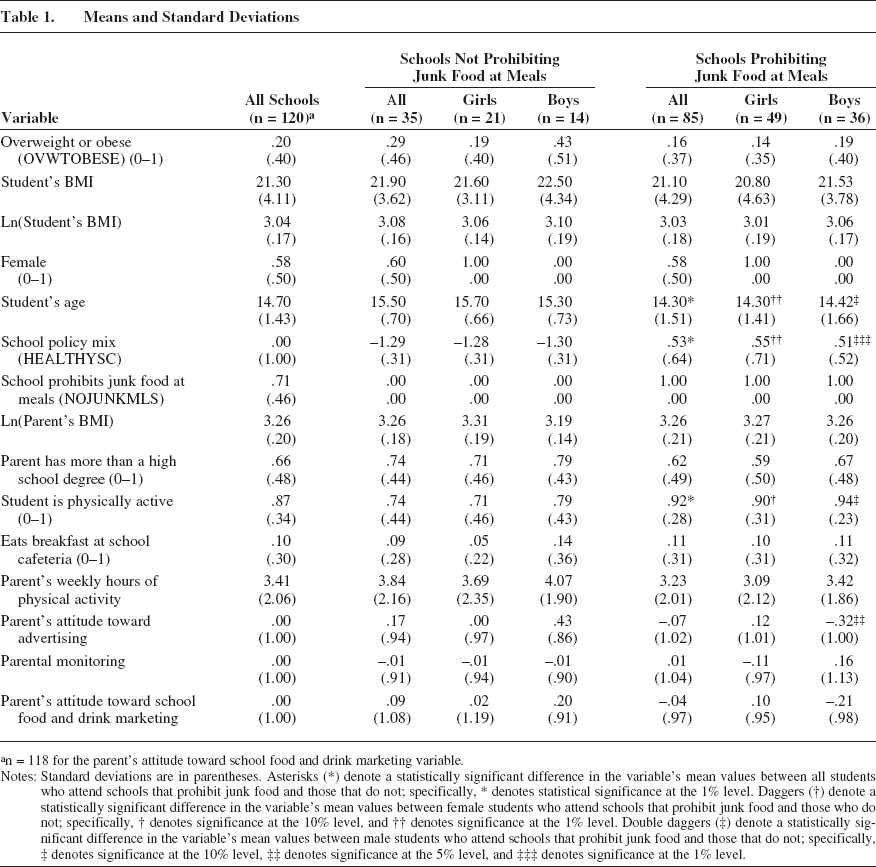
n = 118 for the parent's attitude toward school food and drink marketing variable.
Notes: Standard deviations are in parentheses. Asterisks (*) denote a statistically significant difference in the variable's mean values between all students who attend schools that prohibit junk food and those that do not; specifically, * denotes statistical significance at the 1% level. Daggers (†) denote a statistically significant difference in the variable's mean values between female students who attend schools that prohibit junk food and those who do not; specifically, † denotes significance at the 10% level, and †† denotes significance at the 1% level. Double daggers (‡) denote a statistically significant difference in the variable's mean values between male students who attend schools that prohibit junk food and those that do not; specifically, ‡ denotes significance at the 10% level, ‡‡ denotes significance at the 5% level, and ‡‡‡ denotes significance at the 1% level.
Correlation Matrix of Regressors
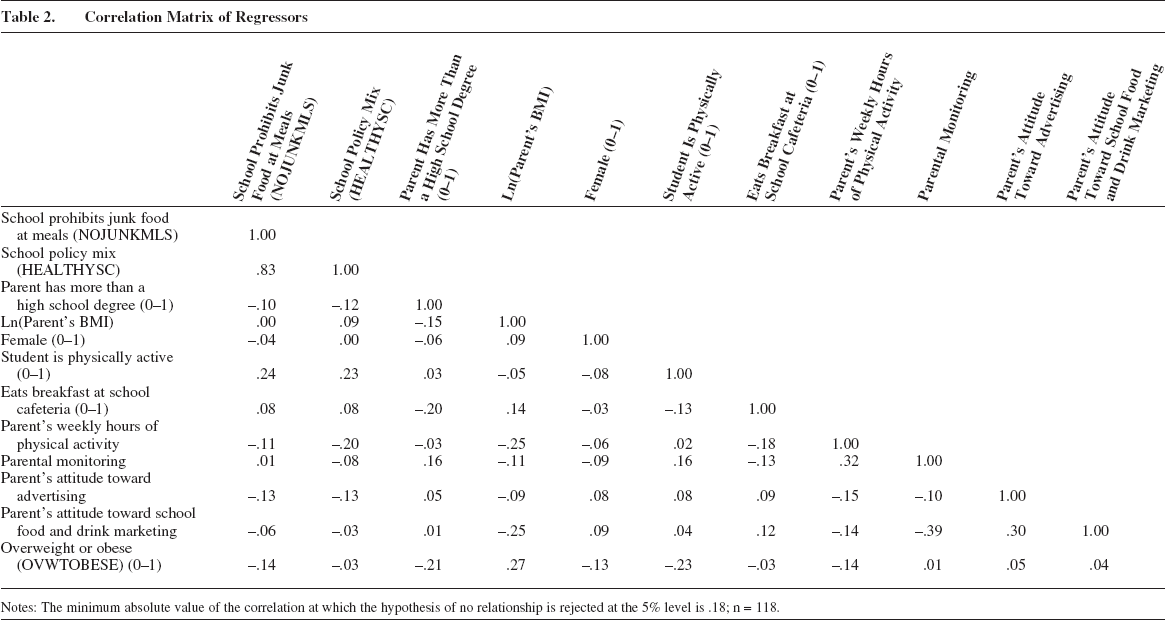
Notes: The minimum absolute value of the correlation at which the hypothesis of no relationship is rejected at the 5% level is .18; n = 118.
Of the student survey respondents, 58% are girls, the average age of the boys and girls is 14.7 years, and 95% of the students identified themselves as white. The mean BMI (calculated from the students’ self-reported heights and weights) is 21.3. The proportion of all students whose BMI is at or above the 85th percentile of the age-and-sex-adjusted BMI distribution is .20; however, this proportion varies substantially between the boy and girl respondents. Of the boys, 26% are classified as overweight or obese compared with only 15.7% of the girls. Nationally representative data for adolescents ages 12–19 indicate that approximately 38.7% of white boys and 30.4% of white girls are overweight or obese (Ogden et al. 2007). Representative data based on self-reported heights and weights for 9th- to 12th-grade students living in the survey state indicate that 28.7% of boys and 20.6% of girls are overweight or obese (CDC 2006). These figures provide a more relevant benchmark for this sample because the BMI figures are based on self-reported data and the residents of the survey state have lower overweight and obesity rates than the national average.
A comparison of the students’ self-reported weight measures across the two school types shows little difference in average BMIs (or ln[BMIs]). However, the sample proportion of students who are overweight or obese is substantially higher in schools that allow à la carte junk food sales: 29% versus 16%. Nevertheless, this difference is estimated too imprecisely to provide statistical evidence that the proportion of overweight or obese students is lower at schools that ban à la carte sales of junk food during meal times. Only 10% of the students usually eat breakfast in the school cafeteria, and this proportion is roughly constant across schools. The data indicate that, on average, students attending schools that restrict junk food sales are younger and are more likely to participate in a sport at least one time per week than students attending the other schools in the sample.
Though not reported in the table of descriptive statistics, the parents range in age from 27 to 66 years, with an average age of 44 years. The majority of the parents who responded to the survey are women and are well educated, and 66% of all the parents have more than a high school degree. On average, the parents engage in non-work-related physical activity 3.4 days per week. The average self-reported BMI of the responding parent is approximately 27, which is above the cutoff for being classified as overweight, and approximately 53% of the responding parents are overweight or obese. However, weight status varies between the male and female respondents. The average reported BMI of the mothers is 26.3, and 45.7% are overweight or obese. The average reported BMI of the fathers is 27.9, and 76.9% are overweight or obese. Nationally representative data indicate that for white adult women, the average BMI is approximately 27.6, and 58% are overweight or obese; for white adult men, the average BMI is approximately 27.9, and 70.6% are overweight or obese (Ogden et al. 2007).
Four of the control variables listed in Table 1 are standardized to have zero means and unit standard deviations: the measures of the parent's attitude toward advertising, attitude toward food and drink marketing in school, and attitude toward parental control and monitoring children's behavior, as well as the school's overall mix of policies that promote nutrition. The means of the parental attitudes and monitoring are essentially the same across schools except when comparing boys’ parents’ attitudes toward advertising. The mean attitude toward advertising measure is almost one standard deviation lower for parents of boys in schools that prohibit à la carte junk food at meals, suggesting that those parents hold a less variable view of advertising than parents of boys attending schools that do not restrict junk food sales at meals.
The mean value of the overall school nutrition policy measure, HEALTHYSC, is almost two standardized units higher at schools that prohibit junk food sales à la carte during meals than at schools that do not. This suggests that, on average, a student who attends a school that restricts access to junk food at meals is also less likely to be exposed to other marketing practices that promote unhealthful food and drinks.
Anderson and Butcher (2006) show that there is a relationship between school nutrition policies and county budgetary pressure when county budgetary pressure is measured by the share of total state revenue the county receives and by tax and expenditure limits the state imposes. Schools in counties with greater budgetary pressure are less likely to restrict junk food because revenues generated from these sales help with budget shortfalls. Contrary to this, Anderson and Butcher also find that schools in counties with lower per capita income are more likely to restrict junk food. We find similar evidence in this study. On average, the parents of students in the sample who attend a school that prohibits junk food at meals are less educated, with 62% having more than a high school degree compared with 74% of the parents of students in the sample who attended other schools. We also found that the schools with a higher percentage of students eligible for a free or reduced-price lunch are more likely to restrict à la carte junk food sales at meals.
Overall, the descriptive statistics indicate that there are some individual and family characteristics of students attending a school that restricts à la carte junk food that would suggest that they are less likely to be overweight or obese. However, there are others that would lead to the opposite conclusion. Table 1 also shows that schools that restrict junk food sales during meals are also more likely to provide a more healthful food environment. The estimation method controls for the measured differences across students and schools and isolates the impact on the probability of a student's being overweight or obese of prohibiting junk food at school meals.
Effect of School Food Policy on Student Weight
Ordinary least squares or logit estimates of the model may be inconsistent if schools do not impose school food policies randomly but rather modify the school food environment either because weight problems among students are a concern or because unobserved characteristics affect both school policies and student weight status. In the absence of a controlled experiment, part of the estimated policy effect may be capturing the effects of these omitted variables. This study reduces the omitted variables bias and isolates the effect of NOJUNKMLS on the students’ weight measures by taking advantage of the information in the unique data set that was unavailable to Anderson and Butcher (2006). First, there is an extensive list of individual and family characteristics beyond basic demographic and genetic variables. Second, we also control for the school food environment by including HEALTHYSC, a measure of the school's overall mix of policies that promote nutrition. After the general school food environment is accounted for, schools that ban junk food at meals can be identified, and the effect of this policy on students’ weight measures can be estimated. Therefore, this study directly estimates the relationship between school food policies and students’ weight. In contrast, Anderson and Butcher cannot identify the school the adolescent attends and therefore must predict the adolescent's school food policy. They predict the adolescent's exposure to a specific policy by estimating the proportion of schools in the adolescent's county of residence that have the specific school policy in place. Their study estimates the effect of the predicted exposure rather than the effect of the actual policy on adolescents’ weight measures.
Table 3 presents the OLS and logit results of two model specifications. Specification 1 controls for the natural logarithm of the parent's BMI, the student's sex, the parent's education level, the student's and the parent's physical activity, whether the student eats breakfast at the school cafeteria, and the parental behavior and attitude measures. Specification 2 adds the school policy variable NOJUNKMLS while controlling for the school's overall policy mix HEALTHYSC. 1 Because there are two missing observations on the parent's attitude toward marketing food and drinks at school, the number of observations used in estimation is reduced from 120 to 118.
Factors Affecting Student Overweight or Obesity
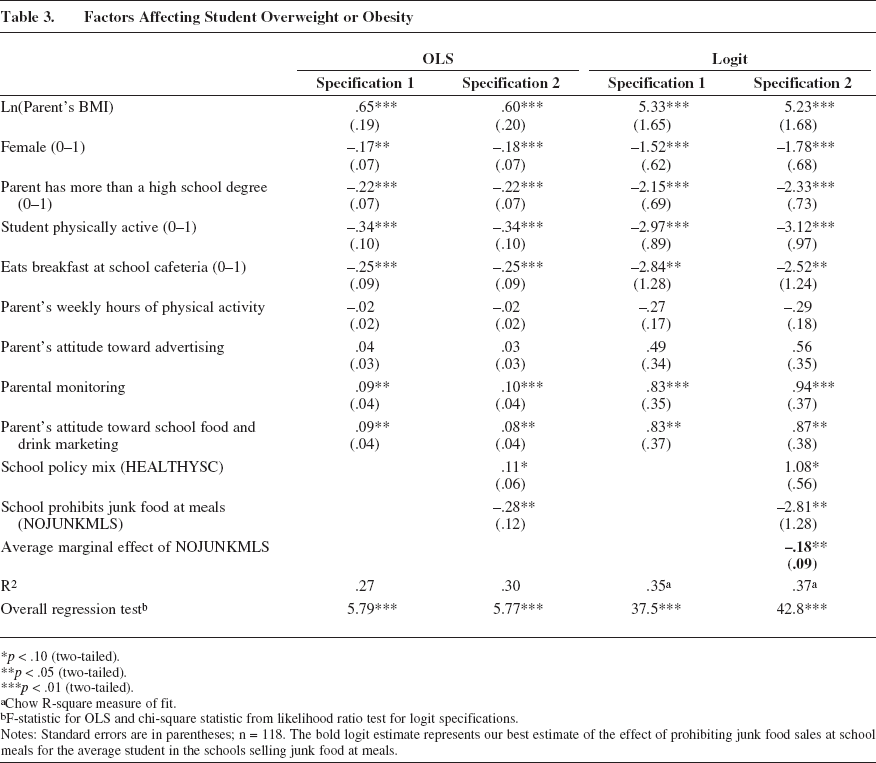
p < .10 (two-tailed).
p < .05 (two-tailed).
p < .01 (two-tailed).
Chow R-square measure of fit.
F-statistic for OLS and chi-square statistic from likelihood ratio test for logit specifications.
Notes: Standard errors are in parentheses; n = 118. The bold logit estimate represents our best estimate of the effect of prohibiting junk food sales at school meals for the average student in the schools selling junk food at meals.
We estimated regression models explaining BMI and its logarithm with the student's age included as an additional explanatory variable. The OLS results showed that students who are female, are physically active, eat breakfast in the school cafeteria, and have a more educated parent have a lower BMI. In addition, as the student ages, as the parent's BMI increases, and as the parental control measure increases, the student's BMI increases. Although the estimated effect of NOJUNKMLS is negative, it is estimated too imprecisely to be statistically significant. These results are available on request.
The OLS results show that the students’ weight status is associated with many of the individual and family influences, as we expected. For ease of presentation, we frame the discussion in terms of Specification 2. The estimated coefficient on the logarithm of the parent's BMI shows that the student's weight status is positively associated with the parent's weight status. The relationship is statistically significant at the 1% level and supports the medical evidence that genetics plays an important role in determining body weight. The estimate suggests that, on average, a 10% increase in the parent's BMI is associated with a .06 increase in the student's probability of being overweight or obese. To put this into perspective, an adult who is 5 feet 5 inches and 140 pounds would need to gain 14 pounds to increase his or her BMI by 10%. Cutler, Glaeser, and Shapiro (2003) estimate that the 10- to 12-pound median weight increase among adults over the past two decades required energy consumed to exceed energy expended by only 100–150 calories per day.
The estimated relationship between the student's BMI and his or her sex, activity level, and breakfast location is consistent with that found in previous studies. According to the OLS estimates, a female student is expected to be .18 less likely to be overweight or obese than a male student with the same characteristics. Students who participate in a sport at least once a week are expected to be .34 less likely to be overweight or obese than those who do not. The results also show that students who usually eat their breakfast at school have a .25 lower probability of being overweight or obese than students who either skip breakfast or eat at home.
The OLS results also indicate a statistically significant, negative association between the student's weight measure and the parent's education and a statistically significant, positive association between the student's weight measure and the degree of parental monitoring. A student whose parent has more than a high school education is expected to be .22 less likely to be overweight or obese than a student whose parent's educational attainment is a high school degree or less. An increase of one standardized unit in parental monitoring is associated with a .10 higher probability of the child's probability of being overweight or obese; this is consistent with Wilfley and Saelens's (2002) findings. The parental attitude variable, parent's attitude toward school food and drink marketing, is also a statistically significant predictor of OVWTOBESE. A student whose parent has a more positive attitude toward marketing food and drinks in school is more likely to be overweight or obese. As we noted previously, research has found that parents who have a more negative attitude toward marketing to children and adolescents view this marketing as being related to more obese children. It is reasonable to believe that parents who have a more positive attitude toward the marketing of foods and beverages to their children would not believe that this relationship increases obesity and therefore would be more willing to purchase the products being marketed. The point estimates also indicate that the student's probability of being overweight or obese is negatively related to the parent's physical activity levels and positively related to the parent's attitude toward advertising; however, these estimates are not statistically significantly different from zero.
For the purpose of this study, the most important coefficient is the estimated effect of the school policy variable, NOJUNKMLS, on the student's weight outcome. The OLS results in Table 3 indicate that given the student and family characteristics and given the overall food policy mix of the school (HEALTHYSC), the proportion of overweight or obese students is lower in schools that prohibit à la carte junk food sales at meals. According to the point estimate, if we compare two schools, each with the same overall mix of nutrition policies and the same student population, the proportion of overweight or obese students would be predicted to be .28 lower at the school that prohibits junk food sales at meal times.
The second panel of Table 3 reports the logit parameter estimates and their standard errors from both specifications as well as the estimated average effect of the school policy variable, NOJUNKMLS. The logit estimates provide a more appropriate measure of the expected benefit of the school food policy: the change in the probability of being overweight or obese from banning junk food at meals for the typical student who attends a school that allows à la carte junk food sales during meals.
As we expected, the signs of the estimated coefficients are the same in the logit model as in the linear probability model, indicating that both models predict the same directions of the marginal effects. In addition, the explanatory variables that are statistically significant are the same for each model. The results from each specification show that the probability of being overweight or obese is lower if the student is a girl, participates in sports, eats breakfast at the school cafeteria, and has a parent with more than a high school degree. The probability of a student's being overweight or obese increases as the parent's BMI increases, as the extent to which the parent monitors his or her child's behavior increases, and as the parent's attitude toward food and drink marketing at school becomes more favorable.
After controlling for the overall mix of nutrition policies at the student's school, the student's sex, the parent's weight, the student's activity level, the student's breakfast location, the parent's education level, the parent's activity level, and the parent's attitudes, we find that the student is less likely to be overweight or obese if his or her school prohibits junk food à la carte at meal times. To gauge the magnitude of the potential health benefit of this school food policy, we calculate the reduction in the probability of being overweight or obese due to NOJUNKMLS for the average boy and the average girl in our sample who attend a school that does not prohibit junk food sales at meals. The estimated effect on the average boy (evaluated at the means of the explanatory variables of boys at these schools) is –.25 and is weighted by the proportion of boys attending these schools (14/35). The estimated effect on the average girl at these schools is –.13 and is weighted by the proportion of girls attending these schools (21/35). The weighted average of the two estimates is the reported average marginal effect and measures the expected reduction in students being overweight and obese if these schools were to prohibit junk food sales at meals (average treatment effect on the untreated). According to the point estimate, if we compare two schools, one that prohibits à la carte junk food sales at meals and one that does not, but otherwise have identical mean characteristics (i.e., those of our sample schools that do not restrict junk food at meals), the proportion of overweight or obese students is expected to be .18 lower at the school that prohibits junk food at meals.
General Discussion
The upward trend in the incidence of obesity among children and adolescents has gained national attention and has motivated calls for immediate action to alter environments to prevent or at least reduce the chances of being overweight and obese. The school environment plays an important role in shaping eating habits among youths because they spend one-fourth to one-third of their day at school. This article explores the link between prohibiting junk food in the à la carte lines at school breakfast and lunch and the proportion of students who are overweight or obese. The unique, merged student–parent–school administrator survey data provide a rich set of control variables to isolate the effect of the no-junk-food policy on the student weight measures. In particular, we constructed a measure of each school's overall mix of marketing policies that promote healthful food and drink choices to proxy for the unobserved effect of a healthful school food environment in the empirical model to isolate the effect of prohibiting junk food at meals.
The empirical results indicate that a school that prohibits junk food sales at meal times tends to have a smaller proportion of overweight or obese students than a school (with the same overall marketing policy mix and a similar student body) that does not prohibit junk food sales during meals. The results predict an 18 percentage point reduction in students who are overweight or obese if schools that currently allow junk food sales were to ban the sale of junk food during meal times. This estimated effect is about as large as the impact of a parent having more than a high school degree.
Policy Implications
Despite the limited sample size and targeted geographical area, the results have potentially important policy implications. Recently, the state in this study was not ranked among the states with the lowest rates of overweight and obese children 10–17 years of age, nor did it have legislation in place pertaining to nutrition standards for school meals and/or competitive foods (Trust for America's Health 2009a, b). The evidence from this study suggests that school food policies that restrict the availability of unhealthful food and drinks can be effective tools to promote a more healthful school food environment and, ultimately, to reduce childhood obesity. Public health officials should consider expanding the USDA ban on schools’ selling FMNV during meal times to include all junk food à la carte selections.
Marketers of foods and beverages to children and adolescents would be wise to limit or eliminate their sales of junk foods in schools. With the increasing U.S. consumer interest in more healthful foods and beverages, these marketers would benefit in the long run by developing more healthful choices. Marketers have known for some time that building long-term relationships with their consumers is much more profitable than having a constant turnover of buyers. In addition to the increasing number of parents who believe that there is a relationship between food and beverage marketing and childhood obesity (Kasser and Linn 2004; Larson and Story 2008), there is a growing number of student groups that are requesting more healthful choices in schools (Carter and Hammond 2007; Reist 2007a, b).
Limitations of Study and Further Research
The goal of this study was to estimate the effect of schools’ prohibiting junk food sales at meal times on the probability of students’ being overweight or obese. The analysis was based on survey responses from a cross-section of students, their parents, and the students’ school principals. Although the statistical analysis attempted to isolate the effect of the school food policy by controlling for several student and parent characteristics believed to affect student weight, as well as the overall marketing policies of the school to promote nutrition, the resultant estimates could still suffer from bias due to self-reporting error, omitted variables, and policy endogeneity.
The data were not generated from a controlled experiment. The schools’ marketing policies to promote nutrition, including prohibiting junk food sales at meal times, could be correlated with features of their student populations that were omitted from the regression. To eliminate the effect of this bias, student weight measurements should be compared before and after random assignment of food policies across schools matched by average student characteristics. Absent such a controlled experiment, statistical analysis based on student observations over two or more years would reduce any bias due to omitted student or family characteristics that change slowly over time.
Another source of potential bias in estimation is due to the use of self-reported weight measures. Studies examining the relationship between self-reported heights and weights and measured heights and weights have found that overweight people (both adults and adolescents) tend to underreport their weights. Estimation using body fat measures based on self-reported data will result in biased coefficient estimates only if the self-reporting errors are correlated with the explanatory variables. Statistical procedures to correct for self-report bias require both a large sample of primary data and an independent validation data set. To correct for the effect of self-reporting error on the estimated effect of school food policy on students’ weight, the validation data must contain both measured and self-reported heights and weights of students and their parents and food policies of the students’ schools. Construction of such a validation data set would be an important contribution to future empirical research on adolescent obesity.
To isolate the effect of the specific school policy of restricting sales of junk food at meal times, this study included a scaled measure of the overall mix of school marketing policies that promote student nutrition. The measure included policies such as schools’ selling brand-name fast food, allowing soft drink advertising on vending machines and school grounds, and participating in exclusive pouring-rights contracts with soft drink companies. Although none of the individual policy components had a direct effect on the probability of a student's being overweight or obese, the policies could affect intermediate outcomes, such as calories consumed at school or student attitudes. An examination of these relationships will provide a more complete picture of the effects of food and drink marketing policies on student health.
Footnotes
Overall Mix of Nutrition Policies Variable
In this section, we describe how we constructed the overall mix of nutrition policies variable, HEALTHYSC. The HEALTHYSC variable consists of five components: (1) soft drink advertising, (2) soft drink or junk food marketing, (3) offering brand-name fast foods, (4) restricting junk food sales, and (5) providing nutritional information to students. We assessed each component using one to six questions from the school administrator survey.